Abstract
Objective:
1,5 anhydroglucitol (1,5 AG) is emerging as a marker of short-term glycemic control. We measured levels of 1,5 AG, fructosamine (FA), and glycated hemoglobin (HbA1c) in Asian Indians with different degrees of glucose intolerance.
Materials and Methods:
We recruited 210 individuals with normal glucose tolerance (NGT; n = 60), impaired glucose tolerance (IGT; n = 50), and Type 2 diabetes mellitus (T2DM; n = 100) from a large tertiary diabetes center in Chennai in Southern India. Anthropometric measurements were obtained using standardized techniques. Serum 1,5 AG (enzymatic colorimetric assay), FA (NBT/kinetic), and HbA1c (high-performance liquid chromatography) estimations were performed.
Results:
1,5 AG levels were significantly lower in the T2DM followed by IGT compared with the NGT group (7.9 vs. 18.8 vs. 21.8 µg/ml, P < 0.05). FA and HbA1c were higher in T2DM and IGT compared with NGT individuals (313 vs. 237 vs. 200 µmol/L, P < 0.001) (8.3 vs. 5.8 vs. 5.3%, P < 0.001).1,5 AG showed a significant negative correlation with FA (r = −0.618, P < 0.001) and HbA1c (r = −0.700, P < 0.001). 1,5 AG decreased with increasing quartiles of postprandial glucose (P for trend <0.001). However, even among individuals with HbA1c ≤7%, 27% individuals had decreased 1,5 AG plasma level (<10 µg/ml).
Conclusion:
Circulatory levels of 1,5 AG correlate negatively with FA and HbA1c, and may provide an additional marker to assess glycemic control in patients with Type 2 diabetes.
Keywords: 1, 5 anhydroglucitol, fructosamine, glycated hemoglobin, postprandial hyperglycemia, Type 2 diabetes mellitus
INTRODUCTION
Hyperglycemia is a major risk factor for the micro- and macro-vascular complications of diabetes,[1] and lowering blood glucose levels has been shown to reduce the incidence of diabetes complications.[2] Recently, it has been shown that a decrease in glucose excursions might also be important for reducing the risk of vascular complications.[3] Studies have reported that glucose excursions are associated with oxidative stress,[4,5] coronary artery disease,[6] and may contribute to vascular damage independently of mean glucose concentration.[7,8] Glycemic variability is usually measured by self-monitoring of blood glucose (SMBG) or using a continuous glucose monitoring system. These are often inconvenient for the patients and difficult to use in clinical practice because of the pain and cost associated with these procedures.[9] Therefore, there is a need for a simple surrogate biochemical marker for glycemic variability. Glycated hemoglobin (HbA1c) is the standard clinical measurement used to monitor glycemic status and is recommended to assess control of diabetes over the preceding 2–3 months.[10,11] However, being a measure of mean glucose, it does not reflect glucose variability.[12]
1,5 anhydroglucitol (1,5 AG) is a circulatory polyol originating mainly from foods and is structurally similar to glucose.[13] Due to this similarity, glucose inhibits renal reabsorption of 1,5 AG by competitive inhibition,[14] resulting in an inverse correlation of 1,5 AG with hyperglycemia. 1,5 AG reflects the average maximum blood glucose level during the past 1-2 weeks and is reported to be a more sensitive marker of glucose variability and postprandial hyperglycemia than HbA1c, even for patients with prediabetes and for those with well or moderately controlled diabetes.[15,16,17] Some studies have reported that 1,5 AG predicts the incidence of cardiovascular diseases[18] and moderate renal dysfunction,[19] and that it could be a useful biomarker for prognosis of microvascular outcomes.[20] There are reports which suggest that compared to fructosamine (FA) or HbA1c, 1,5 AG shows a much greater sensitivity to glycemic variability, which makes 1,5 AG reliable in monitoring recent changes of glycemia.[21] There is a need for studies on 1,5 AG among Asian Indians because they are known to be more susceptible to T2DM.[22] In this study, we report on 1,5 AG, FA, and HbA1c levels and their association with various degrees of glucose intolerance, we also look at 1,5 AG as a marker of postprandial hyperglycemia among Asian Indians with Type 2 diabetes.
MATERIALS AND METHODS
Recruitment
The following study subjects were recruited from a large tertiary diabetes care center at Chennai in South India, those with normal glucose tolerance (NGT, n = 60), impaired glucose tolerance (IGT, n = 50), and Type 2 diabetes mellitus (T2DM, n = 100). All individuals, excluding those with known diabetes, underwent an oral glucose tolerance test (OGTT) using 75-g glucose load. Sample size was calculated to have power (>90%) for obtaining a correlation coefficient of 0.3 between the study parameters. We calculated a sample size of 95 had a power of >90% to detect a difference of 12 μg/ml between groups for 1,5 AG, with a standard deviation of 4.0 and an alpha error of 0.05. Institutional Ethics Committee approval was obtained before the start of the study and written informed consent was obtained from the study participants.
Anthropometric measurements
Anthropometric measurements including weight, height, and waist circumference were obtained using standardized methods.[23] Body mass index (BMI) was calculated as weight (kg)/height (m)2. Blood pressure was recorded from the right arm in a sitting position to the nearest 2 mmHg with a mercury sphygmomanometer (Diamond Deluxe BP apparatus, Pune, India). Two readings were taken 5 min apart, and the mean of the two was recorded as the blood pressure.
Biochemical tests
Fasting plasma glucose (hexokinase method), serum cholesterol (cholesterol oxidase–peroxidase–amidopyrine method), serum triglyceride (glycerol phosphate oxidase–peroxidase–amidopyrine method), high-density lipoprotein (HDL) cholesterol (direct method-immunoinhibition method) and creatinine (Jaffe Kinetic Method) measurements were performed using kits supplied by Beckman and measured using Beckman Coulter AU2700 (Fullerton, CA, USA). HbA1c was measured by high-performance liquid chromatography using the Variant II Turbo (Bio-Rad, Hercules, CA, USA). The intra- and inter-assay coefficients of variation for the biochemical assays ranged between 3.1 and 7.6%. All measurements were performed in our laboratory, which is certified by the College of American Pathologists and the National Accreditation Board for Testing and Calibration Laboratories.
1,5 Anhydroglucitol measurements
Serum 1,5 AG levels were assessed using an enzymatic, colorimetric assay kit (Glycomark®, New York, NY)[14,24,25] using the Beckman Coulter AU2700 (Fullerton, CA, USA). The assay has a sensitivity of 1.5 µg/ml, linearity <50 µg/ml, and intra- and inter-assay coefficients of variation <5%.
Fructosamine measurements
FA (NBT/kinetic) using kits supplied by Roche Diagnostics, Switzerland, was measured using the Beckman Coulter AU2700 (Fullerton, CA, USA). The assay has a sensitivity of 10 µmol/L, and intra- and inter-assay coefficients of variation ranged between 0.9% and 2.9%.
Definitions
Subjects with fasting plasma glucose <5.5 mmol/L (<100 mg/dL) and 2 h postglucose value <7.8 mmol/L (<140 mg/dl) were considered as NGT. Those with 2 h postglucose value of ≥ 7.8 mmol/L (≥140 mg/dL) and <11.1 mmol/L (<200 mg/dL) were diagnosed as IGT[26] confirmed by OGTT. Subjects were classified as T2DM if they have past medical history (self-reported diabetes under treatment by a physician) or drug treatment for diabetes (insulin or oral hypoglycemic agents).[26]
Statistical analysis
Student's t-test or one-way ANOVA (with Tukey's HSD) as appropriate were used to compare groups for continuous variables and the Chi-square test or Fisher's exact test as appropriate was used to compare proportions. Pearson's correlation analysis was carried out to determine the correlation between 1,5 AG, FA, and HbA1c. All analyses were done using SPSS statistical package (version 22.0, Chicago, IL, USA) and P < 0.05 was considered statistically significant.
RESULTS
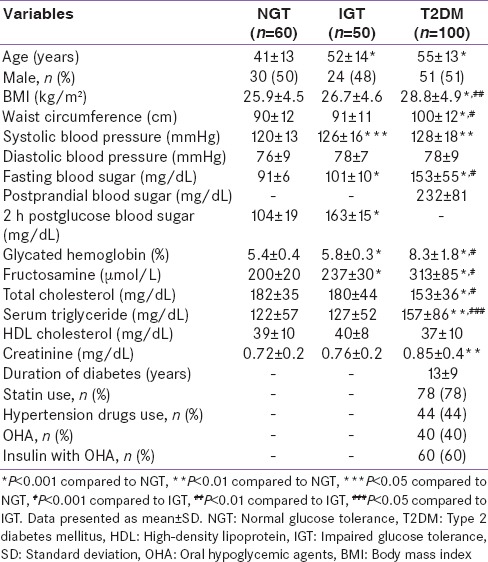
Individuals with glucose intolerance (i.e., IGT and T2DM) were older compared to NGT (P < 0.001). Systolic blood pressure (P < 0.05), fasting plasma glucose (P < 0.001), and 2 h postglucose blood sugar (P < 0.001) were higher among individuals with glucose intolerance. BMI (P < 0.01), waist circumference (P < 0.01), HbA1c (P < 0.001), FA (P < 0.001), and serum triglyceride (P < 0.05) were higher in T2DM when compared to NGT and IGT individuals [Table 1]. Patients with T2DM in this study were either on oral antidiabetic drugs (OADs) (n = 40) or OADs plus insulin (n = 60). Patients on OADs alone included 24 on metformin, 7 on metformin + DPP4 inhibitors, and 9 on both sulfonylureas + metformin. Among the patients with OADs plus insulin treatment, 38 were on insulin + metformin, 12 on insulin + metformin + DPP4 inhibitors, and 10 on insulin + sulfonylureas + metformin. There was no statistically significant difference in 1,5 AG levels between these groups. However, as the number of patients is small, this would have to be investigated further in future studies.
Table 1.
Clinical and biochemical characteristics of the study subjects
Mean levels of 1,5 AG were lowest in those with T2DM (7.9 µg/ml, P < 0.001) followed by individuals with IGT (18.8 µg/ml, P < 0.05) and NGT (21.8 µg/ml) [Figure 1].
Figure 1.
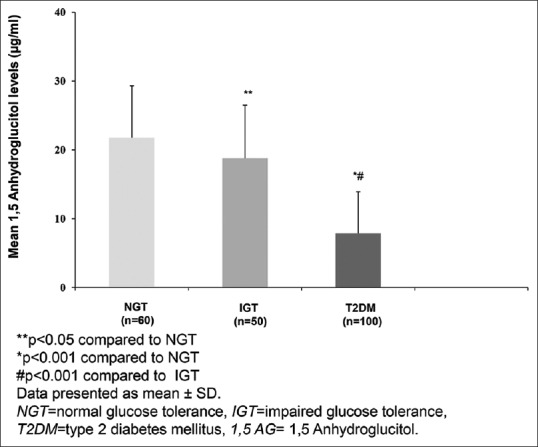
Mean 1,5 anhydroglucitol levels in individuals with different grades of glucose intolerance
Serum 1,5 AG showed a significant negative correlation with glycemic control markers FA (r = −0.618, P < 0.001) and HbA1c (r = −0.700, P < 0.001) [Figure 2a and b].
Figure 2.
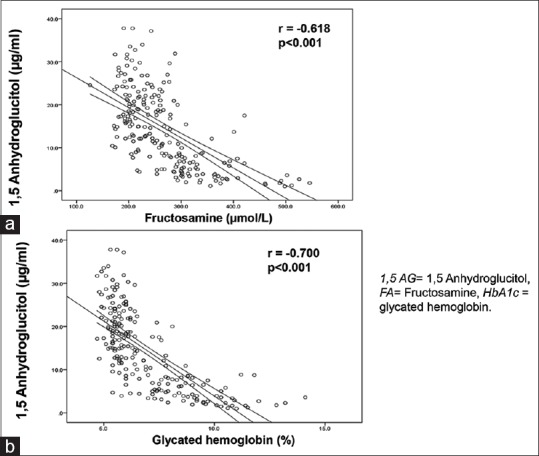
(a) Correlation between 1,5 anhydroglucitol and fructosamine. (b) Correlation between 1,5 anhydroglucitol and glycated hemoglobin
Figure 3 shows 1,5 AG stratified according to quartiles of postprandial glucose. 1,5 AG decreased significantly with increasing quartiles of postprandial glucose (P for trend <0.001). To examine the relationship between 1,5 AG and HbA1c in T2DM individuals, T2DM individuals were stratified according to their HbA1c levels as HbA1c ≤7% and >7%. About 87% of those with HbA1c >7% had 1,5 AG <10 µg/ml. However, in the well-controlled group (HbA1c ≤7%), 27% individuals had lower 1,5 AG (<10 µg/ml), which suggests that even among individuals with clinically acceptable HbA1c levels, over a quarter of them may have glucose variability with elevated postprandial spikes [Figure 4]. In patients with HbA1c <7%, we observed that 50% individuals had higher FA levels (≥260 µmol/L), but it was not significantly correlated with 1,5 AG [Supplementary Figure 1 (196KB, tif) ].
Figure 3.
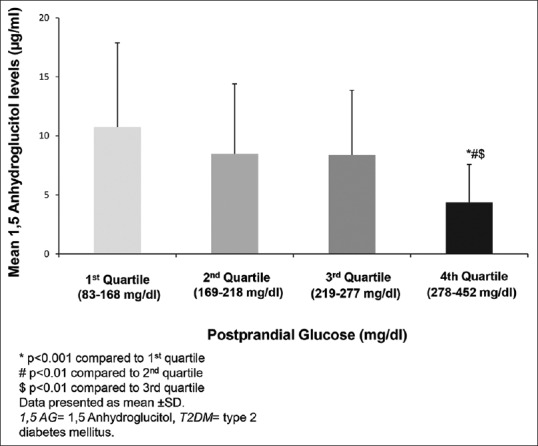
Mean 1,5 anhydroglucitol levels in quartiles of postprandial plasma glucose in individuals with Type 2 diabetes mellitus
Figure 4.
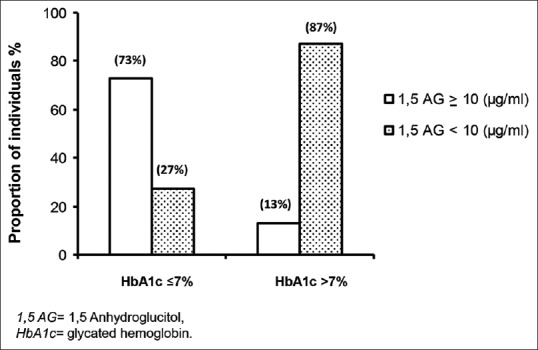
Mean levels of 1,5 anhydroglucitol in relation to glycemic control based on glycated hemoglobin levels
Mean levels of fructosamine in relation to glycemic control based on glycated hemoglobin levels
DISCUSSION
Epidemiological and clinical studies have reported that controlling blood glucose in the nonfasting state, especially the postprandial period can reduce the risk of diabetic complications.[27,28] Recent evidence shows that factors other than glycemic control as assessed by HbA1c should be considered for the prevention of cardiovascular disease.[29] In this context, the usefulness of 1,5 AG[30] correlated with postprandial hyperglycemia or glycemic variability, becomes significant. This study shows that circulatory levels of 1,5 AG are progressively lower as glucose intolerance increases, with NGT individuals having the highest values followed by those with IGT and T2DM. Further, when stratified according to postprandial glucose levels in T2DM, 1,5 AG levels were significantly lower in those with higher postprandial glucose values. Finally, 1,5 AG levels were low in 27% of T2DM individuals who had HbA1c ≤7% suggesting that these individuals might have hyperglycemic excursions. However, this is purely speculative, and further studies are needed.
Glucose fluctuations are shown to be associated with markers of oxidative stress, and these fluctuations could have deleterious effects on endothelial function and oxidative stress over and above the effects of constantly high levels of blood glucose.[4,31] A recent case–control study[31] has shown that acute fluctuations in blood glucose have a greater effect on oxidative stress, as indicated by urinary isoprostane excretion, than overall glycemic control. HbA1c only reflects the average glucose level over the prior 2–3 months and cannot indicate the level of risk that may be associated with acute glucose fluctuations. FA is formed via nonenzymatic glycation reactions[32,33] and is elevated in the setting of high circulating concentrations of glucose. Based on the turnover rate of total serum protein, FA represents average glycemia over a 2- to 3-week period.[34] Conversely, 1,5 AG levels are reflective of hyperglycemia and glucose variability, even in patients with well or moderately controlled diabetes.[24,30] Our findings are consistent with the physiology of 1,5 AG, where plasma concentrations of 1,5 AG are thought to show decreases at the highest levels of blood glucose and reflect glucose excursions.[35,36] Currently, 1,5 AG is approved by the United States Food and Drug Administration for monitoring intermediate-term glycemic control in persons with diabetes and is sometimes used for monitoring postprandial hyperglycemia.[24,30]
The ability to detect excessive exposure to postprandial hyperglycemia in individuals otherwise appearing to have acceptable glycemic control has the potential to be of clinical importance in reducing glycemic variability and excessive postprandial glycemic excursion.[37] Studies have reported that 1,5 AG was more sensitive and specific than HbA1c in predicting postprandial hyperglycemia.[24] Moreover, many individuals with HbA1c levels below the target value of 7% have low 1,5 AG levels. This suggests that excessive glycemic excursions may be occurring in these individuals. Because HbA1c is related to average glucose levels, it is also possible that hypoglycemia may have contributed to the overall lower HbA1c.[24] We found that levels of 1,5 AG were significantly correlated with FA or HbA1c and reduced with increased quartiles of postprandial glucose in T2DM patients. These observations support the usefulness of 1,5 AG as an ancillary measure of postprandial hyperglycemia for evaluation of worsening glycemic control. Thus, 1,5 AG measurements may be an important tool to assess diabetes control as an adjunct to HbA1c and FA. However, the addition of agents that specifically address postprandial hyperglycemia with the goal of improving 1,5 AG levels needs to be tested in future clinical trials. The cost-effectiveness of measuring 1,5 AG also needs to be studied.
The strength of this study is that it is the first study to demonstrate the usefulness of 1,5 AG levels along with traditional glycemic markers in Asian Indians with NGT, IGT, and T2DM. One of the limitations of the study is that being a cross-sectional study, no cause and effect relationship between 1,5 AG and T2DM could be established; prospective studies will be needed to further explore this relationship. The second limitation is that we did not perform continuous glucose monitoring or SMBG to correlate them with 1,5 AG levels.
CONCLUSION
In summary, we report on the usefulness of 1,5 AG as an additional tool to assess short-term glycemic control, compared to serum FA and HbA1c in Asian Indians with different degrees of glucose intolerance.
Financial support and sponsorship
Nil.
Conflicts of interest
There are no conflicts of interest.
Acknowledgment
We thank the participants and the staff of Dr. Mohan's Diabetes Specialities Centre and the Madras Diabetes Research Foundation, Chennai, for their help with this study.
REFERENCES
- 1.The effect of intensive treatment of diabetes on the development and progression of long-term complications in insulin-dependent diabetes mellitus. The Diabetes Control and Complications Trial Research Group. N Engl J Med. 1993;329:977–86. doi: 10.1056/NEJM199309303291401. [DOI] [PubMed] [Google Scholar]
- 2.Stratton IM, Adler AI, Neil HA, Matthews DR, Manley SE, Cull CA, et al. Association of glycaemia with macrovascular and microvascular complications of type 2 diabetes (UKPDS 35): Prospective observational study. BMJ. 2000;321:405–12. doi: 10.1136/bmj.321.7258.405. [DOI] [PMC free article] [PubMed] [Google Scholar]
- 3.Quagliaro L, Piconi L, Assaloni R, Martinelli L, Motz E, Ceriello A. Intermittent high glucose enhances apoptosis related to oxidative stress in human umbilical vein endothelial cells: The role of protein kinase C and NAD(P)H-oxidase activation. Diabetes. 2003;52:2795–804. doi: 10.2337/diabetes.52.11.2795. [DOI] [PubMed] [Google Scholar]
- 4.Ceriello A, Esposito K, Piconi L, Ihnat MA, Thorpe JE, Testa R, et al. Oscillating glucose is more deleterious to endothelial function and oxidative stress than mean glucose in normal and type 2 diabetic patients. Diabetes. 2008;57:1349–54. doi: 10.2337/db08-0063. [DOI] [PubMed] [Google Scholar]
- 5.Monnier L, Colette C, Mas E, Michel F, Cristol JP, Boegner C, et al. Regulation of oxidative stress by glycaemic control: Evidence for an independent inhibitory effect of insulin therapy. Diabetologia. 2010;53:562–71. doi: 10.1007/s00125-009-1574-6. [DOI] [PubMed] [Google Scholar]
- 6.Su G, Mi S, Tao H, Li Z, Yang H, Zheng H, et al. Association of glycemic variability and the presence and severity of coronary artery disease in patients with type 2 diabetes. Cardiovasc Diabetol. 2011;10:19. doi: 10.1186/1475-2840-10-19. [DOI] [PMC free article] [PubMed] [Google Scholar]
- 7.Ceriello A, Taboga C, Tonutti L, Quagliaro L, Piconi L, Bais B, et al. Evidence for an independent and cumulative effect of postprandial hypertriglyceridemia and hyperglycemia on endothelial dysfunction and oxidative stress generation: Effects of short- and long-term simvastatin treatment. Circulation. 2002;106:1211–8. doi: 10.1161/01.cir.0000027569.76671.a8. [DOI] [PubMed] [Google Scholar]
- 8.Meigs JB, Nathan DM, D’Agostino RB, Sr, Wilson PW. Framingham Offspring Study. Fasting and postchallenge glycemia and cardiovascular disease risk: The Framingham Offspring Study. Diabetes Care. 2002;25:1845–50. doi: 10.2337/diacare.25.10.1845. [DOI] [PubMed] [Google Scholar]
- 9.Siegelaar SE, Holleman F, Hoekstra JB, DeVries JH. Glucose variability; does it matter? Endocr Rev. 2010;31:171–82. doi: 10.1210/er.2009-0021. [DOI] [PubMed] [Google Scholar]
- 10.Standards of medical care in diabetes-2015: Summary of revisions. Diabetes Care. 2015;38(Suppl):S4. doi: 10.2337/dc15-S003. [DOI] [PubMed] [Google Scholar]
- 11.Hu Y, Liu W, Chen Y, Zhang M, Wang L, Zhou H, et al. Combined use of fasting plasma glucose and glycated hemoglobin A1c in the screening of diabetes and impaired glucose tolerance. Acta Diabetol. 2010;47:231–6. doi: 10.1007/s00592-009-0143-2. [DOI] [PubMed] [Google Scholar]
- 12.American Diabetes Association. Postprandial blood glucose. American Diabetes Association. Diabetes Care. 2001;24:775–8. doi: 10.2337/diacare.24.4.775. [DOI] [PubMed] [Google Scholar]
- 13.Yamanouchi T, Akanuma Y. Serum 1,5-anhydroglucitol (1,5 AG): New clinical marker for glycemic control. Diabetes Res Clin Pract. 1994;24(Suppl):S261–8. doi: 10.1016/0168-8227(94)90259-3. [DOI] [PubMed] [Google Scholar]
- 14.Buse JB, Freeman JL, Edelman SV, Jovanovic L, McGill JB. Serum 1,5-anhydroglucitol (GlycoMark): A short-term glycemic marker. Diabetes Technol Ther. 2003;5:355–63. doi: 10.1089/152091503765691839. [DOI] [PubMed] [Google Scholar]
- 15.Kim WJ, Park CY. 1,5-Anhydroglucitol in diabetes mellitus. Endocrine. 2013;43:33–40. doi: 10.1007/s12020-012-9760-6. [DOI] [PubMed] [Google Scholar]
- 16.Kim MJ, Jung HS, Hwang-Bo Y, Cho SW, Jang HC, Kim SY, et al. Evaluation of 1,5-anhydroglucitol as a marker for glycemic variability in patients with type 2 diabetes mellitus. Acta Diabetol. 2013;50:505–10. doi: 10.1007/s00592-011-0302-0. [DOI] [PubMed] [Google Scholar]
- 17.Won JC, Park CY, Park HS, Kim JH, Choi ES, Rhee EJ, et al. 1,5-anhydroglucitol reflects postprandial hyperglycemia and a decreased insulinogenic index, even in subjects with prediabetes and well-controlled type 2 diabetes. Diabetes Res Clin Pract. 2009;84:51–7. doi: 10.1016/j.diabres.2009.01.002. [DOI] [PubMed] [Google Scholar]
- 18.Selvin E, Rawlings A, Lutsey P, Maruthur N, Pankow JS, Steffes M, et al. Association of 1,5-anhydroglucitol with cardiovascular disease and mortality. Diabetes. 2016;65:201–8. doi: 10.2337/db15-0607. [DOI] [PMC free article] [PubMed] [Google Scholar]
- 19.Kim WJ, Park CY, Lee KB, Park SE, Rhee EJ, Lee WY, et al. Serum 1,5-anhydroglucitol concentrations are a reliable index of glycemic control in type 2 diabetes with mild or moderate renal dysfunction. Diabetes Care. 2012;35:281–6. doi: 10.2337/dc11-1462. [DOI] [PMC free article] [PubMed] [Google Scholar]
- 20.Selvin E, Rawlings AM, Grams M, Klein R, Steffes M, Coresh J. Association of 1,5-anhydroglucitol with diabetes and microvascular conditions. Clin Chem. 2014;60:1409–18. doi: 10.1373/clinchem.2014.229427. [DOI] [PMC free article] [PubMed] [Google Scholar]
- 21.Yamanouchi T, Akanuma Y, Toyota T, Kuzuya T, Kawai T, Kawazu S, et al. Comparison of 1,5-anhydroglucitol, HbA1c, and fructosamine for detection of diabetes mellitus. Diabetes. 1991;40:52–7. doi: 10.2337/diab.40.1.52. [DOI] [PubMed] [Google Scholar]
- 22.Anjana RM, Pradeepa R, Deepa M, Datta M, Sudha V, Unnikrishnan R, et al. Prevalence of diabetes and prediabetes (impaired fasting glucose and/or impaired glucose tolerance) in urban and rural India: Phase I results of the Indian Council of Medical Research-INdia DIABetes (ICMR-INDIAB) study. Diabetologia. 2011;54:3022–7. doi: 10.1007/s00125-011-2291-5. [DOI] [PubMed] [Google Scholar]
- 23.Deepa M, Pradeepa R, Rema M, Mohan A, Deepa R, Shanthirani S, et al. The Chennai Urban Rural Epidemiology Study (CURES) – Study design and methodology (urban component) (CURES-I) J Assoc Physicians India. 2003;51:863–70. [PubMed] [Google Scholar]
- 24.Dungan KM, Buse JB, Largay J, Kelly MM, Button EA, Kato S, et al. 1,5-anhydroglucitol and postprandial hyperglycemia as measured by continuous glucose monitoring system in moderately controlled patients with diabetes. Diabetes Care. 2006;29:1214–9. doi: 10.2337/dc06-1910. [DOI] [PubMed] [Google Scholar]
- 25.McGill JB, Cole TG, Nowatzke W, Houghton S, Ammirati EB, Gautille T, et al. Circulating 1,5-anhydroglucitol levels in adult patients with diabetes reflect longitudinal changes of glycemia: A U.S. trial of the GlycoMark assay. Diabetes Care. 2004;27:1859–65. doi: 10.2337/diacare.27.8.1859. [DOI] [PubMed] [Google Scholar]
- 26.Alberti KG, Zimmet PZ. Definition, diagnosis and classification of diabetes mellitus and its complications. Part 1: Diagnosis and classification of diabetes mellitus provisional report of a WHO consultation. Diabet Med. 1998;15:539–53. doi: 10.1002/(SICI)1096-9136(199807)15:7<539::AID-DIA668>3.0.CO;2-S. [DOI] [PubMed] [Google Scholar]
- 27.Writing Team for the Diabetes Control and Complications Trial/Epidemiology of Diabetes Interventions and Complications Research Group. Effect of intensive therapy on the microvascular complications of type 1 diabetes mellitus. JAMA. 2002;287:2563–9. doi: 10.1001/jama.287.19.2563. [DOI] [PMC free article] [PubMed] [Google Scholar]
- 28.Derr R, Garrett E, Stacy GA, Saudek CD. Is HbA(1c) affected by glycemic instability? Diabetes Care. 2003;26:2728–33. doi: 10.2337/diacare.26.10.2728. [DOI] [PubMed] [Google Scholar]
- 29.Ogawa A, Hayashi A, Kishihara E, Yoshino S, Takeuchi A, Shichiri M. New indices for predicting glycaemic variability. PLoS One. 2012;7:e46517. doi: 10.1371/journal.pone.0046517. [DOI] [PMC free article] [PubMed] [Google Scholar]
- 30.Stettler C, Stahl M, Allemann S, Diem P, Schmidlin K, Zwahlen M, et al. Association of 1,5-anhydroglucitol and 2-h postprandial blood glucose in type 2 diabetic patients. Diabetes Care. 2008;31:1534–5. doi: 10.2337/dc08-0385. [DOI] [PMC free article] [PubMed] [Google Scholar]
- 31.Monnier L, Mas E, Ginet C, Michel F, Villon L, Cristol JP, et al. Activation of oxidative stress by acute glucose fluctuations compared with sustained chronic hyperglycemia in patients with type 2 diabetes. JAMA. 2006;295:1681–7. doi: 10.1001/jama.295.14.1681. [DOI] [PubMed] [Google Scholar]
- 32.Rondeau P, Bourdon E. The glycation of albumin: Structural and functional impacts. Biochimie. 2011;93:645–58. doi: 10.1016/j.biochi.2010.12.003. [DOI] [PubMed] [Google Scholar]
- 33.Armbruster DA. Fructosamine: Structure, analysis, and clinical usefulness. Clin Chem. 1987;33:2153–63. [PubMed] [Google Scholar]
- 34.Howey JE, Bennet WM, Browning MC, Jung RT, Fraser CG. Clinical utility of assays of glycosylated haemoglobin and serum fructosamine compared: Use of data on biological variation. Diabet Med. 1989;6:793–6. doi: 10.1111/j.1464-5491.1989.tb01281.x. [DOI] [PubMed] [Google Scholar]
- 35.Wang Y, Zhang YL, Wang YP, Lei CH, Sun ZL. A study on the association of serum 1,5-anhydroglucitol levels and the hyperglycaemic excursions as measured by continuous glucose monitoring system among people with type 2 diabetes in China. Diabetes Metab Res Rev. 2012;28:357–62. doi: 10.1002/dmrr.2278. [DOI] [PMC free article] [PubMed] [Google Scholar]
- 36.Goto M, Yamamoto-Honda R, Shimbo T, Goto A, Terauchi Y, Kanazawa Y, et al. Correlation between baseline serum 1,5-anhydroglucitol levels and 2-hour post-challenge glucose levels during oral glucose tolerance tests. Endocr J. 2011;58:13–7. doi: 10.1507/endocrj.k10e-224. [DOI] [PubMed] [Google Scholar]
- 37.Brownlee M, Hirsch IB. Glycemic variability: A hemoglobin A1c-independent risk factor for diabetic complications. JAMA. 2006;295:1707–8. doi: 10.1001/jama.295.14.1707. [DOI] [PubMed] [Google Scholar]
Associated Data
This section collects any data citations, data availability statements, or supplementary materials included in this article.
Supplementary Materials
Mean levels of fructosamine in relation to glycemic control based on glycated hemoglobin levels


