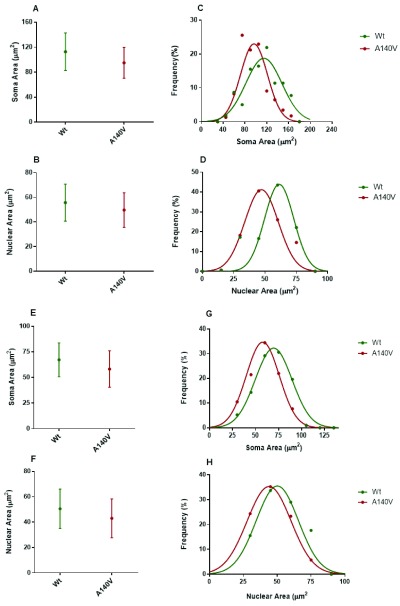
Figure 3. Neuronal soma and nuclear size distributions in the hippocampus and cerebellar granule cells.
Average neuronal soma ( A) and nuclear ( B) size of hippocampus cells at 5 DIV from mutant and wild type. Frequency distributions of hippocampus soma ( C) and nuclear ( D) size are significantly different from mutant and wild type (p < 0.01). Average CGN neuronal soma ( E) and nuclear ( F) size at 5 DIV from mutant and wild type animals. Frequency distributions of CGN soma ( D) and nuclear ( E) areas are significantly different from mutant and wild type (p < 0.05).

