Summary
Whether protein synthesis and cellular stress response pathways interact to control stem cell function is currently unknown. Here, we show that skin stem cells synthesize less protein than their immediate progenitors in vivo, even when forced to proliferate. Our analyses reveal that activation of stress response pathways drives both a global reduction of protein synthesis and altered translational programmes that together promote stem cell functions and tumourigenesis. Mechanistically we show that inhibition of post-transcriptional cytosine-5 methylation locks stem cells in this distinct translational inhibition programme. Paradoxically, this inhibition renders stem cells hypersensitive to cytotoxic stress, as tumour regeneration after treatment with 5-fluorouracil is blocked. Thus, stem cells must revoke translation inhibition pathways to regenerate a tissue or tumour.
Introduction
Protein synthesis is a fundamental process for all cells, but its precise regulatory roles in development, stem cells, and cancer are not well understood. We recently identified post-transcriptional methylation of transfer RNA (tRNA) at cytosine-5 (m5C) by NSun2 as a novel mechanism to repress global protein synthesis1,2. Loss of NSun2 causes hypo-methylation of tRNAs, allowing endonucleolytic cleavage by angiogenin and accumulation of 5’ tRNA fragments1,3. These fragments repress cap-dependent protein translation4–7.
Correct RNA methylation is essential for development and tissue homeostasis. Loss-of-function mutations in human NSUN2 cause growth retardation and neuro-developmental defects including microcephaly1,8–10. In mouse, NSun2-associated microcephaly can be rescued by inhibiting angiogenin-mediated tRNA-cleavage1. In adult tissues (testis and skin), NSun2 is only expressed in a sub-population of committed progenitors, where its activity balances self-renewal and differentiation11,12.
Here, we reveal that the interplay between RNA methylation and translation shapes stem cell fate. Using skin as a model, we demonstrate that stem cells have lower protein synthesis than committed cells in both homeostasis and tumourigenesis. Low translation functionally contributes to maintain stem cells, and is not merely a consequence of quiescence or cell cycle state. By genetically deleting NSun2 in a tumour mouse model, we find that protein synthesis is globally repressed; however, distinct transcripts escape this repression and establish a translational programme crucial to stimulate stem cell functions. Unexpectedly, the selective alteration of translation is remarkably effective in rendering stem cells sensitive to cytotoxic stress.
Results
Stem cells synthesize less protein than their progeny
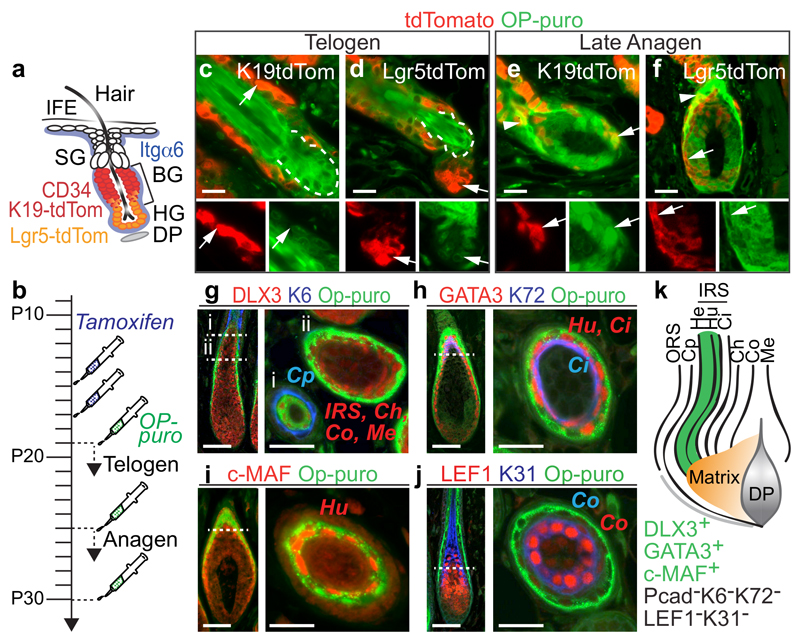
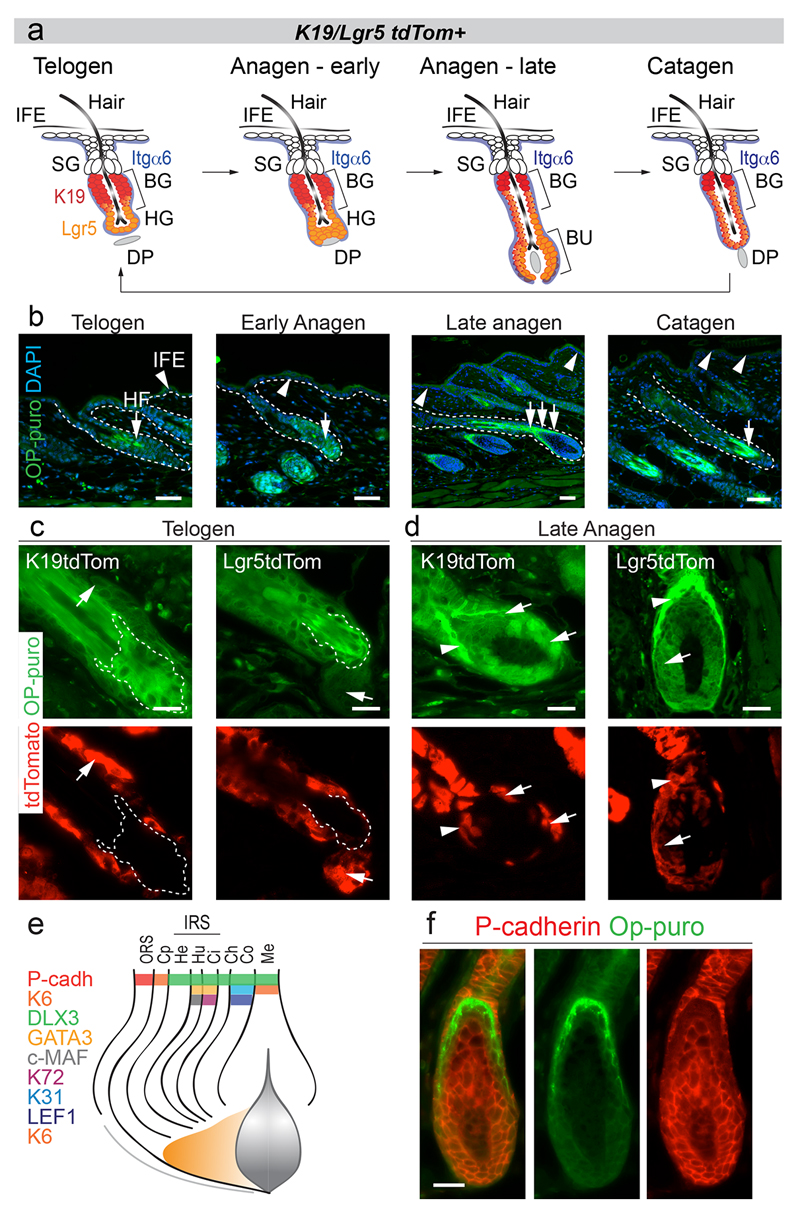
In skin, the best-characterized stem cell populations reside in the hair follicle13. Hair follicle stem cells (HFSC) are periodically activated at the onset of hair growth (anagen), which is followed by phases of regression (catagen) and rest (telogen) (Extended Data Fig. 1a)14,15. HFSCs located in the bulge (BG) express the stem cell markers CD34, keratin-19 (K19) and Lgr5 (Fig. 1a)16,17.
Figure 1. Hair follicle stem cells synthesize less protein than their progeny.
a, Epidermal populations analyzed. IFE: interfollicular epidermis, SG: sebaceous gland, BG: bulge, HG: hair germ, DP: dermal papilla. b, Treatment regimes. c-f, Detection of tdTomato (tdTom) and OP-puro in back skin of tdTom mice in telogen (c,d) and late anagen (e,f). Arrows: tdTom+ cells (magnification lower panels). Arrowheads: tdTom+/OP-purohigh cells. Dotted line: lower bulge. g-j, OP-puro and hair follicle lineage markers (late anagen). Dotted lines: cross section (i, ii). k, Schematic summary of (g-j). OP-puro+ layers (green). Scale bars: 50 μm.
To visualize HFSCs and their progeny, we genetically labeled K19- and Lgr5-expressing bulge stem cells with a tdTomato (tdTom) reporter (Fig. 1a,b; Extended Data Fig. 1a)16,18. To measure global protein synthesis we quantified incorporation of OP-puromycin (OP-puro) into nascent proteins (Fig. 1b)19. Protein synthesis was uniformly low in the interfollicular epidermis (IFE), but highly dynamic in hair follicles throughout the hair cycle (Extended Data Fig. 1b). In telogen, highly translating cells at the follicle base were not stem cells, as they were negative for tdTomato (Fig. 1c,d; Extended Data Fig. 1c). In late anagen, OP-puro co-localized with tdTomato in committed progenitors located in the hair bulb (Fig. 1e,f; Extended Data Fig. 1d; arrows). The highest translation was displayed above the hair matrix, which contains committed progenitors that divide a finite number of times before differentiating (Fig. 1e,f; Extended Data Fig. 1d; arrowheads)20.
Co-labeling of OP-puro with markers for all hair lineages identified the Henle’s (He) and Huxley’s (Hu) layers of the inner root sheath (IRS) as the lineages with highest translation (Fig. 1g-k; Extended Data Fig. 1e,f)21,22. Both IRS layers exclusively contain committed and differentiated cells22.
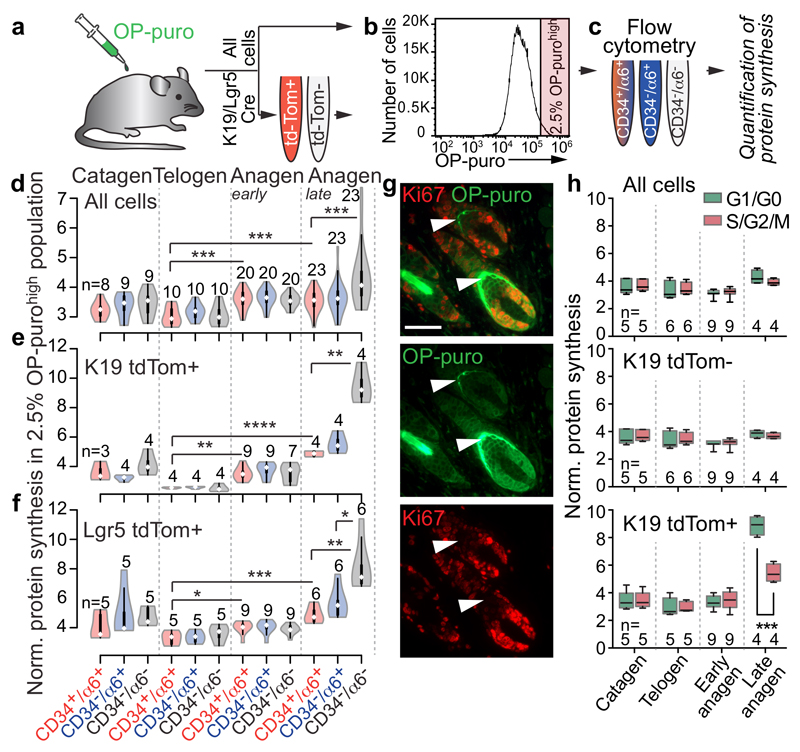
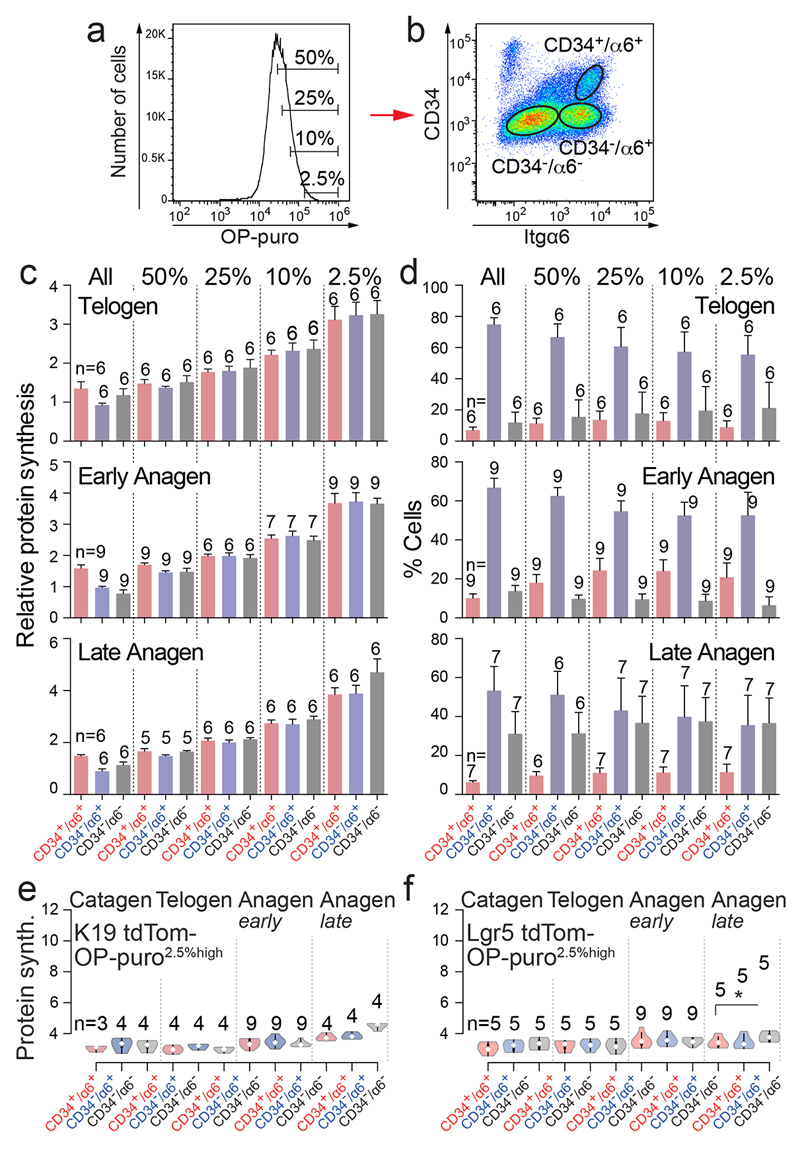
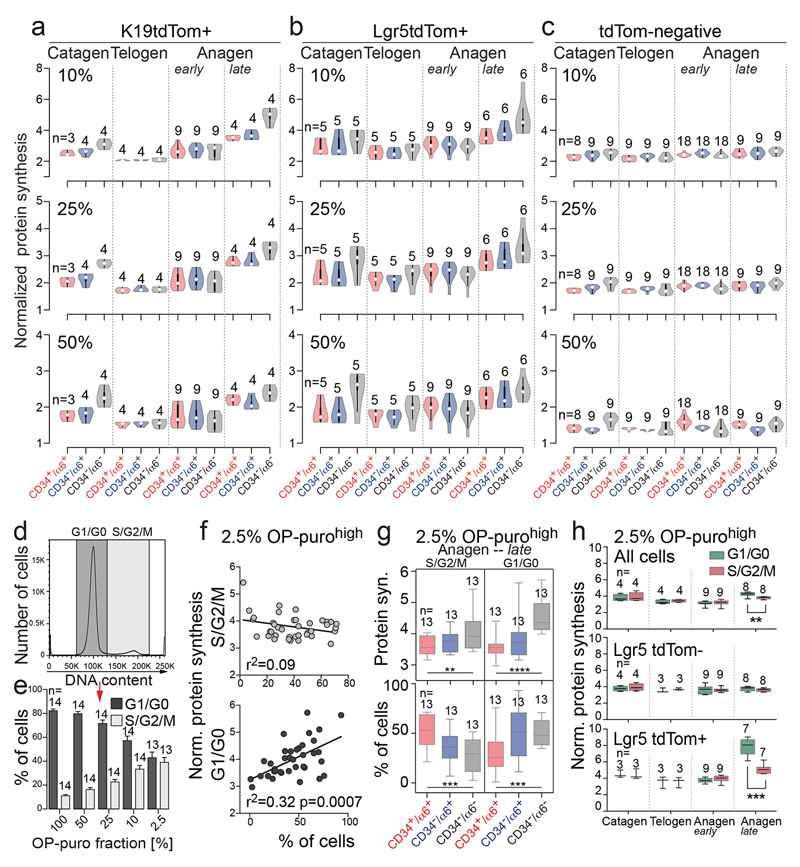
To fully quantify protein synthesis in distinct epidermal populations, we flow-sorted bulge stem cells (CD34+/α6+), non-bulge cells (CD34-/α6+), and differentiated cells (CD34-/α6-) (Fig. 2a-c)17. To capture epidermal cells giving rise to the highly translating IRS, we enriched for OP-purohigh cells (top 2.5% in rate of translation) (Fig. 2b). The selection for high translation did not perturb the proportion of cell populations found in the epidermis (Extended Data Fig. 2a-d). Quantification of OP-puro incorporation confirmed that protein synthesis was highest in differentiated populations in late anagen (Fig. 2d). Translation in bulge stem cells significantly increased from telogen to anagen (Fig. 2d), suggesting a correlation between translation rate and stem cell activation.
Figure 2. Protein synthesis correlates with differentiation.
a-c, Experimental set up. d-f, Violin plots of normalized protein synthesis in OP-purohigh cells sorted for indicated epidermal populations (c). Itgα6: α6. g, Ki67 and OP-puro detection (late anagen). Arrowheads: Ki67-/OP-puro+ cells. Scale bar: 50 μm. h, Box plots of protein synthesis in cycling (S/G2/M) and non-dividing (G1/G0) OP-purohigh cells. n=mice. *p<0.05, **p < 0.01, ***p < 0.001, ****p<0.0001 (Two-tailed Student’s t-test). Source data: SI_Fig2.
Next, we focused on HFSCs and their progeny and quantified protein translation in tdTomato+ cells that were sorted into bulge stem cells, non-bulge cells, and differentiating cells (Fig. 2e,f). Translation rates significantly increased in bulge HFSCs from telogen to anagen (Fig. 2e,f). In addition, the average translation rate increased in differentiating cells in late anagen, and was around 2-fold higher compared to the background cells (tdTomato-) (Fig. 2d-f; Extended Data Fig. 2e,f). These results were robust to the specific threshold used to identify cells as highly translating (top 2.5% - 50%) (Extended Data Fig. 3a-c).
Thus, as stem cells proceed into a fully committed progenitor state, protein translation steadily increases.
Proliferation does not determine protein synthesis
Protein synthesis was highest in growing hair follicles. However, cellular division alone did not explain translation rates as the greatest protein synthesis was found in differentiating but non-dividing (Ki67-negative) cells (Fig. 2g). Although the percentage of cycling (S/G2/M) cells correlated with increasing translation rates (Extended Data Fig. 3d,e), differentiating (CD34-/α6-) and non-dividing (G1/G0) cells represented the population with the highest translation (Extended Data Fig. 3f,g).
To directly test whether protein synthesis was determined by lineage commitment instead, we measured the translation rate in bulge HFSC and their offspring (tdTomato+) along the cell cycle. In late anagen, non-cycling (G1/G0) stem and progenitor cells synthesized significant more protein than their cycling (S/G2/M) counterparts (Fig. 2h; Extended Data Fig. 3h). Thus, increasing translation rates correlated with stem cell commitment and differentiation rather than proliferation (Extended Data Fig. 4p).
Dividing tumour-initiating cells synthesize low levels of protein
To test whether low protein synthesis simply reflected a quiescent state, we investigated translation rates in cancer-initiating cells, which exhibit both high self-renewal and proliferation capacity. We used K5-SOS mice, which constitutively activate RAS in basal epidermal cells and develop well-differentiated tumours resembling human squamous tumours23,24.
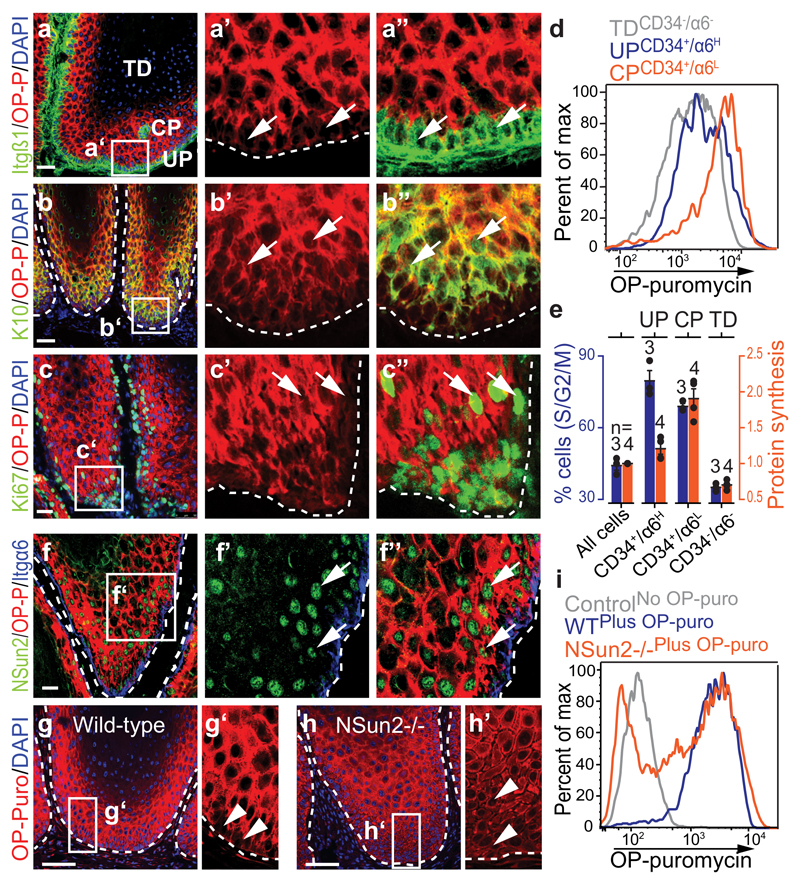
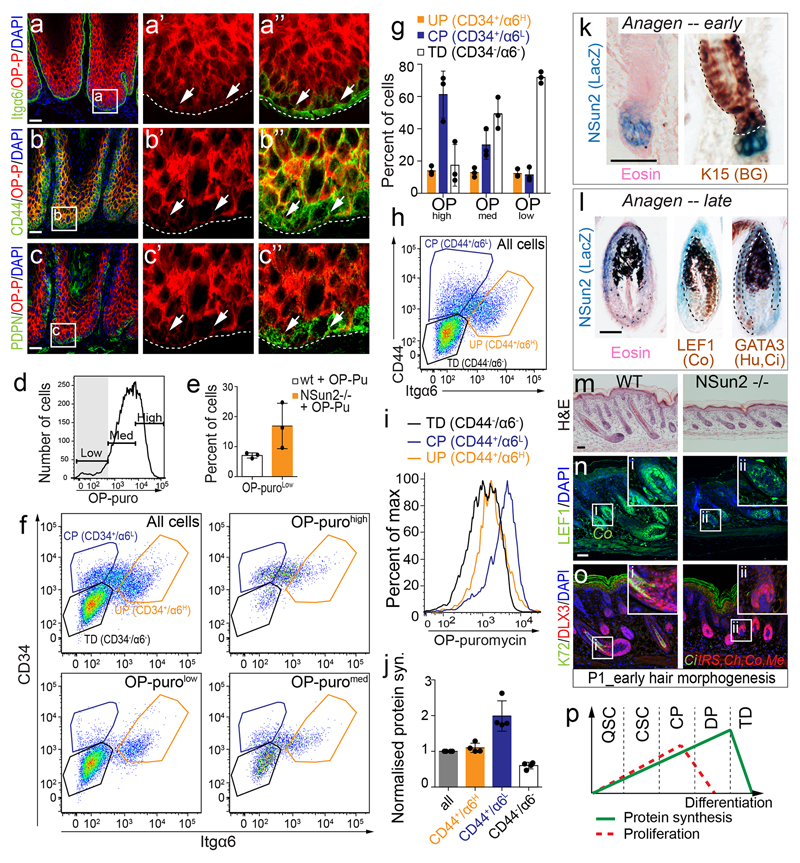
Undifferentiated progenitors (UP) expressed markers for tumourigenesis and tumour-initiating cells (Itgβ1, Itgα6, CD44, CD34, PDNP)25–29, and exhibited lower protein synthesis than committed progenitors (CP) (Fig. 3a,d; Extended Data Fig. 4a-c,f-j). Translation was highest in supra-basal and differentiating CP (K10+), but absent in terminally differentiated (TD), non-tumourigenic cells (Fig. 3a,b). In cancer, elevated translation has been associated with increased proliferation30. However, in our data high translation was uncoupled from proliferation because both OP-puro-high and -low cells expressed Ki67 (Fig 3c), and protein synthesis did not correlate with cycling cells (Fig. 3e).
Figure 3. Tumour-initiating cells synthesize less protein than their progeny.
a-c, Co-labeling OP-puro with indicated markers. Arrows: marker+ cells. d, Flow cytometry for OP-puro incorporation. e, Percentage of dividing cells (S/G2/M) and normalized protein synthesis (mean± s.d.; n=mice). f, Co-staining OP-puro, NSun2, Itgα6. Arrows: OP-puro+/NSun2+ cells. g-i, OP-puro-detection in sections (g, h) or by flow cytometry (i). Arrowheads: OP-purolow cells. Nuclei: DAPI. Scale bars: 50 μm. Dotted line: basal membrane. All analyses are in K5-SOS tumours. Source data: SI_Fig3.
Thus, similar to normal skin, stem and progenitor cells in tumours produced less protein than their committed progeny.
Forced reduction of protein synthesis enriches for tumour-initiating cells
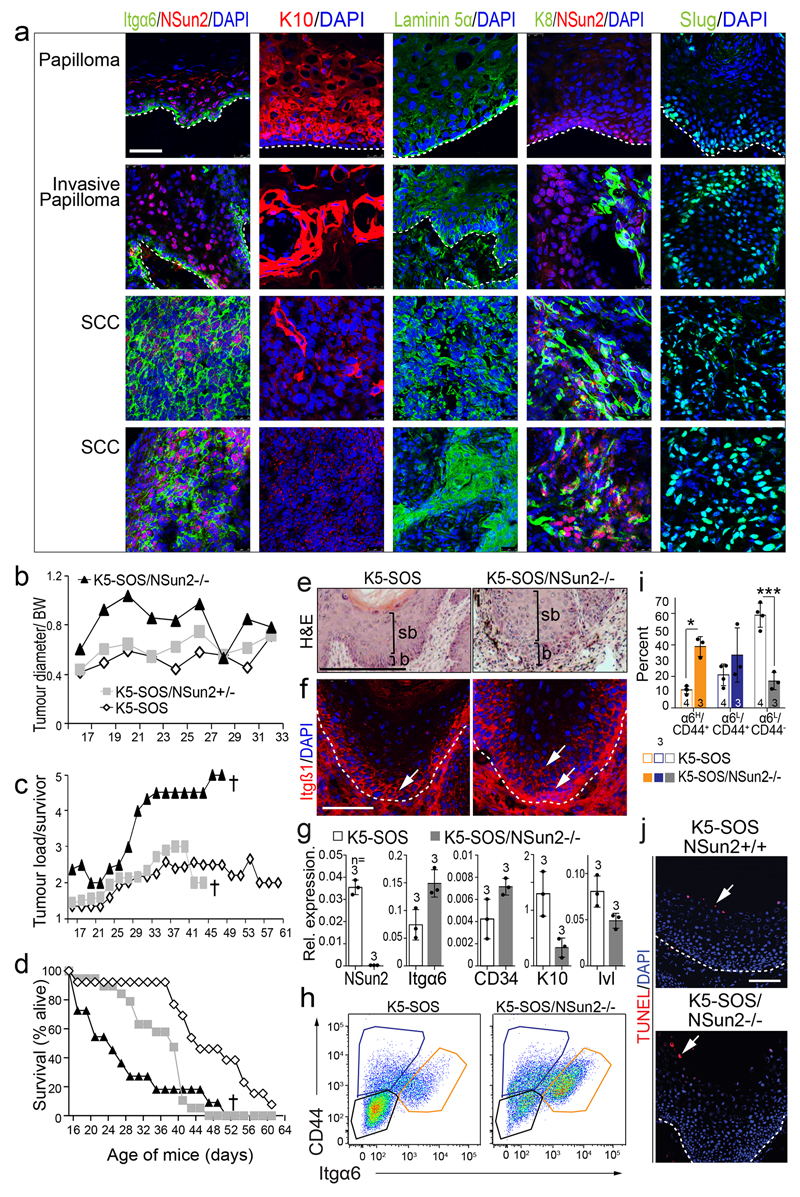
To test whether low translation is cause or consequence of a stem cell state requires the ability to modulate protein synthesis. An excellent system is the genetic deletion of the RNA-methyltransferase NSun2. NSun2 modulates global translation by protecting tRNAs from cleavage1. In normal skin, NSun2 is restricted to distinct hair follicle populations11 that overlap with OP-purohigh cells in early and late anagen (Extended Data Fig. 4k,l). NSun2-deletion delayed HFSC differentiation in adult11 and developing skin (Extended Data Fig. 4m-o). NSun2 is up-regulated in epithelial tumours and homogenously expressed in mouse and human squamous cell carcinomas (Extended Data Fig. 5a)31,32, and its expression is restricted to highly translating cells in K5-SOS tumours (Fig. 3f).
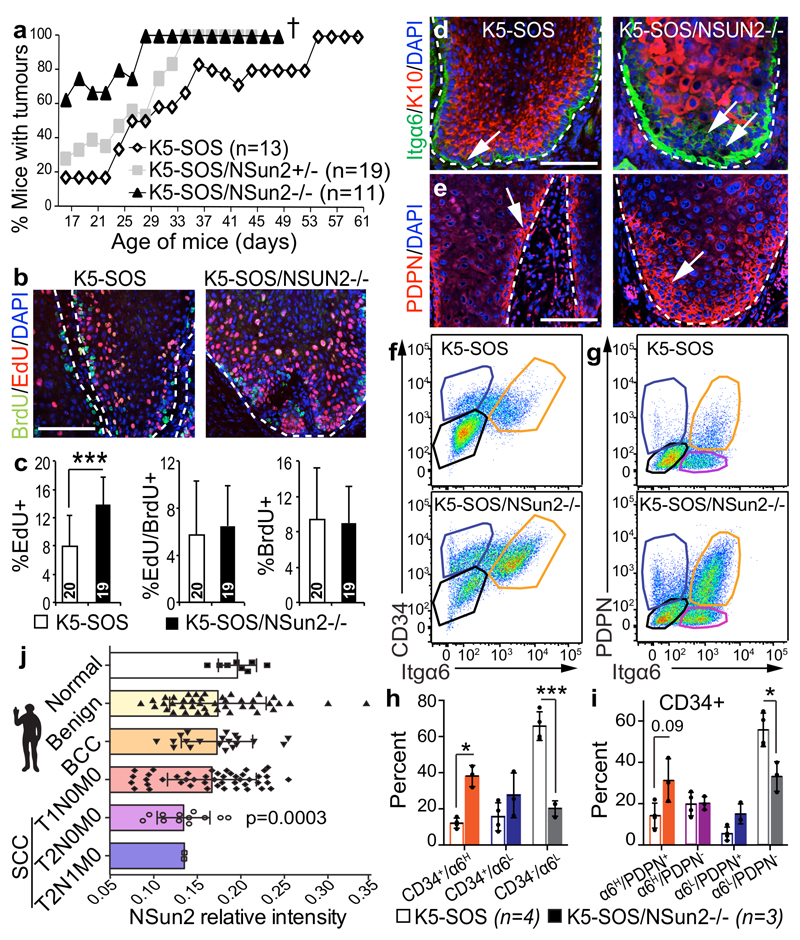
We deleted NSun2 in K5-SOS mice, and measured OP-puro incorporation into the offsprings’ tumours. As expected, NSun2-ablation reduced protein synthesis in tumours (Fig. 3g-i; Extended Data Fig. 4d,e). K5-SOS/NSun2-/- mice developed more tumours that appeared earlier, grew larger, and reduced the life span (Fig. 4a; Extended Data Fig. 5b-d).
Figure 4. NSun2-deletion promotes stem cell identity and tumourigenesis.
a, Tumour incidence. †: Deceased. b, c, Detection (b) and quantification (c) of pulsed-chased BrdU+ and EdU+ cells in tumours (see Methods). n = 5 slides x 3 mice. d, e, Immunostaining for Itgα6, K10 (d) and PDPN (e). Arrows: marker+ cells. Nuclei (DAPI); dotted line: basal membrane; scale bars: 100 μm. f-i, Flow cytometry (f, g) and quantification (h, i) of marker+ tumour cells. n=mice. j, NSun2 protein expression in human normal skin or tumours (mean ± s.d.). *p < 0.05; ***p< 0.001 (two-tailed Student’s t-test). Source data: SI_Fig4.
NSun2-/- tumours appeared more proliferative; however, EdU/BrdU pulse-chase experiments revealed that high EdU incorporation reflected an increased undifferentiated population, but not a faster division rate (Fig 4b,c; Extended Data Fig. 5e,f). NSun2-/- tumours were poorly differentiated and in a later stage of tumourigenesis as shown by increased expression of stem cell- and tumour progression-markers (Fig. 4d-i; Extended Data Fig. 5f-j).
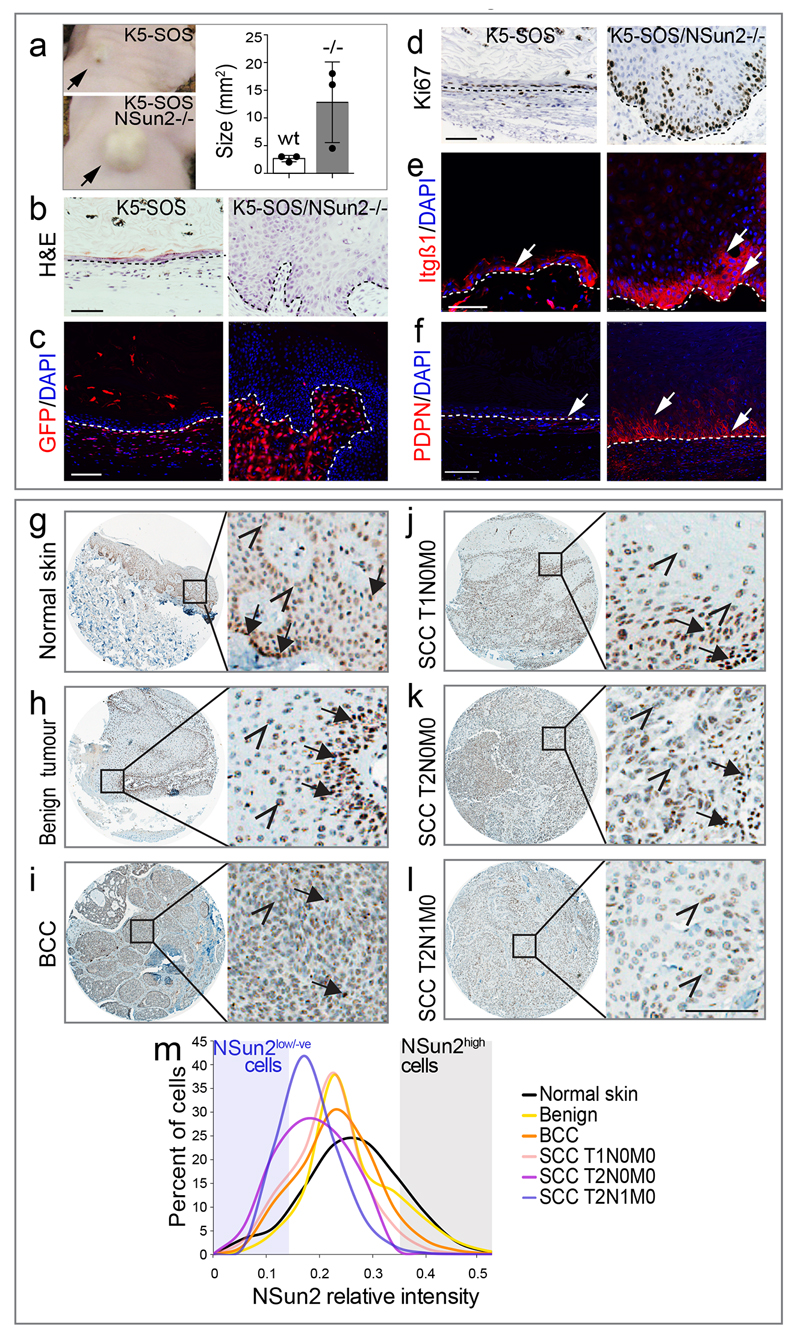
To test for the cell-intrinsic, tumour-initiating potential, we injected NSun2-/- tumour cells subcutaneously into nude mice (Extended Data Fig. 6a). Only NSun2-/- cancer cells reconstituted the original squamous tumour with high proliferative potential and elevated levels of Itgβ1 and PDPN (Extended Data Fig. 6b-f). Thus, NSun2-deletion enhances self-renewal potential of tumour-initiating cells in a cell-autonomous manner.
Also in human skin cancer NSun2 expression was inversely correlated with malignancy, when we compared protein expression levels in normal skin and cutaneous cancers of increasing TNM stages (Fig. 4j; Extended Data Fig. 6g-m).
These results argue that reduction of translation rates caused by NSun2-deletion increased the tumour-initiating population.
tRNA fragments as mediators of a stem cell translational programme
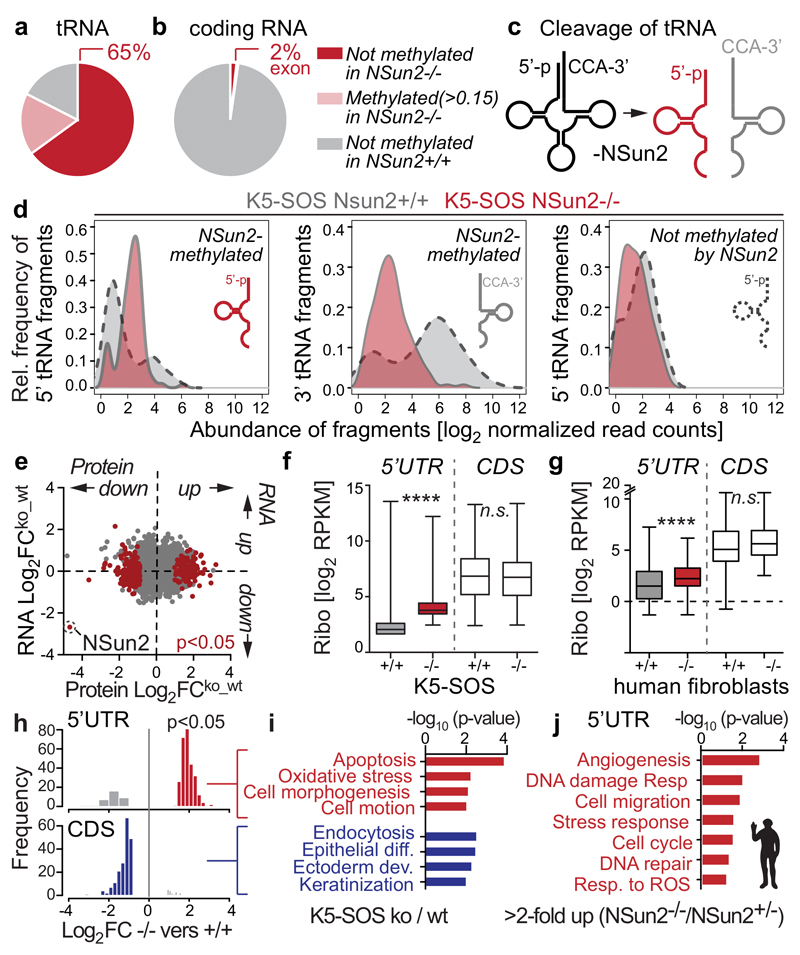
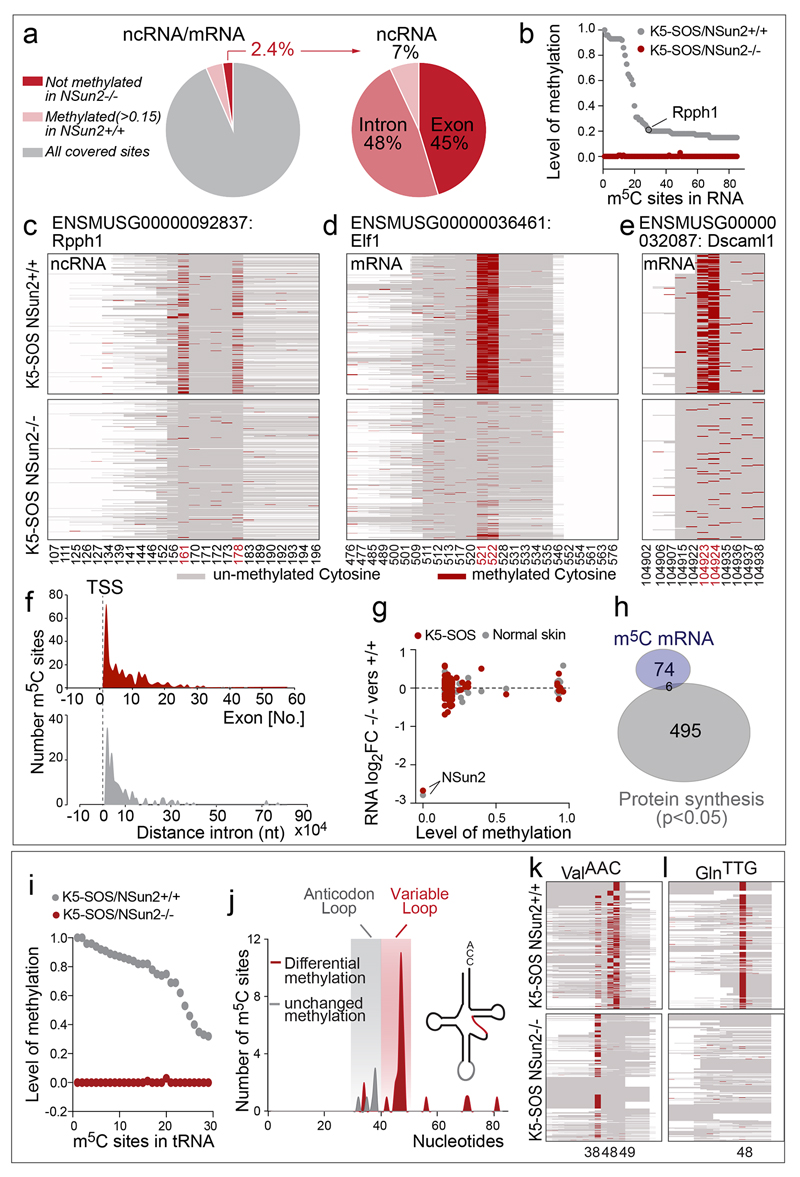
A likely mechanism for translational repression in NSun2-deficient tumours was that 5’ tRNA fragments inhibit protein synthesis4. Using RNA bisulphite-sequencing1,33, we confirmed that in tumours, NSun2-dependent methylation occurred at most tRNAs (65%), but only at a small proportion of mRNA exons (2%) and introns (Fig. 5a,b; Extended Data Fig. 7a-e; Supplementary Table 1,2)1,2,34–39. In the few mRNAs, NSun2-methylation sites were enriched close to transcriptional start sites, but uncorrelated with RNA abundances (Extended Data Fig. 7f,g; Supplementary Table 1,3). In contrast, hypo-methylation of tRNAs directly caused by loss of NSun2 lead to the accumulation of 5’ tRNA fragments (Fig. 5c,d; Extended Data Fig. 7i-l; Supplementary Table 2,4).
Figure 5. NSun2-deletion imposes distinct translational programmes.
a, b, Percentage of NSun2-methylated cytosines (dark red). c, Un-methylated tRNAs are cleaved and 5’tRNA fragments accumulate. d, Relative frequencies of tRNA fragments in tumours. e, No correlation between changes in protein synthesis and RNA expression in tumours. f, g, Significantly (p<0.05) changed 5’UTR ribosome densities in tumours (f) and human NSun2-/- lines (excluding significant (p<0.05) changes in NSun2+/-) (g) and corresponding CDS. ****p<0.0001 (two-tailed Student’s t-test). h, i, Frequency of ribosomal density values (p-value<0.05 and abs(log2FC)>0) (h) and Gene Ontology (GO) categories in tumours. j, GO categories of significant (p<0.05) changed 5’UTRs in NSun2-/- lines versus +/-. Data: average of 4 replicates per condition in human (g, j) and mouse (a-d) or 3 in (e,f,h,i).
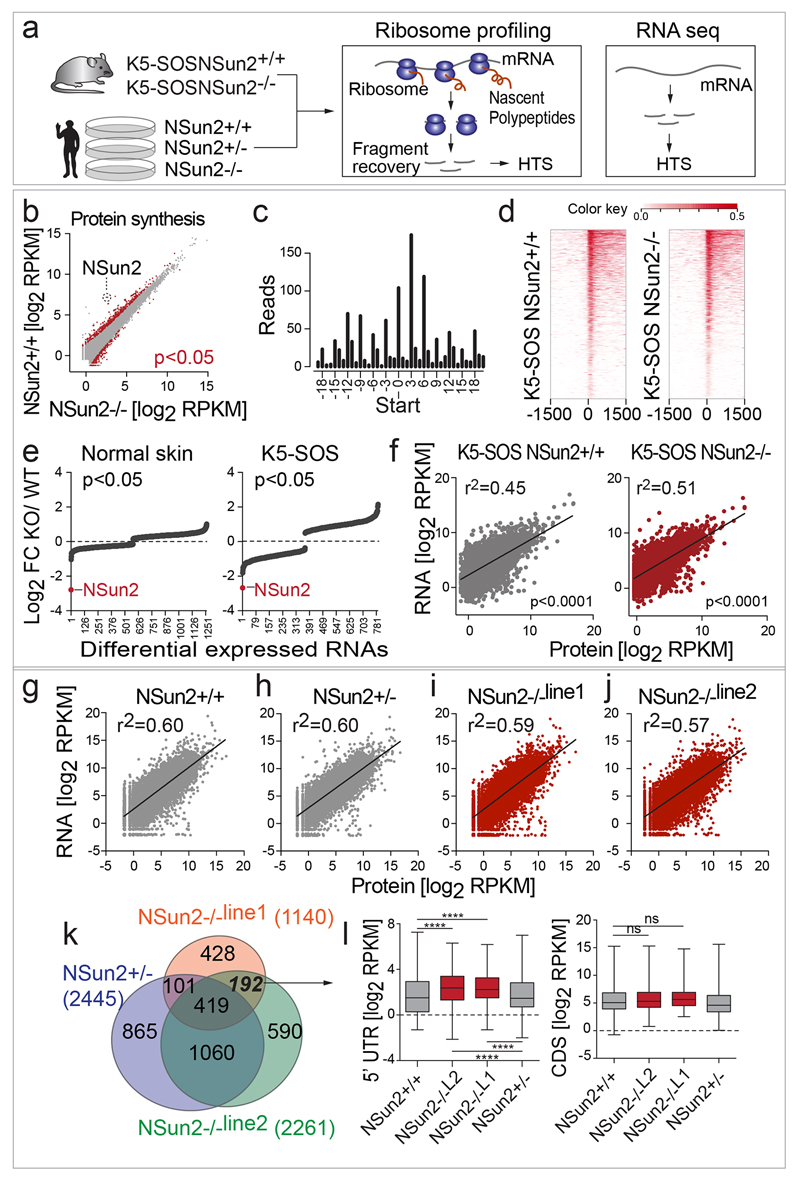
We performed ribosome profiling to evaluate how 5’ tRNA fragments influenced translation in mouse tumours and patient-derived NSun2-deficient fibroblasts (Extended Data Fig. 8a,b; Supplementary Tables 5,6a-c). We verified the high quality of our data by testing for triplet periodicity of ribosomal footprints40, increased ribosomal density near translation start sites41, and correlation between RNA expression levels and translation (Extended Data Fig. 8c-j)42.
The distinct translational programme in NSun2-/- tumours was not driven by transcription, because the changes in protein synthesis caused by NSun2-removal were decoupled from the corresponding changes in RNA expression levels (Fig. 5e; Extended Data Fig. 8e). These differences in translation were more likely to be caused by accumulated 5’ tRNA fragments than by changes in mRNA methylation, because translation of NSun2-methylated mRNAs remained unaltered (Extended Data Fig. 7h).
In sum, the undifferentiated cellular phenotype of NSun2-/- tumours was primarily driven by translational, and not transcriptional changes.
Changes in tRNA methylation impose a distinct translational signature
Accumulation of 5’ tRNA fragments can activate a cap-independent stress-response programme4; and stress stimuli can increase ribosomal density in 5’ untranslated regions (UTR)43,44. Consistent with such a stress response, 5’UTRs in NSun2-deficient cells showed increased ribosome densities (Fig. 5f,g; Extended Data Fig. 8k,l; Supplementary Table 7-9). The increased ribosome density in 5’UTRs is likely due to the occurrence of up-stream open reading frames (uORFs)41,45. Functionally, uORFs repress translation by sequestering initiation events or facilitate downstream re-initiation and translation45–48, which may explain why protein synthesis of corresponding coding sequences (CDS) remained unaltered (Fig. 5f,g).
Although the underlying mechanisms are unclear, differential ribosome density in 5’UTRs should alter protein production of distinct genes. Indeed, transcripts with increased ribosome density in 5’UTRs were linked to apoptosis, stress response, cell shape and migration (Fig. 5h-j). In tumours, transcripts with reduced ribosome density in the CDS were related to differentiation (Fig. 5h,i). Thus, the ribosome profiling data correlated well with the phenotypic reduction of epidermal differentiation of NSun2-deficient tumours; and the cell-intrinsic NSun2-controlled translational programme(s) related to stress responses and cell motility was conserved between species.
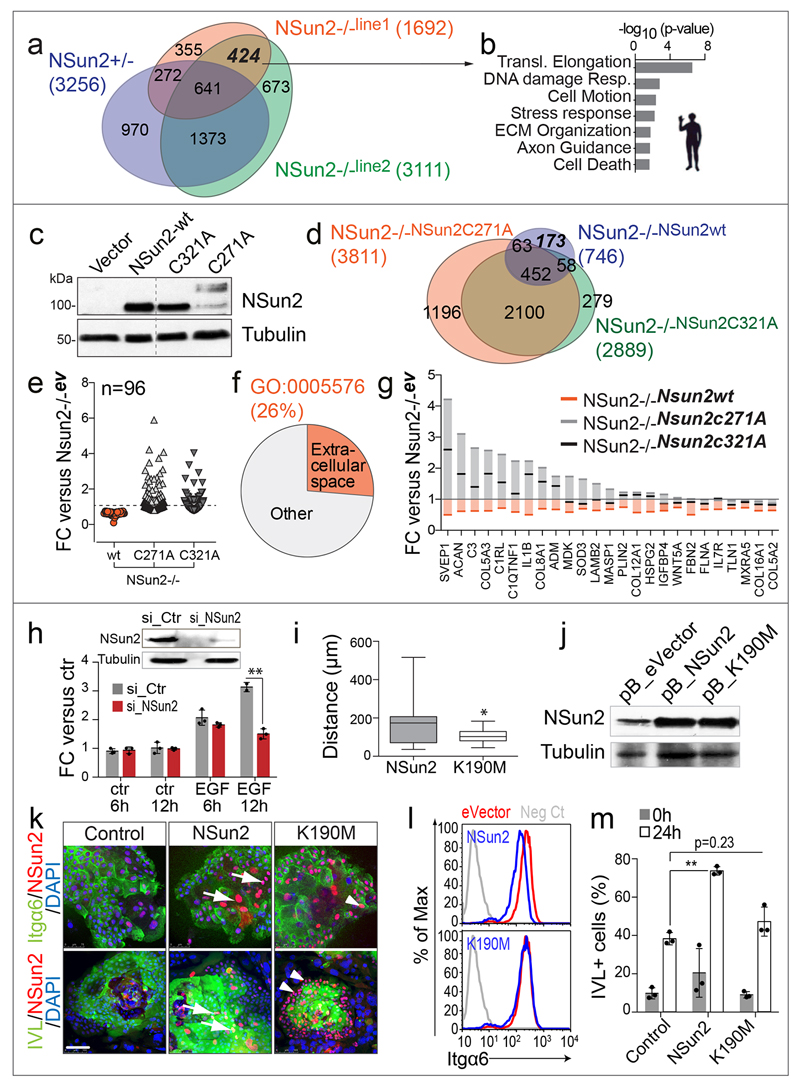
To identify the translational programme that directly depended on RNA methylation, we performed ribosomal profiling after rescuing NSun2-/- human fibroblasts with the wild-type or enzymatically dead constructs of NSun2 (Extended Data Fig. 9a-d). Modulators of cell adhesion and motility represented a quarter of translational repressed transcripts that depended on the enzymatic activity of NSun2 (Extended Data Fig. 9e-g; Supplementary Tables 10a-c). Consequently, motility and adhesion were down-regulated but differentiation up-regulated in primary human keratinocytes when NSun2 was repressed or enzymatic-dead versions over-expressed (Extended Data Fig. 9h-m).
Thus, the undifferentiated stem cell state in NSun2-deficient tumours was primarily driven by differential translation of proteins regulating cell migration, adhesion and stress responses (Extended Data Fig. 10a,b; Supplementary Fig. 1).
Low translating tumour-initiating cells are highly sensitive to anti-cancer drugs
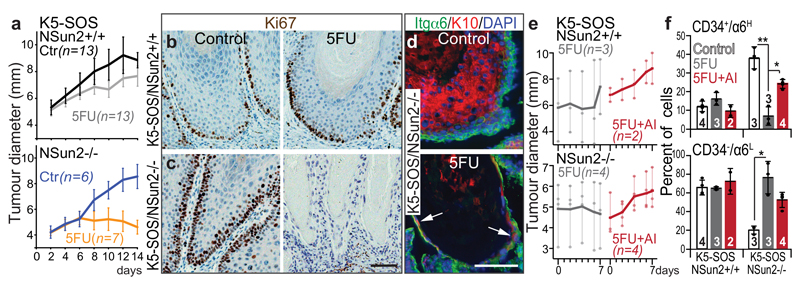
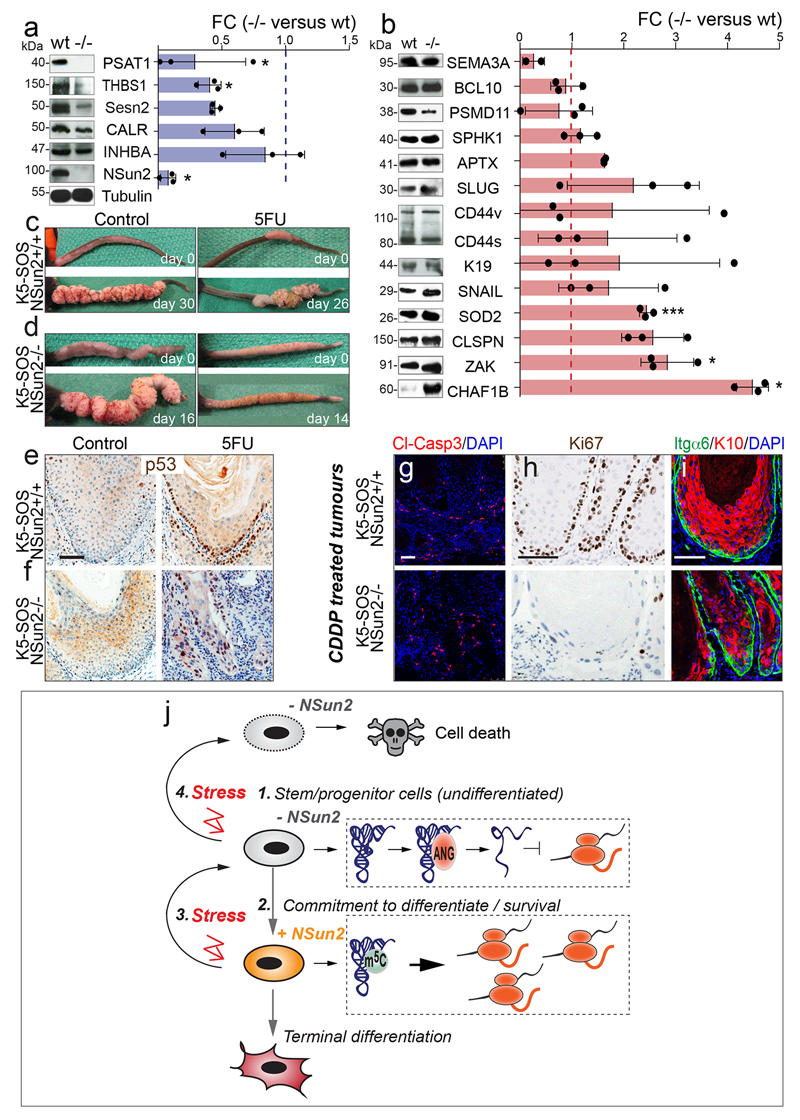
To test whether the stress-related programme in NSun2-/- tumours altered their sensitivity to external stress in vivo, we applied the cytotoxic agent 5-fluorouracil (5FU). 5FU is commonly used to treat squamous cell carcinomas49. While wild-type tumours only showed a mild reduction in growth, 5FU-treatment blocked progression of NSun2-/- tumours (Fig. 6a; Extended Data Fig. 10c,d). NSun2-/- tumour cells were unable to re-enter the cell cycle after drug treatment, despite induction of p53 being detectable in all samples (Fig. 6b,c; Extended Data Fig. 10e,f). We obtained similar results using cisplatin (Extended Data Fig. 10g-i). 5FU-treated NSun2-/- tumour cell layers were reduced, and the remaining basal cells (Itgα6) unusually labeled double-positive for the differentiation marker K10 (Fig. 6d; arrows). Thus, NSun2-deficient tumours fail to activate survival pathways in response to stress.
Figure 6. NSun2-deletion sensitizes tumour-initiating cells to cytotoxic stress.
a-c, Tumour size (mean ± s.e.m) (a) and Ki67 detection (b, c) in control (Ctr) or 5’FU-treated mice. d, K10 and Itgα6 detection in treated NSun2-/- tumours. Arrows: K10+/Itgα6+-positive cells. e, Tumour size in mice treated with 5’FU and/or angiogenin inhibitor (AI). f, Quantification of tumour-initiating cells in tumours shown in (e) (mean ± s.d.). *p < 0.05; **p< 0.01 (two-tailed Student’s t-test). n=mice. Scale bars: 100 μm. Source data: SI_Fig6.
Finally, we asked whether the increased sensitivity to 5FU depended on angiogenin-mediated cleavage of non-methylated tRNAs. We rescued tRNA cleavage by administering the angiogenin-inhibitor N65828 (AI)1,50. High toxicity of this drug combination only allowed treatment times up to 7 days. Nevertheless, NSun2-/- tumours failed to regress and survival of undifferentiated tumour-initiating cells (CD34+/α6H) significantly increased when exposed to both drugs (Fig. 6e,f), indicating that tRNA fragments reduce the survival of NSun2-/- tumour-initiating cells.
Thus, combining cytosine-5 RNA methylation inhibitors with conventional chemotherapeutic agents may provide an effective anti-cancer strategy for solid tumours (Extended Data Fig. 10j).
Discussion
Similar to the haematopoietic system19, epidermal stem cells produce less protein than their immediate progenitors, and forced entry into the cell cycle is not sufficient to reverse this translation repression. Instead, global protein synthesis in normal and tumour cells is determined by lineage commitment, but not by proliferation.
Here, we identify RNA methylation as an important pathway to modulate global protein synthesis and cell fate. Both protein synthesis and NSun2 expression are low in epidermal stem cells, but increase upon commitment to differentiate. NSun2-mediated methylation protects tRNA from cleavage into non-coding 5’ tRNA fragments, thereby promoting protein translation and differentiation1. External stress stimuli inhibit NSun2 activity1 permitting cleavage into 5’ tRNA fragments, which then decrease protein synthesis in human cells4. Inhibition of post-transcriptional methylation in squamous tumours promotes stem cell function and tumourigenesis. However, re-activation of cytosine-5 RNA methylation pathways is required to exit the specific translation inhibition programme after cytotoxic stress. Thus, activation of RNA methylation or inhibition of tRNA cleavage is essential for cell survival of tumour-initiating cells in response to cytotoxic stress (see Supplementary Discussion).
Material and Methods are submitted as supplementary file.
Methods
Transgenic mice
Rosa-CAG-LSL-tdTomato51, K19-CreER52 and Lgr5-CreERT253, NSun2-/- (or homozygous NSun2Gt(D014D11)Wrst)54, and K5-SOS-F (in wa2/wa2 background)55 mutant mice have been described previously. Balb/C athymic nude mice purchased from Charles River were used in transplantation experiments. All mice were housed in the Wellcome Trust - Medical Research Council Cambridge Stem Cell Institute Animal Unit. All mouse husbandry and experiments were carried out according to the local ethics committee under the terms of a UK Home Office license PPL80/2231 and PPL80/2619.
To conditionally induce tdTomato-reporter lines for expression of Cre-recombinase, Rosa-CAG-LSL-tdTomato mice were crossed with K19-CreER or Lgr5-CreERT2 mice. To activate CreER, only male mice were treated with two intra-peritoneal (IP) injections of 50 μl of a Tamoxifen (Sigma-Aldrich) solution (40mg/ml) in corn oil at post-natal day 15 and 17.
To measure protein synthesis in vivo, mice were intraperitoneally injected with O-Propargyl-puromycin (Op-puro) (Medchem Source LLP) at a concentration of 50 mg per kg of body weight dissolved in PBS at pH 6.4–6.6 one hour before sacrifice. Skin samples were collected at Catagen (postnatal day P17), telogen (P19), early anagen (P25) and late anagen (P30).
To induce squamous tumours in NSun2-/- background, we used K5-SOS transgenic mice. These mice express a dominant negative form of Son of Sevenless (SOS) under control of the keratin-5 (K5) promoter and develop spontaneous cutaneous tumour with 100% penetrance55. K5-SOS-Fxwa2/wa2 mice were crossed with NSun2+/- mice carrying a gene trap in the NSun2 allele (NSun2Gt(D014D11)Wrst). Spontaneous skin papillomas developed mainly in the tail of K5-SOS-Fxwa2/+ mice two weeks after birth but they did not develop into malignant squamous cell carcinomas55.
Histology, tissue and cell stainings, antibodies and imaging
Tissues or tumours were either embedded in OCT and frozen or fixed overnight with 4% paraformaldehyde, transferred to 70% EtOH and embedded in paraffin. Samples were then cut at 4 μm (paraffin) or 10 μm (frozen). Immunofluorescence staining, LacZ and Hematoxylin and Eosin staining of frozen or paraffin-embedded tissues or cells were performed as described previously54. For immunohistochemistry ImmPRESS™ reagents (Vector Labs) or IHC Detection Kit (Ventana Medical Systems) and DISCOVERY automated IHC staining system (Ventana Medical Systems) were used.
Primary antibodies were used at the following dilutions: rabbit polyclonal to RFP (for tdTomato) (1:1000; Rockland inc., 600-401-379), mouse monoclonal to Dlx3 (1:200, Abnova, H00001747-A01), rabbit polyclonal to K6 (1:200, Abcam, ab24646), mouse monoclonal to Gata3 (1:50, Santa Cruz Biotech, sc-268), guinea pig polyclonal to K31 and K72 (1:200, Progen, GP-hHa1 and GP-K6irs2), rabbit polyclonal anti c-maf (1:100, Bethyl, A300-613A), mouse monoclonal to Lef1 (1:50, Santa Cruz Biotech, sc-81470), goat polyclonal to P-cadherin (1:100, R&D systems, FAB761A), rabbit monoclonal antibody to Ki67 (1:200; SP6, Vector Labs, VP-RM04), mouse monoclonal anti-mouse Keratin 15 (1:100056), β-Catenin (1:200, Santa Cruz Biotech, sc-7199), rat monoclonal anti-Itgβ1 (1:200, clone HMβ1-1, BioLegend, 102203), rabbit polyclonal anti mouse keratin 10 (1:500; Covance, PRB-159P), rabbit polyclonal anti-NSun2 (1:500; Aviva Systems Biology, ARP48811_P050), rabbit polyclonal anti-human NSun2 (MetA, 1:50057), rat monoclonal anti-Itgα6 (1:500; GoH3, eBioscience, 14-0495), rat monoclonal anti-CD44 (1:200, IM7, BioLegend, 103004), anti-mouse Podoplanin (1:500, clone 8.1.1, eBioscience, 14-5381), rat monoclonal anti-BrdU (1:100; Abcam, ab6326), rabbit polyclonal anti-Laminin alpha 5 (1:100, Abcam, ab75344), mouse monoclonal anti-cytokeratin 8 (1:100, TROMA-I, DSHB, US), rabbit polyclonal to Slug (1:200, Cell Signaling, 9585P), chicken polyclonal anti-GFP (1:200, Abcam, ab13970), rabbit polyclonal anti-p53 (1:100, CM5, Novocastra, NCL-p53-CM5p), and rabbit anti human Involucrin (SY5 clone, 1:200, Abcam, ab80530). Alexa Fluor 555-, Alexa Fluor 647- and Alexa Fluor 488-conjugated secondary antibodies (Life Technologies) were added at a dilution of 1:1000 for 1 hour at room temperature. Apoptotic cells were visualized staining sections with DeadEnd™ Fluorometric TUNEL System (Promega) or immunostained for rabbit polyclonal anti-cleaved Caspase3 (1:200, Cell Signaling, 9664). Nuclei were labeled with DAPI (49,6-diamidino-2-phenylindole) or hematoxylin. Slides were mounted in glycerol supplemented with Mowiol ® 4-88 mounting medium (Sigma-Aldrich-Aldrich).
White field images were acquired using an Olympus IX80 microscope and a DP50 camera. Fluorescence images were acquired either on a Zeiss Axioplan microscope or using a confocal microscope (Leica TCS SP5) at 1024×1024 dpi resolution. All the images were further processed with Photoshop CS5 (Adobe) software.
Isolation of mouse keratinocytes from normal skin and skin tumours
To isolate keratinocytes from mouse back skin, shaved skin was floated on 0.25% Trypsin without EDTA (Life Technologies) for 2 hours at 37°C. Then the epidermis was scraped off the dermis, and cells were disaggregated by gentle mincing with a scalpel and pipetting. For back skin in late anagen the dermis was further minced and digested for 30 minutes at 37°C low-calcium medium containing 1.25 mg/ml of Collagenase Type I, 0.5 mg/ml of Collagenase Type II, 0.5 mg/ml of Collagenase Type IV (all from Worthington) and 0.1 mg/ml of Hyaluronidase (Sigma-Aldrich).
To disaggregate cells from squamous tumours, the tumours were minced with a scalpel and incubated for 1-2 hours at 37°C in low-calcium medium containing 1.25 mg/ml of Collagenase Type I, 0.5 mg/ml of Collagenase Type II, 0.5 mg/ml of Collagenase Type IV (all from Worthington) and 0.1 mg/ml of Hyaluronidase (Sigma-Aldrich). Then pieces were further incubated for another hour with Trypsin without EDTA (Life Technologies) and cells disaggregated by scraping with a scalpel blade. Trypsin was inactivated by washing the cell suspension with low-calcium media containing 10% of FBS (Life Technologies).
In vivo measurement of protein synthesis by flow cytometry and microscopy
Back skin or cutaneous tumours were collected and further processed for flow cytometry or histology analysis (described above). For flow cytometry analysis cells were dissociated as described above. For staining of dissociated cells or frozen sections, samples were first fixed with 1% paraformaldehyde in PBS for 15 min on ice. Next samples were washed in PBS, and then permeabilized in PBS supplemented with 3% fetal bovine serum (Sigma-Aldrich) and 0.1% saponin (Sigma-Aldrich) for 5 min at room temperature. To conjugate OP-puro to a fluorochrome, an azide-alkyne cycloaddition was performed using the Click-iT Cell Reaction Buffer Kit (Life Technologies) and 5 μM of Alexa Fluor 488 or Alexa Fluor 647 conjugated to azide (Life Technologies). After the 30-min reaction, the cells were washed twice in PBS with 3% fetal bovine serum and 0.1% saponin and then resuspended in PBS. When indicated cells were further stained for cell surface markers and DAPI as described in a section below.
To visualize protein synthesis together with antibody staining in skin or tumour paraffin embedded or frozen sections; frozen sections were first fixed with 1% paraformaldehyde in PBS for 15 and paraffin sections were first de-waxed and progressive rehydration sections were then blocked and stained with primary antibodies overnight at 4°C. The next day sections were washed and stained with secondary antibodies 1 hour at room temperature. After washes sections were stained using the Click-iT Cell Reaction Buffer Kit with Alexa Fluor-647 or 488 azide (Life technologies) as described above.
Quantification of protein synthesis rates
Protein synthesis rates in specific cell populations were calculated by normalizing the mean of OP-puro signal of each population of interest to the signal of the whole epidermal or tumour cell preparation, using the following formula:
The mean of OP-puro incorporation was averaged from several mice collected in multiple independent experiments. OP-puro fluorescence signal between experiments was calibrated by including in each run BD rainbow Calibration particles 8 peaks (BD Bioscience). Samples from PBS-injected mice were also stained for OP-puro and the fluorescence signal was used to determine the background signal.
Flow cytometry and cell cycle analysis
Flow cytometry was performed for cells dissociated from normal skin, skin tumours or cells growing in culture. Cell dissociation from skin or tumours was performed as described earlier. Cells in culture were trypsinized for 5 minutes before performing the staining. Analysis of specific epidermal or tumour populations, live cells, or fixed cells previously stained for OP-puro as indicated in a previous section, were incubated in 2% of BSA with combinations of antibodies to the following cell-surface markers: PE-Cy7-conjugated CD117 (1:100, clone 2B8, BD Bioscience, 558163), PE-Cy7-conjugated CD31 (1:50, PE-CAM1, eBioscience, 563651), PE-Cy7-conjugated CD45 (1:100, BD Pharmingen, 552848), PE- or eFluor 450- conjugated Itgα6 (1:500, clone GoH3, eBioscience, 12-0495 and 48-0495), eFluor 660- or FITC-conjugated CD34 (1:50, RAM34, eBioscience, 50-0341 and 11-0341), biotinylated CD44 (clone IM7, BioLegend, 103004) and PE-conjugated Pdpn (eBioscience, 12-5381-82). After incubation for 30 minutes at 4°C, cells were washed twice in PBS. Biotinylated antibodies were visualized by incubation with Alexa Fluor 488 conjugated streptavidin (Life Technologies) for 10 minutes. For cell cycle analysis cells were further stained with DAPI. tdTomato+ cells were detected using PE-Texas Red channel.
Cells were gated using forward versus side scatter to eliminate debris and aggregates. Surface markers CD117, CD31 and CD45 were used to gate out endothelial cells, melanocytes and blood cells when analyzing cell preparations from skin or tumours. Data acquisition was performed on a BD LSRFortessa™ analyzer (BD Biosciences). Data were analyzed by FlowJo software.
Measurement of tumour growth and tumour treatments
Both male and female mice were used in these experiments. To evaluate the effect of NSun2 deletion on the formation of skin tumours we measured the presence (number of tumours), the growth of the tumours, the percentage of mice with tumours as well the survival of the mice throughout the length of the experiment (approximately 6-8 weeks). To monitor tumour occurrence and growth mice were weighed, the number of all tumours formed all over the body were counted and the growth of each tumour monitored every other day from postnatal day 16 (earliest time at which K5-SOS-F mice start developing papillomas). Papillomas in the tail tended to fuse into one covering the whole tail, and therefore were counted as one tumor from the beginning of the experiments. Other tumors also developed in ears, mouth, back skin or feed. The growth of each tumour was monitored by measuring the diameter of the widest area of the tumour using a precision caliper allowing discriminating size modifications >0.1 mm. When animals have to be treated with drugs, experiments started also at the third week of age. The end point of the experiments was determined by health deterioration and casualties or by the length of the treatments when mice were under a treatment regime. K5-SOS-Fxwa2/+NSun2+/+ (referred as K5-SOS/NSun2+/+) survived longer than K5-SOS-Fxwa2/+xNSun2-/- (K5-SOS/NSun2-/-) and K5-SOS-Fxwa2/+xNSun2+/- (K5-SOS/NSun2+/-). All mouse tumour experiments were carried out according to the local ethics committee under the terms of a UK Home Office license PPL80/2231 and PPL80/2619. Following these regulations the mean diameter of a tumour should not normally exceed 1.4 cm (PPL80/2619, 19b 7). While K5-SOS/NSun2-/- and K5-SOS/NSun2+/- had to be sacrificed before mice reached two moths of age due to the size and aspect of the tumours and weight loss or general health deterioration due to excessive tumor burden, K5-SOS/NSun2+/+ only reached the deterioration state later than two months of age. For the analysis in Figure 4a we measured the percentage of mice with tumours for each indicated day. The average number of tumours in each mouse genotype is shown in Extended Data Figure 5c. Note that data points are shorter for K5-SOS/NSun2-/- and K5-SOS/NSun2+/- as mice survival was shorter. The diameter of the tumours was normalized to the size of each mouse (body weight: BW) in Extended Data Figure 5b to eliminate genotype variance because K5-SOS/NSun2-/- mice are significantly smaller than K5-SOS/NSun2+/+.
Cutaneous tumours in transgenic K5-SOS/NSun2+/+ and K5-SOS/NSun2-/- mice were topically treated with 5-Fluorouracil (5FU) (Efudix 5% Fluorouracil Cream, Meda Pharmaceuticals) every second day for two weeks. 5FU inhibits thymidylate synthases leading to the up-regulation of p53 and cell death58. Tumours were also treated with 5FU in combination with an Angiogenin inhibitor (referred as A.I.) (N65828, NCI, US)59,60 administered by intraperitoneal injections at 2 mg/kg in PBS pH 7.4 every alternative day to 5FU treatment. Due to the high toxicity of the drug combination, we were only able to simultaneously treat with 5FU and AI for a short period of time (up to 7 days). Cisplatin (CDDP) (Sigma) was dissolved in PBS and injected intraperitoneally at 14 mg/kg every other day. All treatments started the first cutaneous lesions appeared and the end point was indicated by the length of the treatment, after which all mice were sacrificed. Control mice were administered PBS.
BrdU and EdU labeling
To measure proliferation, K5-SOS mice were injected intraperitoneally with 50 mg of 5-bromo-2′deoxyuridine (BdrU) per kg of body weight, 23 hours later with 20 mg/kg of 5-ethynyl-2′deoxyuridine (EdU). One hour later mice were sacrificed and tumor samples were processed for histology as described previously. BrdU was visualized as described in54. EdU was stained with Click-iT® EdU Alexa Fluor® 488 Imaging Kit (Life Technologies). Images of random areas of the slide were collected using a confocal microscope (Leica SP5). Numbers of BrdU- and EdU-positive cells were quantified using Volocity software (PerkinElmer).
Tumour graft assay
Epidermal keratinocytes from K5-SOS/NSun2+/+ and K5-SOS/NSun2-/- cutaneous tumors were isolated as described in previous sections. GFP expressing dermal fibroblasts were isolated from healthy skin of newborn APC-eGFP mice. For this, skin was first incubated in a 1:1 solution of 5% dispase (BD Biosciences) at 37ºC for 1 hour. The epidermis was then peeled from the dermis. The dermis was incubated with of 0.2% collagenase in low-calcium medium for 30 minutes at 37°C to yield a single-cell suspension. The dermis suspension was filtered through a 70 μm cell strainer. 1x10⁶ of viable epidermal keratinocytes from K5-SOS/NSun2+/+ or K5-SOS/NSun2-/- tumours were injected subcutaneously in athymic nude mice. To allow successful engrafting, the tumour cells were injected with 1x10⁶ of viable GFP dermal fibroblasts. The GFP-expressing dermal fibroblasts integrated into the dermis but failed to contribute to tumour formation (Extended Data Fig. 6c). Experiments were done in triplicates. Nude mice were sacrificed one month after transplantation and tumor size was measured with a caliper.
RNA extraction and quantitative RT-PCR (qPCR)
Total RNA from mouse skin tumors was prepared using Trizol reagent (Life Technologies) and double-stranded cDNA was generated with Superscript III First-Strand Synthesis kit (Life Technologies). Real-time PCR amplification and analysis was conducted in StepOneTM Real-Time PCR Systems (Applied Biosystems) using pre-designed probe sets and TaqMan Fast Universal PCR Master Mix (2×) (Applied Biosystems). The following probes were used to amplify selected genes NSun2 (Mm00520224_m1), α6 integrin (Mm01333831_m1), CD34 (Mm00519283_m1), Keratin 10 (Mm03009921_m1) and Involucrin (Mm00515219_s1). GAPDH expression (4352932E) was used to normalize samples using the ΔCt method.
Mouse SCC and TMA staining and quantification
Mouse squamous cell carcinomas (SCC) were obtained from a TPA/DMBA chemical induction treatment for 20 weeks and frozen tissues were kindly provided by Dr. C. Blanpain (Université Libre de Bruxelles, IRIBHM, Brussels B-1070, Belgium.). Frozen sections were stained as described in the previous sections.
Tissue microarrays (TMA) for human skin tumours of increased malignancy according to TNM (Tumour, Node, Metastases) classification were purchased from Abcam (ab178287 and ab178288). Immunohistochemistry was performed using IHC Detection Kit (Ventana Medical Systems) and DISCOVERY automated IHC staining system (Ventana Medical Systems) with a polyclonal antibody for human NSun2 (MetA, 1:100057). Images of each tumour section were acquired with a Zeiss Axioplan microscope and NSun2 expression levels were quantified for each individual cell in each tissue (quantified as average between all cells in all sections) using CellProfiler image software.
Cell culture, viral infections and siRNA knockdown
Four lines of human dermal fibroblasts were used. Two independent cell lines of NSun2-/- human dermal fibroblasts were derived from two patients and referred as NSun2-/- line 1 and line 2 in this study, and one line of NSun2+/- fibroblasts was derived from the mother of the patients described in61; these three lines were kindly provided by Dr. J. Gleeson (Laboratory of Pediatric Brain Diseases, Howard Hughes Medical Institute, The Rockefeller University, New York, NY, USA). NSun2+/+ human dermal fibroblasts were purchased from Life Technologies (C-013-5C) and were derived from an age- and gender-matching individual compared to NSun2+/- fibroblasts. Human fibroblasts were grown in MEM (Invitrogen) supplemented with 20% fetal bovine serum (FBS) as described previously61. ZHC Human epidermal keratinocytes (Cellworks distributed, ZHC-1116) were grown in KBM-Gold medium (Lonza). All cells were kept in a humidified atmosphere at 37°C and 5% CO2.
To rescue expression of NSun2 or express NSun2 catalytically dead mutants in Nsun2-/- fibroblasts or ZHC keratinocytes, full length human NSun2 (pB-NSun2), inactive mutants C271A (pB-NSun2-C271A), K190M (pB-NSun2-K190M) or C321A (pB-NSun2-C321A) or the empty vector (pB-empty) were infected via retrovirus as described previously62. To knock-down NSun2 expression in human keratinocytes, cells were transfected with control siRNA (AllStars negative control siRNA (QIAGEN, 1027292) or Human NSun2 siRNA (Flexitube siRNA QIAGEN, SI02655548) using Lipofectamine RNAiMax transfection reagent (Life Technologies) according to the manufacturer’s instructions.
Migration assays
For migration analysis in Boyden chambers, human primary keratinocytes were transfected with siRNAs as described earlier. Transfections were carried twice every 48 hours and migration assay was performed 24 hours after the second transfection. Cells were treated with mitomycin C for two hours to arrest cell cycle progression. After mitomycin C treatment cells were trypsinized and counted and seeded on Boyden chambers (transwell inserts of 8μm, 24-well plates, BD Biosciences). 8x10⁴ cells were seeded with KBM growing medium (Lonza) without hrEGF. Media containing 10 ng/ml of hrEGF (Lonza) was placed under the transwell inserts as chemoattractant to attract cells. Media without chemoattractant was placed under the transwell inserts in control experiments. Cells were allowed to migrate for 6 or 12 hours, after which the inserts were washed once with PBS, fixed with 4% PFA for 10 min, and cells were stained with DAPI. Cells from the upper side of the membrane were scratched off with a cotton bud and wash off with PBS several times. Cells on the bottom side of the membrane were imaged with a colony scan microscope. Cells were then quantified with the software CellProfiler.
For motility analysis of human keratinocytes, 104 cells were seeded in 24-well ImageLock plates (Essen Instruments) in growing medium and kept for 26 hours at 37°C in 5% CO2. Cell mobility was recorded with an automated IncuCyte microscope (Essen Instruments). Images were collected at 15 minutes intervals. 2D-cell migration was analyzed by using the MTracking function of ImageJ software. 2D-migration tracks were generated by manually tracing the nucleus of each cell. Migrated distance was obtained by measuring the linear distance travelled between the first and last position (after 26 hours) of each tracked cell.
tRNA sequencing library preparation
Small RNA libraries were generated from snap-frozen skin papillomas from 4-weeks old mice. Four independent biological replicates were used. For tRNA library generation we followed the protocols as in59. Briefly total RNA was extracted using Trizol reagents (Invitrogen) and treated with DNase (Turbo DNase, Ambion). Ribosomal RNA was removed with Ribo-zero (Epicentre, Illumina). The remaining RNA fraction was size-selected using MirVana Isolation Kit (Invitrogen). Using MirVana RNA purification columns with two sequential filtration steps with different ethanol concentrations, an RNA fraction highly enriched in RNA species ≤ 200 nt was obtained. The small RNA fraction (approximately 200 ng) was first treated with 0.1 M Tris-HCl pH 9.0 and 1 mM EDTA for 30 min at 37°C to de-aminoacylate mature tRNAs and later T4-PNK (NEB) treated to ensure phosphorylated 5’ ends and 3’OH ends to proceed with RNA adapter ligation and library preparation. tRNA libraries were generated using TruSeq Small RNA Preparation Kit (Illumina). Briefly, 3’adenylated and 5’phosphorylated adapters suitable for Illumina RNA sequencing were ligated to the small RNA fraction. RNA was reverse-transcribed at 50ºC for 1 hour (SuperScript III cDNA synthesis kit, Invitrogen), followed by PCR amplification with Phusion DNA polymerase (Thermo scientific). All samples were multiplexed and sequenced in HiSeq platform (Illumina).
Bisulphite sequencing library preparation
To generate bisulphite sequencing libraries RNA was prepared and bisulphite-treated as in63. Briefly RNA was extracted with Trizol reagents (Invitrogen) from snap-frozen skin tumours from 4-weeks old mice. Four independent biological replicates were used. Total RNA was extracted and DNase treated (Turbo DNase, Ambion). Samples were Ribo-zero treated (Epicentre, Illumina) to deplete them from rRNA. At least 1.5 μg of the remaining RNA fraction was bisulphite-converted as follows: RNA was mixed in 70 μl of 40% sodium bisulfite pH 5.0 and DNA protection buffer (EpiTect Bisulfite Kit, Qiagen). The reaction mixture was incubated for three to four cycles of 5 min at 70ºC followed by 1 hour at 60ºC and then desalted with Micro Bio-spin 6 chromatography columns (Bio-Rad). RNA was desulfonated by adding an equal volume of 1 M Tris (pH 9.0) to the reaction mixture and incubated for 1 h at 37°C, followed by ethanol precipitation. 2’,3’-cyclic phosphate and 5’-hydroxyl termini produced during the bisulphite/desulfonation reaction were end-repaired with T4 PNK (New England Biolabs). About 120 ng of bisulphite-converted RNA was used to generate Bisulphite-seq (BS-Seq) libraries. Because bisulphite treatment and desulfonation cleaves long RNAs into fragments of about 100 nt, we then used TruSeq Small RNA preparation kit (Illumina) to generate libraries suitable for Illumina sequencing as described in59. Briefly, RNA adapters suitable for Illumina sequencing were ligated to bisulphite-converted RNAs, reverse-transcribed at 50ºC for 1 hour with SuperScript III and 2 mM of each dNTP (SuperScript III cDNA synthesis kit, Invitrogen) followed by PCR amplification. All samples were multiplexed and sequenced on a HiSeq platform (Illumina).
Preparation of Ribo-seq libraries
Two types of experiments were performed on mouse skin tumours (from K5-SOS mice) and human dermal fibroblasts samples from each set of conditions: ribosomal profiling (Ribo-seq) and mRNA-seq. All samples were sequenced using the HiSeq platform (Illumina). A minimum of three replicates was performed for each sample. Dermal fibroblasts were grown and infected when indicated as described in previous sections and with the constructs indicated in each experiment. For cells or tissue collection, none were pre-treated with cycloheximide, however cycloheximide was present in the following steps. Cells were washed with PBS (without cycloheximide) twice and lysis buffer (20 mM Tris-Cl (pH 7.4), 150 mM NaCl, 5 mM MgCl2, 1 mM DTT (Sigma), 1% Triton X-100 (Sigma), 25 Units/ml of Turbo DNase I (Life Technologies) containing 100 μg/ml of cycloheximide (Sigma) was added straight to the cells. Papillomas were dissected from the mice, snap-frozen in liquid nitrogen and later homogenized in lysis buffer containing 100 μg/ml of cycloheximide. Cycloheximide was added to the lysis buffer to arrest translation elongation while the polysome fraction was being purified and mRNA fragments were recovered. We then proceeded with ribosome footprint purification without snap freezing the lysates as indicated in64. All the steps for cell or tissue lysis, nuclease footprinting, polysome fractionation, mRNA footprint purification and gel size-selection were performed as indicated in64. Briefly lysates were further triturated by passing them ten times through a 26-G needle. Nuclei and debris were removed by centrifugation at 13000 rpm for 10 min. Supernatant was digested with RNaseI (100U/μl, Ambion) for 45 min at room temperature. Digestion was blocked with SuperaseIN (Ambion) and lysate was layered on a 1M sucrose cushion and separated by ultracentrifugation at 45000 rpm in a 70Ti rotor for 9 h at 4°C. Pellets were resuspended in Qiazol and RNA fragments lower than 200 nt were extracted using miRNeasy kit (Qiagen) followed by ethanol precipitation. Size selection of footprints with length of 26–34 nt was performed on 15% TBE-urea gel (Invitrogen). Footprints were 3’-dephosphorylated with T4 polynucleotide kinase (10U, NEB). From this step and to prepare libraries suitable for Illumina sequencing we slightly modified the original protocol64. mRNA footprints were then treated with Ribo-zero (Epicentre Illumina) to deplete rRNA. By using this extra step of rRNA depletion (together with the use of DNA oligos to deplete rDNA by subtractive hybridization in a later step) we were able to reduce rRNA contamination to only ~60% of all reads. mRNA footprints recovered from Ribo-zero were then prepared for Ribo-seq using TruSeq Small RNA Preparation Kit (Illumina). Briefly, 3’adenylated and 5’phosphorylated adapters suitable for Illumina RNA sequencing were ligated to the recovered mRNA fragments. RNA was reverse-transcribed at 50ºC for 1 hour (SuperScript III cDNA synthesis kit, Invitrogen), followed by rDNA depletion by subtractive hybridization (as indicated in the original protocol) using oligos listed in64 and following the protocol recommendations. Recovered cDNAs were PCR-amplified with no more than 12 PCR cycles. All samples were multiplexed and sequenced in HiSeq platform (Illumina).
Preparation of mRNA-seq libraries
mRNA-seq libraries were generated from mouse skin tumours from 4-weeks old K5-SOS/NSun2+/+ and K5-SOS/NSun2-/- mice, from mouse healthy back skin from 3.5-4-weeks old NSun2+/+ or NSun2-/- mice (without tumours) and from human dermal fibroblasts (Nsun2+/+, NSun2+/- and NSun2-/-) growing in culture and infected when indicated. At least four replicates were performed for each sample. All samples were multiplexed and sequenced using the HiSeq platform (Illumina). Total RNA was extracted using Trizol (Invitrogen) from cells in culture or snap-frozen tissues. Total RNA was DNase (Turbo DNase, Ambion) and Ribo-zero (Epicentre, Illumina) treated. rRNA-depleted RNA was used to generate mRNA-seq libraries using NEXTflex Directional RNA-seq Kit V2 (Illumina). All samples were multiplexed and sequenced in HiSeq platform (Illumina).
Next-generation sequence data analyses
For all data analyses, FastQC was used for the initial assessment of the quality and basic processing of the reads (http://www.bioinformatics.babraham.ac.uk/projects/fastqc). Sequencing adapters were trimmed from the 5’ and the 3’ ends of the reads using cutadapt (v1.4.2; https://pypi.python.org/pypi/cutadapt/1.4.2).
RNA bisulphite(BS)-seq analysis
To determine RNA methylation levels in mouse K5-SOS tumours, two complementary protocols for the analysis of BS-seq data were used:
-
(1)
Alignment to the genome. BS-seq reads were aligned to mouse reference genome (GRCm38/mm10) with Bismark (http://www.bioinformatics.babraham.ac.uk/projects/bismark; version 0.13.1; options: ‘--directional –n 0 –l 40’). Methylation levels for all cytosines with at least coverage of ≥ 5 reads (5X coverage) in both K5-SOS/NSun2+/+ and K5-SOS/NSun2-/- tumour samples were inferred with Bismark ‘methylation_extractor’. Cytosine positions displaying a difference in RNA methylation of at least 10% between K5-SOS/NSun2+/+ and K5-SOS/NSun2-/- tumour samples were extracted based on the ENSEMBL (GRCm38, Release 74; www.ensembl.org/info/data/ftp) transcript annotations and tRNA gene predictions in the mouse (GRCm38/mm10) reference genome obtained from GtRNAdb (http://lowelab.ucsc.edu/GtRNAdb).
-
(2)
Alignment to representative transcripts. Sequences for ENSEMBL transcripts and tRNAs were extracted in FASTA format. All transcript isoforms were considered, and in addition the longest gene at full length including introns was retained as a representative sequence to identify RNA methylation sites in introns. C’s were converted to T’s in the reference transcript sequences, and in the processed BS-seq reads. Alignment of converted BS-seq reads against converted transcript sequences were performed using bowtie (version 1.1.1; bowtie-bio.sourceforge.net; options ‘–m 500 –v 2 –a –best –strata’). Following alignments, the reads that aligned in sense direction were obtained, and the original transcript sequences and reads were used to compile RNA methylation (C/(C+T) levels considering only cytosines with at least 5X coverage. Heatmaps displaying either C or T in the aligned reads at each cytosine position were generated using custom PERL scripts and matrix2png (www.chibi.ubc.ca/matrix2png/) for visualization. Cytosine positions on the heatmaps were reported relative to the annotated transcriptional start sites of the transcripts.
tRNA-seq data analysis
The abundance of tRNA fragments was determined according to a previously published protocol described in59. Adapter-trimmed tRNA-seq reads (> 20 nt and < 200 nt in length) were mapped to the mouse reference genome (GRCm38/mm10) using bowtie (version 1.1.1; bowtie-bio.sourceforge.net; options ‘-m1 –v2 –a –best --strata’) considering only reads that map uniquely to the genome. To account for the polymerization of CCA-3’-ends onto mature tRNAs, the remaining unmapped reads were trimmed of CCA[CCA] ends and realigned using the same options. Annotations were conducted based on tRNA genes predicted for the mouse reference genome (GRCm38/mm10) and downloaded from GtRNAdb (http://lowelab.ucsc.edu/GtRNAdb). Reads that exceeded the annotated tRNA gene start or end by more than 10% were discarded. All distinct reads, which were shorter than 90% of the annotated tRNA gene length, were considered as tRNA fragments. Counts per fragments were normalized, and the differential abundances of fragments processed from the 5’ or 3’ halves of the tRNAs were statistically evaluated using the R/Bioconductor DESeq package (http://bioconductor.org/packages/release/bioc/html/DESeq.html). tRNA fragment abundances are given by log2(DESeq-normalized counts).
mRNA-seq and Ribo-seq data analyses
Ribosome profiling data was processed following established protocols65: The first 5' base of the adapter-trimmed Ribo-seq reads was removed, as this is usually an artefact of reverse transcription64. For removing abundant contamination from digested rRNA present in the libraries, the reads were aligned to a collection of rRNA sequences obtained from Genbank and UCSC using bowtie (options: ‘-n 2 --seedlen=23’). Reads aligning to rRNA were discarded, with the average rRNA contamination per sample being around 60%. Only reads with at least 24 nt and less than 30 nt length were retained in accordance with the observed length distribution of ribosome footprints66.
Both the Ribo-seq and mRNA-seq reads were aligned to the human (GRCh37/hg19) and to the mouse (GRCm38/mm10) reference genomes using Tophat2 (version: 2.1; options: ‘--read-mismatch 1(2) --max-multihits 1 –GTF’) guided by ENSEMBL gene models (release 76), allowing for two mismatches per read for human and one mismatch per read for mouse, and unique alignments only.
To determine mRNA abundance, mRNA-seq read counts for the full transcript were calculated using htseq-count (http://www-huber.embl.de/HTSeq/doc/overview.html), data sets were normalized, and the statistical significance of differential expression was evaluated by using the R/Bioconductor DESeq2 package (https://bioconductor.org/packages/release/bioc/html/DESeq2.html).
To evaluate differences in translation, the following additional Ribo-seq data analyses and normalizations were performed:
-
(1)
Alignment to representative regions. Coding sequences (CDS) and 5’UTRs were downloaded from ENSEMBL including ‘protein_coding’ and ‘nonsense-mediated decay’ types of transcripts. Intron sequences were excluded. Ribo-seq reads, which uniquely aligned to the genome in the initial alignment step using Tophat2, were aligned to 5’UTR or CDS sequences using bowtie (options: ‘-m 1000 –v1’) allowing for multiple mappings to overlapping regions of the same gene.
-
(2)
Statistical analysis of differential ribosome footprint densities and normalization. In concordance with other studies performed in yeast or mammalian cells67,68, we observed a characteristic 5’ ‘ramp’ of ribosome footprints at the translation start site of the CDS for our samples. It has been suggested that these excess footprints are a result of cycloheximide-inflicted accumulation of ribosomes64. To prevent any artifactual bias in our analysis, we followed the instructions for normalization in69. Read counts were extracted that aligned either to (1) all full-length CDS (see Supplementary tables 6-10) or to (2) all CDS sequences without the initial 150 nt (50 codons) corresponding to the ribosomal ramp (see Supplementary table 5 and Fig. 5e). For both data sets, statistical tests were performed with the R/Bioconductor DESeq package. The two sets of DESeq scaling factors were subsequently used for normalization of data sets. The DESeq-normalized counts for all regions were divided by their length in kB to define ribosome footprint densities.
-
(3)
Analysis of ribosome footprint densities at 5’UTRs. Reads that mapped uniquely to the genome by using Tophat2, were mapped to the 5’UTR sequences with bowtie (options: ‘-m 1000 –v1’). Differences in ribosome footprint densities on the full 5’UTRs were evaluated by using the DESeq scaling factors obtained from the analysis of CDS (Supplementary tables 7-9) for normalization, and DESeq to perform statistical tests for differences. DESeq-normalized counts for 5’UTR were divided by their length in kB to define ribosome footprint densities.
-
(4)
Analysis of triplet periodicity. Footprints of length 28 nt were extracted, since they report with high precision on the position of the ribosome66. The frequencies of the 5’-starts of the footprints, which were aligned close to the annotated translation initiation sites, were aggregated for all genes.
-
(5)
Heat map analysis. For the heat map analysis in (Extended Data Fig. 8d) we specifically selected the 43,625 representative and well-annotated protein-coding transcripts from GENECODE that overlap ENSEMBL transcript structures (“ensembl_havana”). The positions of the start codons were obtained from the ENSEMBL “Gene sets” gtf file (http://www.ensembl.org/info/data/ftp/index.html). Heat maps of ribosome footprint densities (RPKMs) were generated for regions +/- 1500 nt around the start codon by using ngsplot (https://github.com/shenlab-sinai/ngsplot).
If not indicated otherwise Gene ontology categories represent GOTERM_BP_FAT in DAVID (david.ncifcrf.gov).
Protein extraction and western blot analysis
To extract proteins from squamous tumours, samples were snap-frozen in liquid nitrogen, transferred to lysis buffer (1% NP-40, 200 mM NaCl, 25 mM Tris-HCl, pH 8, 1 mM DTT) including protease inhibitor cocktail (Roche) and homogenized and cleared by centrifugation at 13,000 rpm. To extract proteins from cells in culture, the same lysis buffer was added to the plate and scratched the cells from the plate surface, left lysing for 20 min in ice and cleared by centrifugation. Total protein quantification was performed using BCA Protein Assay (Thermo fisher). Equal amounts of protein were run in polyacrylamide gels. Western blotting was performed as described in54. The following primary antibodies were used for western blot analyses: anti-PSAT (Protein Tech Group, 10501-1-AP), anti-THBS1 (Santa Cruz, sc-65612), anti-Sesn2 (Protein Tech Group, 10795-1-AP), anti-Calreticulin (Abcam, ab2907), anti-INHBA (Sigma-Aldrich, SAB1408593), anti-NSun2 (Aviva Systems Biology, ARP48811_P050), anti-Keratin 19 (Abcam, ab52625), anti-CD44 (IM7, Biolegend, 103004), anti-Bcl10 (H197, Santa Cruz, sc-5611), anti-Semaphorin3A (SEMA3A) (Abcam, ab23393), anti-PSMD11 (Abcam, ab66346), anti-SPHK1 (Cell Signaling, 3297), anti-APTX (Abcam, ab31841), anti-Slug (Cell Signaling, 9585P), anti-Snail (Abcam, ab180714), anti-SOD2 (Abcam, ab13534), anti-CLSPN (Bethyl Laboratories, A300-266A), anti-ZAK (Sigma, HPA017205), anti-CHAF1B or CAF1 p60 (Abcam, ab180371). Polyclonal α-Tubulin (Abcam, ab15246) was used as a loading control. Band intensity was quantified with Image J software.
Statistical methods
Group data are always represented by mean and standard deviation, unless otherwise indicated in figure legends. To test statistical significance between samples unpaired two-tailed Student’s t-tests were used. To test for significance of populations (i.e. stem cells versus differentiated cell populations) within one sample (mouse) we used the paired Student’s test. To analyze the differences among group means we used ANOVA. Violin plots were created using the vioplot package (https://cran.r-project.org/package=vioplot) in R. The outline of the violin plots represents the kernel probability density of the data at different values. Violin plots include a marker for the median of the data and a box indicating the interquartile range70. Boxplots were created with Prism 6 software. The box extends from the 25th to 75th percentiles and the line in the middle of the box is plotted at the median. The whiskers show minimum to maximum. Scatter plots, linear regression lines and coefficient of correlation (r2) were calculated using Prism 6 software by computing non-parametric Spearman correlation and two-tailed P values.
Sample sizing and collection
At least three samples were used per experimental group and condition. The number of samples used in each experiment is indicated in all main figures, in legends of Extended Data figures and in Source Data files.
Samples and experimental animals were randomly assigned to experimental groups. Sample collection was also assigned randomly. Experimental procedures in vitro, sample collection and data analysis were performed blindly whenever possible. Whenever possible automated quantifications were performed using the appropriate software. Most animal procedures (i.e. mouse treatments) were performed blindly by individuals unaware of the experimental design.
Extended Data
Extended data Figure 1. Protein synthesis in epidermal populations.
a, Hair cycle stages and genetic lineage marking using K19- and Lgr5 tdTomato (tdTom) mice. Cell surface markers to isolated bulge stem cells are CD34 and Itgα6. Telogen: stem cells (CD34+/Itgα6+) are quiescent and resting in the bulge (BG). Early anagen: stem cells divide and give rise to committed progenitors in the hair germ (HG), which then grow downwards into the bulb (BU) surrounding the dermal papilla (DP). Late anagen: cells differentiate upwards to form the hair. Catagen: intermediate phase, when the hair bulb degenerates into a new resting bulge. IFE: interfollicular epidermis; SG: sebaceous glands. Mouse transgenes label K19 (red)- and Lgr5 (orange)-positive stem cells and their progeny. b, OP-puro detection in mouse epidermis at all hair cycle stages. Dotted lines: hair follicle and epidermal basal layer. Arrows: OP-purohigh cells in the hair follicle. Arrowheads: OP-purolow cells in the interfollicular epidermis. Nuclei (DAPI). c, tdTomato and OP-puro detection in back skin of K19tdTom and Lgr5tdTom mice in telogen and late anagen. Arrows: Tomato+ cells. Arrowheads: Tomato+/OP-purohigh cells. Dotted line: lower bulge. Merged panels in Figure 1c-f. e, Hair follicle lineages and differentiation markers used in Figure 1g-j. ORS: outer root sheet; Cp: Companion layer; IRS: inner root sheet; He: Henle’s layer; Hu: Huxley layer; Ci: cuticle of inner root sheet; Ch: cuticle; Co: cortex; Me: Medulla. f, P-cadherin and OP-puro detection in a late anagen. Scale bars: 50 μm.
Extended data Figure 2. Quantification of protein synthesis in epidermal populations.
a, b, Top 2.5%, 10%, 25%, and 50% translating epidermal cells (OP-purohigh) (a) were sorted for CD34 and Itgα6 (b). c, Protein synthesis in CD34+/α6+, CD34-/α6+ and CD34-/α6- epidermal populations in the top 2.5%, 10%, 25%, 50% or 100% (all) translating cells at indicated hair follicle stages. d, Percentage of CD34+/α6+, CD34-/α6+ and CD34-/α6- cells in the top 2.5%, 10%, 25%, 50% or 100% (all) of translating epidermal cells at indicated stages of the hair cycle. Bars: mean ± s.d. e, f, Violin plots of protein synthesis in top 2.5% OP-purohigh cells in tdTomato-negative (tdTom-) epidermal cells sorted for CD34 and Itgα6 from K19- (e) or Lgr5-tdTom mice (f) at all stages of the hair cycle. (n=mice). Source data: SI_EDF2.
Extended data Figure 3. Protein synthesis and cell cycle analyses in epidermal cells.
a-c, Violin plots of protein synthesis in indicated epidermal populations sorted for K19- (a) and Lgr5-tdTomato-positive (tdTom+) (b) and –negative (c) populations. Protein synthesis is shown for top 10%, 25%, or 50% OP-purohigh cells. d, e, Cell cycle analysis (d) and percentage of cells in G1/G0 or S/G2/M in the top 2.5%, 10%, 25% or 50% OP-purohigh cells in late anagen (e). Data represent mean ± s.d. f, Scatter plots correlating protein synthesis in the 2.5% OP-purohigh population with percentage of cells in S/G2/M (upper panel) and G1/G0 (lower panel) using all samples independent of hair cycle stage. Linear regression, correlation coefficient (r2) and P-value are shown. g, Box plots of protein synthesis (upper panel) and number of cycling cells (lower panel) in the top 2.5% translating cell populations (OP-purohigh). h, Box plots of protein synthesis in cycling (S/G2/M) and non-dividing (G1/G0) cells in the 2.5% OP-purohigh population isolated from Lgr5tdTom mice. Shown are all cells (upper panel), tdTomato-negative (Tom-) (middle panel) and tdTomato-positive (Tom+) (lower panel) cells at the indicated hair cycle stages. Two-tailed Student’s t-test. **p < 0.01, ***p < 0.001, ****p<0.0001. (n=mice). Source data: SI_EDF3.
Extended data Figure 4. Protein synthesis in squamous tumours.
a-c, Co-labelling of OP-puro with markers for undifferentiated basal cells: Itgα6 (a), CD44 (b) and PDPN (c) in mouse tumours. Nuclei (DAPI). Arrows: low translating marker+ cells. Dotted line: invasive front of the tumour. Insets: magnified images (a’-c”). d, Gating of low, medium and high OP-puro cells in Nsun2+/+ (wt) and NSun2-/- K5-SOS skin tumours analysed in (e-g). e, Percentage of OP-purolow cells in tumours from Nsun2+/+ (wt) and NSun2-/- K5-SOS mice. f, g, Flow cytometry for Itgα6 and CD34 in unfractionated epithelial cells from mouse tumours (All cells) or epithelial cells with high, medium and low OP-puro incorporation (f) and quantification (g) (mean ± s.d.; n=3 mice). h, Flow cytometry for Itgα6 and CD44 in unfractionated epithelial cells from mouse tumours. i, j, Histogram (i) showing OP-puro incorporation of cells as gated in (h) and quantification (h) (mean ± s.d.; n=4 mice). k, l, Endogenous expression of NSun2 (LacZ) in early (P23) (k) and late (30) anagen (l) hair follicles. Sections were co-stained with eosin or markers for bulge stem cells (K15) and the hair lineages Huxley’s (Hu), cuticle (Ci) (GATA3), and cortex (Co) (LEF1). m-o, Haematoxylin & Eosin staining (m) and immunostaining for LEF1 (n), K72 and DLX3 (o) in wild-type (WT) and NSun2-/- skin at P1. Nuclei (DAPI). Insets: magnified boxed area (i, ii). Scale bars: 50 μm. (p) Correlation between proliferation and protein synthesis with differentiation of quiescent (QSC) or committed stem cells (CSC), committed progenitors (CP), differentiating progenitors (DP), and terminally differentiated (TD) cells. Source data: SI_EDF4.
Extended data Figure 5. NSun2 in mouse skin squamous cell carcinomas.
a, Immunostaining for NSun2, Itgα6, K10 (differentiation marker), Laminin 5 and K8 (tumour progression markers), and Slug (epithelial to mesenchymal transition-related gene) at different stages of DMBA-TPA-induced malignant progression to squamous cell carcinoma (SCC). b-d, Quantification of tumour diameter normalized to body weight (BW) (b), tumours per mouse (c), and mouse life span (d) in K5-SOS/NSun2+/+ (K5-SOS), K5-SOS/NSun2+/- and K5-SOS/NSun2-/- littermates. Measurements start at P16. Data collection discontinued when mice deceased (†). Data represent mean, n ≥ 5 mice of each genotype. e, f, Haematoxylin & Eosin staining (e) and immunostaining for Itgβ1 (f) in sections from K5-SOS (K5-SOS/NSun2+/+) and K5-SOS/NSun2-/- skin tumours. b: Basal undifferentiated cells; sb: suprabasal layers. Arrows: Itgβ1+ cells. g, Relative mRNA expression levels of the indicated transcripts in skin tumours (mean ± s.d.; n=mice). h, Flow cytometry using Itgα6 and CD44 in K5-SOS/NSun2-/- and control K5-SOS (K5-SOS/NSun2+/+) tumours. i, Percentage of cells in cell populations as gated in (h) (mean ± s.d.; n=mice). *p < 0.05; ***p < 0.001 (two-tailed Student’s t-test) (i). j, TUNEL assay on sections of K5-SOS tumours expressing (K5-SOS NSun2+/+) or lacking NSun2 (K5-SOS NSun2-/-). Arrows: TUNEL+ (apoptotic) cells. Nuclei (DAPI) and dotted line: boundary of epithelia and stroma (f, j). Scale bars: 25 μm (a), 100 μm (e,f,j). Source data: SI_EDF5.
Extended data Figure 6. Deletion of NSun2 enhances self-renewal of tumour-initiating cells in a cell-autonomous manner and NSun2 expression in human skin tumours.
a, Tumour size after grafting of K5-SOS/NSun2+/+ (K5-SOS) and K5-SOS/NSun2-/- tumour cells subcutaneously into nude mice (mean ± s.d.; n = 3 mice). b-f, Histology (H&E staining) (b), staining for GFP (c), Ki67 (d), Itgβ1 (e), and PDPN (f) in grafted tumour sections. Dotted line: boundary between epithelia and stroma. Arrows: basal and suprabasal expression. Nuclei (DAPI). g-l, Immunohistochemistry for NSun2 in human normal skin, benign tumours, malignant basal cell carcinomas (BCC) and squamous cell carcinomas (SCC) with increased malignancy (stages classified using the TNM (Tumour, Node, Metastases) system). Arrows: NSun2high cells. Arrowheads: NSun2low cells. (m) Distribution of cells shown in (g-l) according to NSun2 protein levels. (n ≥ 3 samples). Scale bars: 100 μm. Source data: SI_EDF6.
Extended data Figure 7. NSun2-dependent RNA methylation of coding and non-coding RNA in tumours.
a, Percentage of NSun2-methylated sites (>0.15 m5C in NSun2+/+; <0.05 m5C in NSun2-/-) out of all covered sites (left hand panel) and in non-coding RNA (ncRNA) or introns and exons (right hand panel). b, Methylation level in coding and non-coding RNAs (>0.15 m5C in NSun2+/+; <0.05 m5C in NSun2-/-; coverage >10 reads). c-e, Examples of NSun2-targeted non-coding RNA (Rpph1) and mRNA (Elf1 and Dscaml1) in NSun2+/+ (upper panels) and NSun2-/- (lower panels) tumours. f, Number of NSun2-methylated sites in exons 1 to 60 (upper panel) or distance from the transcriptional start site (TSS) in introns (lower panel). Plotted sites: >0.1 m5C in NSun2+/+; <0.05 m5C in NSun2-/-; coverage >10 reads. g, No correlation between NSun2-methylation shown in (b) and RNA abundance in normal skin or K5-SOS skin tumours. NSun2 is highlighted as a control. h, Venn diagram with no significant overlap between NSun2- methylation targets shown in (b) and differentially translated mRNAs (p<0.05; measured as ribosome density of NSun2+/+ versus NSun2-/- tumours). i-l, NSun2-methylation in tRNAs (>0.15 m5C in NSun2+/+; <0.05 m5C in NSun2-/-; coverage >10 reads) (i). Number and location of lost (red) or unchanged (grey) m5C sites in NSun2-/- K5-SOS tumours. X-axis: nucleotide position in tRNA (j). Examples of NSun2-targeted tRNAs in NSun2+/+ (upper panels) and NSun2-/- (lower panels) K5-SOS tumours (k,l). Heat maps show methylated (red) and un-methylated (grey) cytosines. X-axis: cytosines. Y-axis: sequence reads. Numbers indicate the m5C position in the RNA (c-e;k,l). Bisulphite-seq and RNA-seq data represent average of 4 replicates per condition.
Extended data Figure 8. NSun2- deletion drives translational changes independent of mRNA expression.
a, Ribosome profiling and RNA sequencing experiments (see Figure 5) using NSun2-expressing (NSun2+/+) and NSun2-deficient (NSun2-/-) K5-SOS skin tumours, or cultured human skin fibroblasts (NSun2-/-Line1 and Line2 and healthy donors: NSun2+/-, NSun2+/+). HTS (High Throughput Sequencing). b, Correlation between protein synthesis (ribosome footprint density) in NSun2+/+ and -/- tumours. c, Example of triplet periodicity in ribosome footprints (K5-SOS/NSun2+/+, replicate 1) shown as number of reads against nucleotide position relative to the translation start site for all open reading frames. d, Heat maps showing ribosome footprint reads around the translational start site (0) in NSun2+/+ and NSun2-/- tumours (3 replicates per condition; ribosome density > 0; colour: RPKM values of footprints). e, Log2 fold-change (FC) per transcript in normal skin (left hand panel) and tumour samples (right hand panel) of significant (p<0.05) expression differences. NSun2 RNA levels (red). f-j, Scatter plots, linear regression lines and coefficient of correlation (r2) of mRNA expression and protein synthesis (density of ribosome footprints per kb) in NSun2+/+ (grey) and -/- (red) mouse tumours (f) and human fibroblasts (g-j). k, Venn diagram of transcripts with significant (p<0.05) different ribosome footprint density in the 5’UTR in NSun2+/-, NSun2-/-line1 and NSun2-/-line2 human fibroblasts relative to NSun2+/+ cells. l, Box plots of ribosome footprint read counts in the 5’UTR (left hand panel) and corresponding CDS (right hand panel) of the 192 transcripts in (k). ****p<0.0001 (two-tailed Student’s t-test).
Extended data Figure 9. RNA methylation-dependent changes of protein synthesis.
a, Venn diagram of transcripts with differential protein synthesis in NSun2+/- and NSun2-/- human fibroblasts relative to NSun2+/+ cells. b, GO terms enriched in 424 commonly differentially translated transcripts in NSun2-/- lines (a). c, Western blot for NSun2 and tubulin in NSun2-/- human fibroblasts rescued with viral constructs expressing wild-type NSun2 (NSun2-wt), two catalytically dead mutants (C271A and C321A) or the empty vector. d, Venn diagram of differentially translated genes in the indicated rescued cells relative to empty vector-infected control cells. Translation of 173 out of 746 of transcripts (23%) depended on the enzymatic activity of NSun2. e-g, Differential translation of transcripts relative to NSun2-/- cells (infected with empty vector) showing reduced translation in the presence of wild-type (wt) NSun2 but not the enzymatic-dead versions of NSun2 (C271A, C321A), corresponding GO categories (f) and examples (g). h, Boyden chamber migration assay towards epidermal growth factor (EGF) or control medium (ctr) using primary human keratinocytes transduced with a siRNA for NSun2 (si_NSun2) or a scrambled construct (si_ctr). Data represent mean ± s.d. (n=3 assays). Western blot confirms down-regulation of NSun2 in the presence of the siRNA construct. i, j Reduced motility in keratinocytes expressing the enzymatic-dead NSun2 construct (K190M) (K190M: n=13; NSun2: n=19 cells) (i). Western Blot confirms equal protein expression levels of K190M and NSun2 (j). k, Reduced differentiation in primary human keratinocytes expressing the enzymatic-dead NSun2 (K190M). Staining for NSun2, Itgα6 or Involucrin (IVL) and nuclei (DAPI). Control: empty vector (left hand panels); NSun2: wild-type NSun2 (middle panels), K190: enzymatic-dead NSun2 (right hand panels). Arrows: NSun2-expressing Itgα6-/IVL+ cells. Arrowheads: K190M-expressing Itgα6+/IVL- cells. l, Flow cytometry for Itgα6 of keratinocytes transduced with NSun2 (blue line, upper panel), K190M (blue line, lower panel) or the empty vector (eVector) (red line). Negative control (grey line) represents unstained cells. m, Quantification of IVL+ infected keratinocytes grown in suspension for 24 hours to stimulate differentiation. *p<0.05; **p<0.01 (two-tailed Student’s t-test) (h-m). Scale bar: 100 μm. Source data: SI_EDF9.
Extended data Figure 10. Protein expression differences, drug treatment of NSun2-/- tumours and graphical summary.
a, b, Western blot analysis of translationally repressed (a) or induced (b) mRNAs in NSun2-/- (-/-) compared to NSun2+/+ (wt) skin tumours with quantification of band densitometry on the right (mean ± s.d.; n=3 mice). *p < 0.05; ***p<0.001 (two-tailed Student’s t-test). c, d, Control and 5’FU-treated tumours, before and after treatment. e, f, Immunohistochemistry for p53 in tumours shown in (c,d). g-i, Immunostaining for cleaved caspase 3 (Cl-Casp3) (g), Ki67 (h), Itgα6 and K10 (i) in K5-SOS tumours expressing (+/+) or lacking (-/-) NSun2 and treated with CDDP (see Methods). Scale bars: 100 μm. j, Graphical summary: 1. Quiescent undifferentiated stem and progenitor cells are characterised by the absence of NSun2 and low global protein synthesis. 2. Up-regulation of NSun2 counteracts angiogenin-mediated cleavage of tRNAs through site-specific methylation of tRNAs allowing increased translation of lineage-specific transcripts driving terminal differentiation. 3. Cytotoxic stress inhibits NSun2 and global protein synthesis in particular of lineage-specific transcripts and promotes an undifferentiated quiescent cell state. Yet cell survival after the insult requires re-methylation of tRNAs by NSun2 (see 2.). 4. The inability to up-regulate NSun2 in response to the cytotoxic insult leads to cell death. Source data: SI_EDF10.
Supplementary Material
Acknowledgments
We thank John Marioni and Duncan Odom for their advice on analyzing the sequencing data. This work was funded by Cancer Research UK (CR-UK), Worldwide Cancer Research, the Medical Research Council (MRC), the European Research Council (ERC), and EMBO. Research in Michaela Frye's laboratory is supported by a core support grant from the Wellcome Trust and MRC to the Wellcome Trust-Medical Research Cambridge Stem Cell Institute.
Footnotes
Author contribution:
MF, SB, RB designed experiments and performed data analysis. SB, RB, MP, SH, AS, HT, RCG, and NG performed experiments. PL, JA, and SD performed bioinformatics analysis. MF, SB, and RB wrote the manuscript.
Author Information:
Mouse NGS data: GEO (GSE72067). Human data: dbGAP (phs000645.v2.p1).
Reprints and permissions information is available at www.nature.com/reprints.
The authors declare no competing financial interest.
Accession codes
All human sequencing data are available on dbGAP (phs000645.v2.p1). All mouse sequencing data are available on GEO under the accession number GSE72067.
References
- 1.Blanco S, et al. Aberrant methylation of tRNAs links cellular stress to neuro-developmental disorders. The EMBO journal. 2014;33:2020–2039. doi: 10.15252/embj.201489282. [DOI] [PMC free article] [PubMed] [Google Scholar]
- 2.Tuorto F, et al. RNA cytosine methylation by Dnmt2 and NSun2 promotes tRNA stability and protein synthesis. Nat Struct Mol Biol. 2012;19:900–905. doi: 10.1038/nsmb.2357. doi:nsmb.2357 [pii] [DOI] [PubMed] [Google Scholar]
- 3.Schaefer M, et al. RNA methylation by Dnmt2 protects transfer RNAs against stress-induced cleavage. Genes Dev. 2010;24:1590–1595. doi: 10.1101/gad.586710. doi:24/15/1590 [pii] [DOI] [PMC free article] [PubMed] [Google Scholar]
- 4.Ivanov P, Emara MM, Villen J, Gygi SP, Anderson P. Angiogenin-induced tRNA fragments inhibit translation initiation. Mol Cell. 2011;43:613–623. doi: 10.1016/j.molcel.2011.06.022. doi:S1097-2765(11)00524-7 [pii] [DOI] [PMC free article] [PubMed] [Google Scholar]
- 5.Spriggs KA, Bushell M, Willis A. Translational regulation of gene expression during conditions of cell stress. Mol Cell. 2010;40:228–237. doi: 10.1016/j.molcel.2010.09.028. [DOI] [PubMed] [Google Scholar]
- 6.Sobala A, Hutvagner G. Small RNAs derived from the 5' end of tRNA can inhibit protein translation in human cells. RNA Biol. 2013;10:553–563. doi: 10.4161/rna.24285. [DOI] [PMC free article] [PubMed] [Google Scholar]
- 7.Gebetsberger J, Zywicki M, Kunzi A, Polacek N. tRNA-derived fragments target the ribosome and function as regulatory non-coding RNA in Haloferax volcanii. Archaea. 2012;2012:260909. doi: 10.1155/2012/260909. [DOI] [PMC free article] [PubMed] [Google Scholar]
- 8.Khan MA, et al. Mutation in NSUN2, which Encodes an RNA Methyltransferase, Causes Autosomal-Recessive Intellectual Disability. Am J Hum Genet. 2012;90:856–863. doi: 10.1016/j.ajhg.2012.03.023. doi:S0002-9297(12)00203-0 [pii] [DOI] [PMC free article] [PubMed] [Google Scholar]
- 9.Martinez FJ, et al. Whole exome sequencing identifies a splicing mutation in NSUN2 as a cause of a Dubowitz-like syndrome. J Med Genet. 2012;49:380–385. doi: 10.1136/jmedgenet-2011-100686. [DOI] [PMC free article] [PubMed] [Google Scholar]
- 10.Abbasi-Moheb L, et al. Mutations in NSUN2 cause autosomal-recessive intellectual disability. Am J Hum Genet. 2012;90:847–855. doi: 10.1016/j.ajhg.2012.03.021. doi:S0002-9297(12)00199-1 [pii] [DOI] [PMC free article] [PubMed] [Google Scholar]
- 11.Blanco S, et al. The RNA-methyltransferase Misu (NSun2) poises epidermal stem cells to differentiate. PLoS Genet. 2011;7:e1002403. doi: 10.1371/journal.pgen.1002403. PGENETICS-D-11-00619 [pii] [DOI] [PMC free article] [PubMed] [Google Scholar]
- 12.Hussain S, et al. The Mouse Cytosine-5 RNA Methyltransferase NSun2 Is a Component of the Chromatoid Body and Required for Testis Differentiation. Mol Cell Biol. 2013;33:1561–1570. doi: 10.1128/MCB.01523-12. [DOI] [PMC free article] [PubMed] [Google Scholar]
- 13.Fuchs E. Cell biology: More than skin deep. J Cell Biol. 2015;209:629–631. doi: 10.1083/jcb.201503129. [DOI] [PMC free article] [PubMed] [Google Scholar]
- 14.Plikus MV, Chuong CM. Macroenvironmental regulation of hair cycling and collective regenerative behavior. Cold Spring Harbor perspectives in medicine. 2014;4:a015198. doi: 10.1101/cshperspect.a015198. [DOI] [PMC free article] [PubMed] [Google Scholar]
- 15.Muller-Rover S, et al. A comprehensive guide for the accurate classification of murine hair follicles in distinct hair cycle stages. J Invest Dermatol. 2001;117:3–15. doi: 10.1046/j.0022-202x.2001.01377.x. [DOI] [PubMed] [Google Scholar]
- 16.Jaks V, et al. Lgr5 marks cycling, yet long-lived, hair follicle stem cells. Nat Genet. 2008;40:1291–1299. doi: 10.1038/ng.239. doi:ng.239 [pii] [DOI] [PubMed] [Google Scholar]
- 17.Trempus CS, et al. Enrichment for living murine keratinocytes from the hair follicle bulge with the cell surface marker CD34. J Invest Dermatol. 2003;120:501–511. doi: 10.1046/j.1523-1747.2003.12088.x. doi:12088 [pii] [DOI] [PubMed] [Google Scholar]
- 18.Youssef KK, et al. Identification of the cell lineage at the origin of basal cell carcinoma. Nat Cell Biol. 2010;12:299–305. doi: 10.1038/ncb2031. doi:ncb2031 [pii] [DOI] [PubMed] [Google Scholar]
- 19.Signer RA, Magee JA, Salic A, Morrison S. Haematopoietic stem cells require a highly regulated protein synthesis rate. Nature. 2014;509:49–54. doi: 10.1038/nature13035. [DOI] [PMC free article] [PubMed] [Google Scholar]
- 20.Fuchs E. Scratching the surface of skin development. Nature. 2007;445:834–842. doi: 10.1038/nature05659. doi:nature05659 [pii] [DOI] [PMC free article] [PubMed] [Google Scholar]
- 21.Hirai Y, Nose A, Kobayashi S, Takeichi M. Expression and role of E- and P-cadherin adhesion molecules in embryonic histogenesis. II. Skin morphogenesis. Development. 1989;105:271–277. doi: 10.1242/dev.105.2.271. [DOI] [PubMed] [Google Scholar]
- 22.Joshi RS. The Inner Root Sheath and the Men Associated with it Eponymically. International journal of trichology. 2011;3:57–62. doi: 10.4103/0974-7753.82119. [DOI] [PMC free article] [PubMed] [Google Scholar]
- 23.Sibilia M, et al. The EGF receptor provides an essential survival signal for SOS-dependent skin tumor development. Cell. 2000;102:211–220. doi: 10.1016/s0092-8674(00)00026-x. [DOI] [PubMed] [Google Scholar]
- 24.Egeblad M, Nakasone ES, Werb Z. Tumors as organs: complex tissues that interface with the entire organism. Dev Cell. 2010;18:884–901. doi: 10.1016/j.devcel.2010.05.012. [DOI] [PMC free article] [PubMed] [Google Scholar]
- 25.Malanchi I, et al. Cutaneous cancer stem cell maintenance is dependent on beta-catenin signalling. Nature. 2008;452:650–653. doi: 10.1038/nature06835. doi:nature06835 [pii] [DOI] [PubMed] [Google Scholar]
- 26.Atsumi N, et al. Podoplanin, a novel marker of tumor-initiating cells in human squamous cell carcinoma A431. Biochemical and biophysical research communications. 2008;373:36–41. doi: 10.1016/j.bbrc.2008.05.163. [DOI] [PubMed] [Google Scholar]
- 27.Schober M, Fuchs E. Tumor-initiating stem cells of squamous cell carcinomas and their control by TGF-beta and integrin/focal adhesion kinase (FAK) signaling. Proc Natl Acad Sci U S A. 2011;108:10544–10549. doi: 10.1073/pnas.1107807108. doi:1107807108 [pii] [DOI] [PMC free article] [PubMed] [Google Scholar]
- 28.Owens DM, Romero MR, Gardner C, Watt FM. Suprabasal alpha6beta4 integrin expression in epidermis results in enhanced tumourigenesis and disruption of TGFbeta signalling. J Cell Sci. 2003;116:3783–3791. doi: 10.1242/jcs.00725. [DOI] [PubMed] [Google Scholar]
- 29.Lin HC, et al. High-level beta1-integrin expression in a subpopulation of highly tumorigenic oral cancer cells. Clinical oral investigations. 2014;18:1277–1284. doi: 10.1007/s00784-013-1088-y. [DOI] [PubMed] [Google Scholar]
- 30.Ruggero D. Translational control in cancer etiology. Cold Spring Harb Perspect Biol. 2013;5 doi: 10.1101/cshperspect.a012336. [DOI] [PMC free article] [PubMed] [Google Scholar]
- 31.Frye M, Watt FM. The RNA methyltransferase Misu (NSun2) mediates Myc-induced proliferation and is upregulated in tumors. Curr Biol. 2006;16:971–981. doi: 10.1016/j.cub.2006.04.027. [DOI] [PubMed] [Google Scholar]
- 32.Frye M, et al. Genomic gain of 5p15 leads to over-expression of Misu (NSUN2) in breast cancer. Cancer Lett. 2009 doi: 10.1016/j.canlet.2009.08.004. [DOI] [PubMed] [Google Scholar]
- 33.Schaefer M, Pollex T, Hanna K, Lyko F. RNA cytosine methylation analysis by bisulfite sequencing. Nucleic Acids Res. 2009;37:e12. doi: 10.1093/nar/gkn954. doi:gkn954 [pii] [DOI] [PMC free article] [PubMed] [Google Scholar]
- 34.Hussain S, et al. NSun2-mediated cytosine-5 methylation of vault noncoding RNA determines its processing into regulatory small RNAs. Cell reports. 2013;4:255–261. doi: 10.1016/j.celrep.2013.06.029. [DOI] [PMC free article] [PubMed] [Google Scholar]
- 35.Hussain S, Aleksic J, Blanco S, Dietmann S, Frye M. Characterizing 5-methylcytosine in the mammalian epitranscriptome. Genome Biol. 2013;14:215. doi: 10.1186/gb4143. [DOI] [PMC free article] [PubMed] [Google Scholar]
- 36.Khoddami V, Cairns BR. Identification of direct targets and modified bases of RNA cytosine methyltransferases. Nat Biotechnol. 2013;31:458–464. doi: 10.1038/nbt.2566. [DOI] [PMC free article] [PubMed] [Google Scholar]
- 37.Zhang X, et al. The tRNA methyltransferase NSun2 stabilizes p16INK(4) mRNA by methylating the 3'-untranslated region of p16. Nat Commun. 2012;3:712. doi: 10.1038/ncomms1692. doi:ncomms1692 [pii] [DOI] [PMC free article] [PubMed] [Google Scholar]
- 38.Tang H, et al. NSun2 delays replicative senescence by repressing p27 (KIP1) translation and elevating CDK1 translation. Aging. 2015;7:1143–1158. doi: 10.18632/aging.100860. [DOI] [PMC free article] [PubMed] [Google Scholar]
- 39.Xing J, et al. NSun2 Promotes Cell Growth via Elevating Cyclin-Dependent Kinase 1 Translation. Mol Cell Biol. 2015;35:4043–4052. doi: 10.1128/MCB.00742-15. [DOI] [PMC free article] [PubMed] [Google Scholar]
- 40.Baranov PV, Michel AM. Illuminating translation with ribosome profiling spectra. Nat Methods. 2016;13:123–124. doi: 10.1038/nmeth.3738. [DOI] [PubMed] [Google Scholar]
- 41.Ingolia NT, Lareau LF, Weissman JS. Ribosome profiling of mouse embryonic stem cells reveals the complexity and dynamics of mammalian proteomes. Cell. 2011;147:789–802. doi: 10.1016/j.cell.2011.10.002. [DOI] [PMC free article] [PubMed] [Google Scholar]
- 42.Schwanhausser B, et al. Global quantification of mammalian gene expression control. Nature. 2011;473:337–342. doi: 10.1038/nature10098. [DOI] [PubMed] [Google Scholar]
- 43.Gerashchenko MV, Lobanov AV, Gladyshev VN. Genome-wide ribosome profiling reveals complex translational regulation in response to oxidative stress. Proc Natl Acad Sci U S A. 2012;109:17394–17399. doi: 10.1073/pnas.1120799109. [DOI] [PMC free article] [PubMed] [Google Scholar]
- 44.Ingolia NT, Ghaemmaghami S, Newman JR, Weissman JS. Genome-wide analysis in vivo of translation with nucleotide resolution using ribosome profiling. Science. 2009;324:218–223. doi: 10.1126/science.1168978. [DOI] [PMC free article] [PubMed] [Google Scholar]
- 45.Calvo SE, Pagliarini DJ, Mootha VK. Upstream open reading frames cause widespread reduction of protein expression and are polymorphic among humans. Proc Natl Acad Sci U S A. 2009;106:7507–7512. doi: 10.1073/pnas.0810916106. [DOI] [PMC free article] [PubMed] [Google Scholar]
- 46.Schleich S, et al. DENR-MCT-1 promotes translation re-initiation downstream of uORFs to control tissue growth. Nature. 2014;512:208–212. doi: 10.1038/nature13401. [DOI] [PMC free article] [PubMed] [Google Scholar]
- 47.Lu PD, Harding HP, Ron D. Translation reinitiation at alternative open reading frames regulates gene expression in an integrated stress response. J Cell Biol. 2004;167:27–33. doi: 10.1083/jcb.200408003. [DOI] [PMC free article] [PubMed] [Google Scholar]
- 48.Morris DR, Geballe AP. Upstream open reading frames as regulators of mRNA translation. Mol Cell Biol. 2000;20:8635–8642. doi: 10.1128/mcb.20.23.8635-8642.2000. [DOI] [PMC free article] [PubMed] [Google Scholar]
- 49.Longley DB, Harkin DP, Johnston PG. 5-fluorouracil: mechanisms of action and clinical strategies. Nat Rev Cancer. 2003;3:330–338. doi: 10.1038/nrc1074. [DOI] [PubMed] [Google Scholar]
- 50.Kao RY, et al. A small-molecule inhibitor of the ribonucleolytic activity of human angiogenin that possesses antitumor activity. Proc Natl Acad Sci U S A. 2002;99:10066–10071. doi: 10.1073/pnas.152342999. 152342999 [pii] [DOI] [PMC free article] [PubMed] [Google Scholar]
- 51.Madisen L, et al. A robust and high-throughput Cre reporting and characterization system for the whole mouse brain. Nature neuroscience. 2010;13:133–140. doi: 10.1038/nn.2467. [DOI] [PMC free article] [PubMed] [Google Scholar]
- 52.Means AL, Xu Y, Zhao A, Ray KC, Gu G. A CK19(CreERT) knockin mouse line allows for conditional DNA recombination in epithelial cells in multiple endodermal organs. Genesis. 2008;46:318–323. doi: 10.1002/dvg.20397. [DOI] [PMC free article] [PubMed] [Google Scholar]
- 53.Barker N, et al. Identification of stem cells in small intestine and colon by marker gene Lgr5. Nature. 2007;449:1003–1007. doi: 10.1038/nature06196. [DOI] [PubMed] [Google Scholar]
- 54.Blanco S, et al. The RNA-methyltransferase Misu (NSun2) poises epidermal stem cells to differentiate. PLoS genetics. 2011;7:e1002403. doi: 10.1371/journal.pgen.1002403. [DOI] [PMC free article] [PubMed] [Google Scholar]
- 55.Sibilia M, et al. The EGF receptor provides an essential survival signal for SOS-dependent skin tumor development. Cell. 2000;102:211–220. doi: 10.1016/s0092-8674(00)00026-x. [DOI] [PubMed] [Google Scholar]
- 56.Braun KM, et al. Manipulation of stem cell proliferation and lineage commitment: visualisation of label-retaining cells in wholemounts of mouse epidermis. Development. 2003;130:5241–5255. doi: 10.1242/dev.00703. [DOI] [PubMed] [Google Scholar]
- 57.Frye M, Watt FM. The RNA methyltransferase Misu (NSun2) mediates Myc-induced proliferation and is upregulated in tumors. Current biology : CB. 2006;16:971–981. doi: 10.1016/j.cub.2006.04.027. [DOI] [PubMed] [Google Scholar]
- 58.Longley DB, Harkin DP, Johnston PG. 5-fluorouracil: mechanisms of action and clinical strategies. Nat Rev Cancer. 2003;3:330–338. doi: 10.1038/nrc1074. [DOI] [PubMed] [Google Scholar]
- 59.Blanco S, et al. Aberrant methylation of tRNAs links cellular stress to neuro-developmental disorders. The EMBO journal. 2014;33:2020–2039. doi: 10.15252/embj.201489282. [DOI] [PMC free article] [PubMed] [Google Scholar]
- 60.Kao RY, et al. A small-molecule inhibitor of the ribonucleolytic activity of human angiogenin that possesses antitumor activity. Proceedings of the National Academy of Sciences of the United States of America. 2002;99:10066–10071. doi: 10.1073/pnas.152342999. [DOI] [PMC free article] [PubMed] [Google Scholar]
- 61.Martinez FJ, et al. Whole exome sequencing identifies a splicing mutation in NSun2 as a cause of a Dubowitz-like syndrome. Journal of medical genetics. 2012;9:380–385. doi: 10.1136/jmedgenet-2011-100686. [DOI] [PMC free article] [PubMed] [Google Scholar]
- 62.Hussain S, et al. The nucleolar RNA methyltransferase Misu (NSun2) is required for mitotic spindle stability. The Journal of cell biology. 2009;186:27–40. doi: 10.1083/jcb.200810180. [DOI] [PMC free article] [PubMed] [Google Scholar]
- 63.Schaefer M, Pollex T, Hanna K, Lyko F. RNA cytosine methylation analysis by bisulfite sequencing. Nucleic acids research. 2009;37:e12. doi: 10.1093/nar/gkn954. [DOI] [PMC free article] [PubMed] [Google Scholar]
- 64.Ingolia NT, Brar GA, Rouskin S, McGeachy AM, Weissman JS. The ribosome profiling strategy for monitoring translation in vivo by deep sequencing of ribosome-protected mRNA fragments. Nature protocols. 2012;7:1534–1550. doi: 10.1038/nprot.2012.086. [DOI] [PMC free article] [PubMed] [Google Scholar]
- 65.Ingolia NT. Genome-wide translational profiling by ribosome footprinting. Methods in enzymology. 2010;470:119–142. doi: 10.1016/S0076-6879(10)70006-9. [DOI] [PubMed] [Google Scholar]
- 66.Ingolia NT, Ghaemmaghami S, Newman JR, Weissman JS. Genome-wide analysis in vivo of translation with nucleotide resolution using ribosome profiling. Science. 2009;324:218–223. doi: 10.1126/science.1168978. [DOI] [PMC free article] [PubMed] [Google Scholar]
- 67.Ingolia NT, Lareau LF, Weissman JS. Ribosome profiling of mouse embryonic stem cells reveals the complexity and dynamics of mammalian proteomes. Cell. 2011;147:789–802. doi: 10.1016/j.cell.2011.10.002. [DOI] [PMC free article] [PubMed] [Google Scholar]
- 68.Schneider-Poetsch T, et al. Inhibition of eukaryotic translation elongation by cycloheximide and lactimidomycin. Nature chemical biology. 2010;6:209–217. doi: 10.1038/nchembio.304. [DOI] [PMC free article] [PubMed] [Google Scholar]
- 69.Weinberg DE, et al. Improved ribosome-footprint and mRNA measurements provide insights into dynamics and regulation of yeast translation. bioRxiv. 2015 doi: 10.1101/021501. [DOI] [PMC free article] [PubMed] [Google Scholar]
- 70.Hintze JL, Nelson RD. Violin plots: a box plot-density trace synergism. The American Statistician. 1998;52:4. [Google Scholar]
Associated Data
This section collects any data citations, data availability statements, or supplementary materials included in this article.


