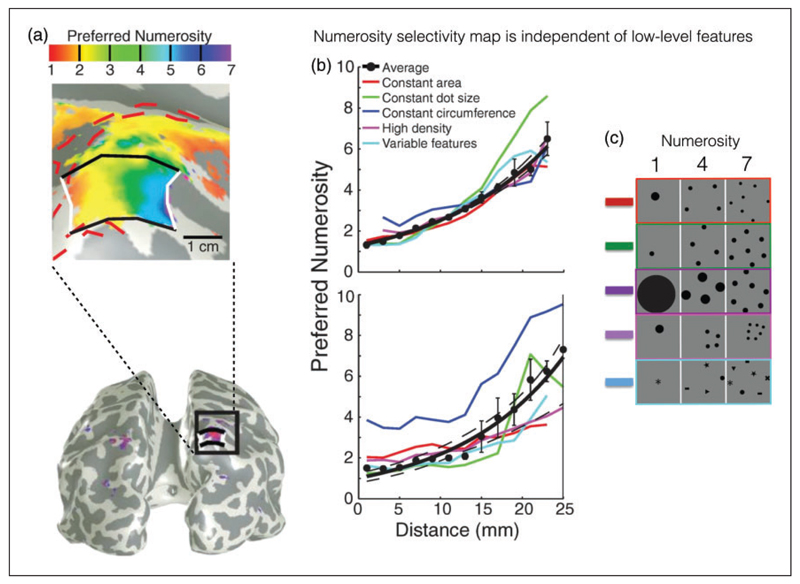
Figure 4. Topographic representation of numerosity in human parietal cortex.
(a) Spatially organized numerosity map for small numbers of elements (from 1 to 7) in the parietal cortex. Color code reflects brain regions preferentially activated by given numerosities. (b) Progression of numerosity selectivity (dots) as a function of distances from white lines in Figure 4(a). Different line colors refer to separate conditions where low-level features of stimuli were controlled for Figure 4(c). Adapted with permission from Harvey et al. (2013).

