Abstract
The ability to relate a hierarchy of protein motions to function remains a compelling experimental challenge at the interface of chemistry and biology. In particular, the proposed contribution of distinctly different classes of local vs. global protein motions during enzymatic catalysis of bond making/breaking processes has been difficult to capture and verify. Herein we employ soybean lipoxygenase-1 as a model system to investigate the impact of high pressure at variable temperatures on the hydrogen tunneling properties of wild type protein and three single site mutants. For all variants, pressure dramatically elevates the experimental enthalpies of activation accompanying the C-H activation step, as predicted for non-physiological conditions that lead to impairment of a protein’s global conformational landscape. In marked contrast, the primary kinetic isotope effects for C-H activation and their corresponding temperature-dependencies remain unchanged up to ca. 700 bar. The differential impact of elevated hydrostatic pressure on the temperature dependencies of rate constants, vs. substrate kinetic isotope effects provides direct experimental verification of two classes of protein motions: local, isotope-dependent donor-acceptor distance sampling modes that are distinct from the more global, isotope independent search for productive protein conformational sub-states.
Keywords: Biocatalysis, Protein Motions, High-pressure, Conformational-landscape, Hydrogen-tunnelling
Graphical Abstract

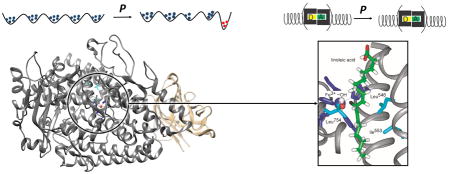
We show how the impact of hydrostatic pressure on steady-state rate constants, substrate kinetic isotope effects and their temperature dependencies is able to distinguish isotope-dependent, local protein motions from a more global, isotope-independent conformational landscape contributing to the primary C-H activation step.
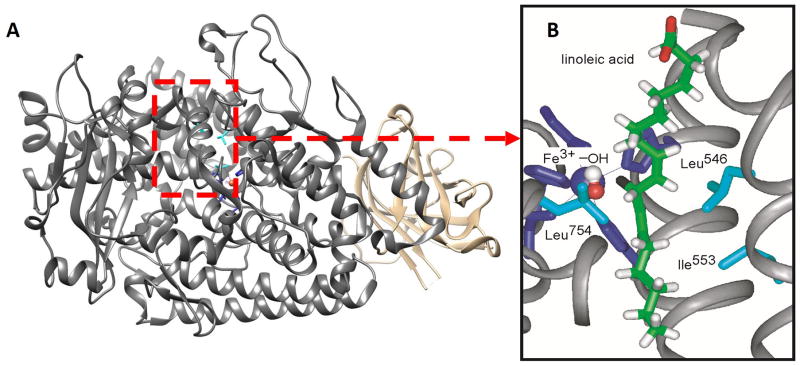
There has been increasing recognition that a hierarchy of protein motions can affect catalytic rate enhancements, with these motions occurring throughout the entire protein on time scales that vary from femtoseconds to milliseconds.[1] Although loop closures directly over the active site have long been implicated in catalysis,[2] the importance of a highly tuned conformational landscape in optimizing active site chemistry is also increasingly apparent.[3] Biophysical probes, aided by computational work, are showing progress in identifying functionally relevant motions;[1a,4] however, our ability to design experimental methods that can distinguish the impact of global and local protein motions on isolated chemical steps remains a challenging and compelling issue.[5] Soybean lipoxygenase-1 (SLO-1, Figure 1), a prototype for the study of enzymatic C-H activation via hydrogen-tunneling, is providing a unique window into the subtle influence of protein motions on catalysis.[6,7] In the present study, we focus on understanding the underlying interaction between two distinct classes of catalysis-linked protein motions in H-transfer reactions: local distance sampling that is dependent on substrate labeling with isotopes and global conformational landscapes that are independent of this labeling.[3,5] We systematically explore the combined impact of temperature and pressure on the full set of kinetics parameters for WT SLO-1 and a range of mutants with established kinetic properties at ambient pressure. Surprisingly, pressure is found to primarily influence the isotope-independent motions in SLO-1, leaving local, isotope-dependent motions virtually unperturbed.
Figure 1.
(A) X-ray structure for SLO-1 (PDB code 1F8N), with active site residues in red box and N-terminus colored tan. (B) X-ray structure of the active site of SLO-1, with LA modeled into the active site. The side-chains L546, L754 and I553 are colored cyan. Figure taken from Ref. 6b.
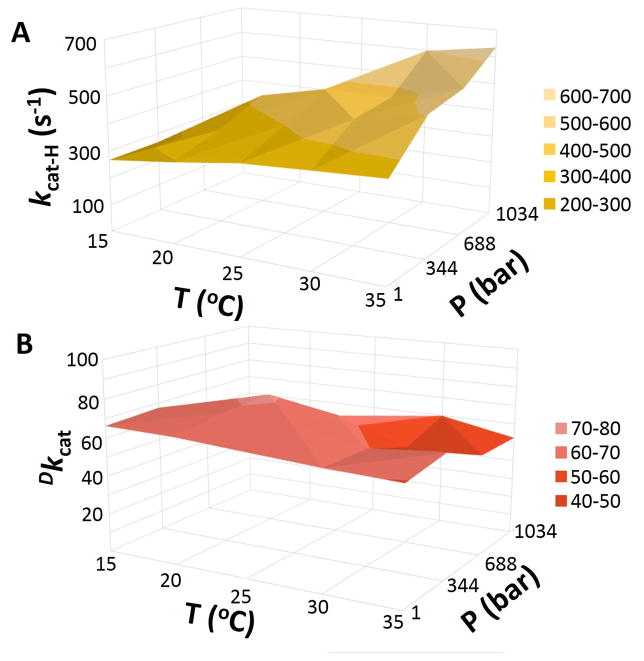
A large number of controls were first conducted to establish an artifact-free steady state kinetic assay (Supporting Information 2.1). The pressure dependence of SLO-1 activity with H-LA and D-LA was then measured between 1 bar and 1,034 bar at five temperatures between 15°C and 35°C. Figures 2A and 2B show three dimensional pressure-temperature effects on the rate constants for H-LA (kcat-H) and the primary KIEs on kcat (Dkcat) for WT SLO. In general, the impact of high pressure on both H- and D-LA increases with temperature (Figure 2A), leading to an almost negligible effect on the Dkcat values (Figure 2B). An alternate representative of pressure effects is plotted for kcat-H and Dkcat at each experimental temperature (Figure S3).
Figure 2.
The combined impact of pressure and temperature on kinetic parameters for WT-SLO: kcat-H (A) and Dkcat (B).
In order to examine these trends in more detail, we introduce the parameter S, representing the ratio of the kinetic parameters at 344, 688 and 1034 bar, respectively, relative to ambient pressure; this provides a quantitative indicator of the impact of pressure in the experimental temperature range. The unaltered S(kcat-H) values at 15°C for WT, Table 1 demonstrate that elevated pressure barely influences the rate constants toward H-LA at low temperature. In contrast, at 35°C, the S(kcat-H) value increases to 1.77 at 1,034 bar. The S values with D-LA as substrate are the same as H-LA at 344 bar, but rise slightly faster above this pressure. We have previously shown that quite small changes in H-donor-acceptor distances can lead to significant rate differences.[6d] Using previously derived expressions[7a], we attribute the present increases in rate at 1.034 bar to a very small active site compression, of ca. 0.02 Å, that affects the H-transfer slightly less than that for D-transfer.[8]
Table 1.
Impact of pressure on rate constants and KIEs at the extremes of the experimental temperature range. [a]
| SLO | T (K) | 344 bar | 688 bar | 1034 bar | |||
|---|---|---|---|---|---|---|---|
|
| |||||||
| S (kcat-H) | S (kcat-D) | S (kcat-H) | S (kcat-D) | S (kcat-H) | S (kcat-D) | ||
| WT | 288 | 1.00 (0.05) | 0.98 (0.03 | 0.97 (0.08) | 1.17 (0.02) | 0.97 (0.09) | 1.22 (0.03) |
| 308 | 1.40 (0.18) | 1.32 (0.06) | 1.50 (0.10) | 1.69 (0.07) | 1.77 (0.08) | 2.10 (0.11) | |
|
| |||||||
| I553V | 288 | 1.08 (0.09) | 1.02 (0.02) | 1.10 (0.13) | 1.07 (0.01) | 1.01 (0.19) | 1.25 (0.02) |
| 308 | 1.10 (0.02) | 1.00 (0.02) | 1.43 (0.03) | 1.27 (0.02) | 1.66 (0.03) | 1.82 (0.04) | |
|
| |||||||
| L546A | 288 | 1.03 (0.02) | 1.14 (0.02) | 1.20 (0.06) | 1.32 (0.04) | 1.28 (0.03) | 1.56 (0.03) |
| 308 | 1.07 (0.02) | 1.28 (0.04) | 1.42 (0.07) | 1.55 (0.04) | 1.68 (0.07) | 1.95 (0.03) | |
|
| |||||||
| L754A | 208 | 1.58 (0.10) | N.D.[b] | 2.92 (0.14) | N.D.[b] | 4.24 (0.24) | N.D.[b] |
| 308 | 1.90 (0.13) | N.D.[b] | 3.35 (0.20) | N.D.[b] | 5.26 (0.44) | N.D.[b] | |
S is the ratio of kinetic parameters at the pressure listed relative to ambient pressure (Table S3–S6).
The kcat-D values were too slow to be accurately determined.
Three variants, I553V, L546A and L754A, were then investigated at the same pressure and temperature range as WT. The reason that I553V was chosen as the representative of the I553X series is that the most extreme variants, I553A and I553G, led to protein instability under high pressure. As seen in Figure 1B, L546 and L754 sandwich the reactive carbon atom (position 11) of the substrate into proper position for reaction with the iron center, whereas I553 is more distal. Compared to the WT, the single mutants L546A and L754A reduce kcat-H by 102 and 103 fold, respectively, and lead to an increase in the contribution of an H-donor-acceptor distance sampling. [6b] The more distal variant, I553V, exhibits changes in active site flexibility without a significant impact on the magnitude of kcat.[6c] The fact that these variants show such a wide variation in properties makes them excellent candidates for comparative high pressure studies. Surprisingly, even with the generation of interior cavities and more flexible active sites, I553V and L546A display pressure-induced trends similar to WT in their rate constants and Dkcat, albeit with minor differences in the S values. For L754A, it was only possible to measure kcat-H under high pressure, due to the very low turnover efficiency with D-LA. Table 1 shows that the kcat-H for L754A is more sensitive to elevated pressure, as reflected by the maximal ca. 5-fold increase in rate constants above 1k bar, compared to the less than 2-fold acceleration in rate for the other SLO-1 variants. Anisotropic pressure effects are not unexpected, due to the asymmetric impact of pressure on protein functional compressibility.[9]
The temperature-dependent rate constants (Table S3–S6) were then fit to the Arrhenius equation, affording the activation energies for H-LA (Ea(H)), D-LA (Ea(D)) and ΔEa [(Ea(D) - Ea(H)] under varied pressures (Table 2). As shown, increasing pressure to 688 bar elevates the Ea(H) in a regular manner, with a more abrupt change occurring at or above 1 kbar. The Arrhenius prefactor (AH) rises concomitant with Ea, as expected for the much greater changes in Ea (Table 2) than kcat (Table 1).[10] In marked contrast to the trends in Ea values, the temperature dependency of the kinetic isotope effect (ΔEa) remains constant up to 688 bar, both in the case of the weakly temperature-dependent WT SLO (ΔEa ~ 1.0 kcal/mol, entries 1–3), and the more temperature-dependent I553V and L546A (ΔEa ~ 3.0 kcal/mol, entries 5–7 and entries 9–11). A break in protein behavior above 688 bar is evident from the ΔEa as well as the Ea values, producing a reduction in the temperature dependence of the KIEs for WT, I553V and L546A. The concomitant break in Ea and ΔEa at ca. 1 kbar indicates a discontinuous impact on protein structure that likely involves both a more rigid active site (smaller ΔEa) and impaired conformational landscape (large Ea). The origin of this effect is currently unknown, but is almost certainly related to a pressure-induced onset of partially unfolded protein.[11]
Table 2.
Arrhenius parameters for rate constants and KIEs at each pressure investigated.[a]
| Entry | Enzyme | Pressure (bar) | Ea(H) (kcal/mol) | ΔEa (kcal/mol)[b] | ln(AH) |
|---|---|---|---|---|---|
| 1 | WT | 1 | 2.63(0.33) | 1.19(0.42) | 10.2(0.6) |
| 2 | 344 | 5.65(0.46) | 0.81(0.65) | 15.5(0.9) | |
| 3 | 688 | 6.03(1.17) | 1.02(1.12) | 15.7(2.3) | |
|
|
|||||
| 4 | 1034 | 7.62(0.63) | 0.43(0.79) | 18.9(1.2) | |
|
| |||||
| 5 | I553V | 1 | 3.06(0.31) | 2.82(0.41) | 10.5(0.5) |
| 6 | 344 | 3.09(0.40) | 2.85(0.61) | 10.6(0.7) | |
| 7 | 688 | 4.90(0.46) | 2.93(0.69) | 13.7(0.8) | |
|
|
|||||
| 8 | 1034 | 8.01(0.55) | 0.89(1.08) | 19.0(1.0) | |
|
| |||||
| 9 | L546A | 1 | 3.90(0.20) | 3.02(0.51) | 8.7(0.4) |
| 10 | 344 | 4.86(0.35) | 3.36(0.37) | 10.4(0.7) | |
| 11 | 688 | 5.37(0.48) | 2.95(0.52) | 11.4(0.8) | |
|
|
|||||
| 12 | 1034 | 6.67(0.69) | 2.32(0.78) | 13.7(1.3) | |
|
| |||||
| 13 | L754A | 1 | 2.79(0.20) | N.D.[c] | 3.4(0.1) |
| 14 | 344 | 4.31(0.60) | N.D.[c] | 6.5(1.0) | |
| 15 | 688 | 3.64(0.39) | N.D.[c] | 6.0(0.7) | |
|
|
|||||
| 16 | 1034 | 4.06(0.36) | N.D.[c] | 7.1(0.6) | |
The obtained values for Ea and ΔEa are slightly different, with larger errors, compared to the previous report,[6] probably due to the narrower temperature window herein (15–35°C) compared to a range of 5–50°C in previous studies. In the present study, protein instability at high pressure precluded measurements below 15°C or higher than 35°C.
ΔEa= Ea(D)− Ea(H).
The Ea(D) values of L754A under varied pressure were experimentally inaccessible.
That the values of ΔEa for WT remain almost identical up to a pressure of 688 bar implies an unaltered force constant for the distance sampling mode as the protein undergoes compression. The contrasting and significant changes in the overall Ea values in this pressure range could, in principle, have arisen from a variety of factors that include changes in reaction driving force (ΔG°), reorganization energy (λ), the energy barrier for donor-acceptor distance sampling Ex and/or alterations in the conformational landscape (Supporting Information 2.2). Importantly, our ability to eliminate any significant change to Ex up to 688 bar implies a high degree of insulation of the active site from pressure-induced structural changes. Since the distance sampling term, Ex, that leads to the experimental ΔEa, is dependent on both the initial H-donor and acceptor and the local electrostatic interactions that determine the force constant for distance sampling, we similarly conclude that significant changes in the local electrostatic properties affecting λ and ΔG° are likely to be quite small. These properties imply that the differential effects of elevated pressure on Ea vs. ΔEa arise from alterations in the global conformational landscape of SLO-1. In support of this conclusion, the variants that impart packing defects and more flexible active sites [6b,c] show significantly elevated Ea values while leaving ΔEa unaltered with pressure.
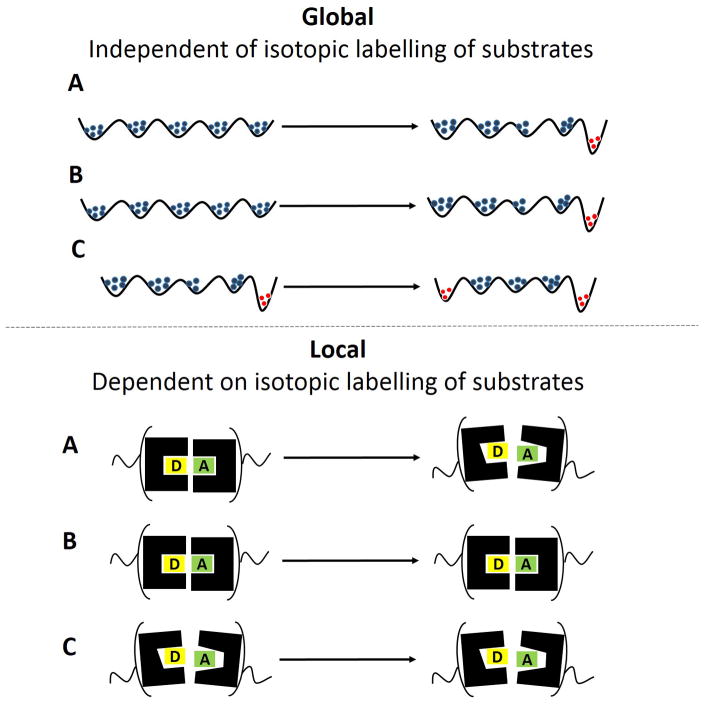
The ability to demonstrate a clear cut distinction between local and global effects, as seen herein with high pressure and SLO-1 (Figure 3B and 3C), is quite unique, with other perturbants of protein structure/dynamics, generating different patterns that connect changes in global conformational sampling with local active site distance sampling (Figure 3A). For example, non-physiological temperatures, and or active site mutants in ht-ADH and SLO-1 have previously been shown to alter both the overall protein conformational landscape and active-site packing (Figure 3A).[10,12,13] Even in earlier hydrostatic pressure studies involving the reductive half reactions of morphinone reductase (MR),[14a] pentaerythritol tetranitrate reductase (PETNR) [14b] and aromatic amine dehydrogenase (AADH), [9] a coupled impact was seen on local and global motions (Supporting Information 2.3). We attribute the present result with SLO-1 to its unique structure. As shown in Figure 1A, SLO-1 is a 94.4 kDa monomer with several unstructured loops on the surface and a buried active site. The surface region maybe influenced by pressure via a variety of changed intramolecular interactions, such as, disassociation of ion pairs, solvation of newly exposed hydrophilic residues, or an alteration of surface side chain conformers.[15] Unlike the unstructured surface region of SLO-1, the active site is within a densely packed hydrophobic core that consists mainly of α-helixes, which are relatively more resistant to pressure as a perturbant. [16]
Figure 3.
Different patterns that connect changes in local (top) to global motions (bottom) following the introduction of protein perturbants. In A, both the global energy landscape and the local distance sampling are altered. In B and C, the effects are uncoupled. The distinction between B and C is that (B) represents native SLO-1 while (C) represents SLO-1 variants for which protein have already been altered by mutagenesis.
The finding that both Ea and AH are elevated simultaneously without a substantial drop in rate under high pressure. is highly analogous to the trends previously reported for ht-ADH[13] and the pair L754A vs. I553A/L754A in SLO-1.[12] A fundamental pattern is emerging for enzymes, in which either non-physiological temperatures (e.g. ht-ADH), mutagenesis (eg. ht-ADH and SLO-1), or high pressure (current study) produce an increased population of low activity or inactive conformers within the conformational landscape. In the current case, we propose that experimental observations of elevations in Ea following pressure perturbation can be seen as measures of the (additional) thermal fluctuation required to restore a homeostatic distribution of optimally active protein sub-states from the low activity or inactive conformers.
In the present study, we have engaged high pressure as an alternate way to address the functional role of the protein conformational landscape. Although SLO-1 is, thus far, unique in its ability to provide a separation of the two classes of (local and global) motions, the findings have general relevance to our understanding of the factors that govern catalysis. The observed elevation of Ea together with an unaltered ΔEa uncovers and corroborates change in Ea as an indicator of impaired conformational landscapes within enzyme-substrate complexes. Unlike the pressure-induced conformational shifting in protein folding or ligand binding that is often studied by biophysical tools,[11] the differences among sub-conformers in the enzyme-substrate (E·S) conformational landscape is very subtle and difficult to correlate with catalytic efficiency. Our current study validates enzymatic kinetic studies combined with hydrostatic pressure techniques as a sensitive probe for detecting the shifting in the E·S conformational landscape that is considered critical for optimal catalysis. The pressure-temperature variation in the enzymatic kinetics of WT, I553V and L546A may further provide a set of experimental parameters that can be used to incorporate global protein conformational sampling into current mathematical models for non-adiabatic deep tunneling of hydrogen.[7] Finally, we suggest that these studies, which validate the concept of remote tuning of catalytic efficiency, should be considered in future design studies of biocatalysts.[17]
Supplementary Material
Acknowledgments
This work was supported by a grant from National Institutes of Health (GM025765 to J. P. K.). All data and discussion supporting this study are provided in the supplementary material accompanying this paper. We thank Dr. Adam Offenbacher, Dr. Ian Barr, Dr. Hui Zhu and Dr. Marcus Carr for valuable discussions.
Footnotes
Supporting information for this article is given via a link at the end of the document.((Please delete this text if not appropriate))
Contributor Information
Dr. Shenshen Hu, Department of Chemistry, University of California, California Institute for Quantitative Biosciences, University of California, Berkeley California 94720, United States
Jérôme Cattin-Ortolá, Department of Chemistry, University of California, California Institute for Quantitative Biosciences, University of California, Berkeley California 94720, United States.
Dr. Jeffrey W. Munos, Department of Chemistry, University of California, California Institute for Quantitative Biosciences, University of California, Berkeley California 94720, United States
Prof. Dr. Judith P. Klinman, Email: klinman@berkeley.edu, Department of Chemistry, University of California, California Institute for Quantitative Biosciences, University of California, Berkeley California 94720, United States. Department of Molecular and Cell Biology, University of California, Berkeley, California 94720, United States
References
- 1.a) Hammes-Schiffer S, Benkovic SJ. Annu Rev Biochem. 2006;75:519–541. doi: 10.1146/annurev.biochem.75.103004.142800. [DOI] [PubMed] [Google Scholar]; b) Klinman JP. Acc Chem Res. 2015;48:449–456. doi: 10.1021/ar5003347. [DOI] [PMC free article] [PubMed] [Google Scholar]; c) Schwartz S, Schramm VL. Nat Chem Biol. 2009;5:551–558. doi: 10.1038/nchembio.202. [DOI] [PMC free article] [PubMed] [Google Scholar]
- 2.Nestle BM, Hauer B. ACS Catal. 2014;4:3201–3211. [Google Scholar]
- 3.a) Nagel ZD, Klinman JP. Nat Chem Biol. 2009;5:543–550. doi: 10.1038/nchembio.204. [DOI] [PubMed] [Google Scholar]; b) Świderek K, Tuñón I, Martí S, Moliner V. ACS Catal. 2015;5:1172–1185. doi: 10.1021/cs501704f. [DOI] [PMC free article] [PubMed] [Google Scholar]; c) Keedy DA, et al. eLife. 2015;4:e07574. [Google Scholar]
- 4.a) Henzler-Wildman KA, Lei M, Thai V, Kerns SJ, Karplus M, Kern D. Nature. 2007;450:913–916. doi: 10.1038/nature06407. [DOI] [PubMed] [Google Scholar]; b) Meadows CW, Balakrishnan G, Lier BL, Spiro TG, Klinman JP. J Am Chem Soc. 2015;137:10060–10063. doi: 10.1021/jacs.5b04413. [DOI] [PMC free article] [PubMed] [Google Scholar]; c) Klepeis JL, Lindorff-Larsen K, Dror RO, Shaw DE. Curr Opin Struc Biol. 2009;19:120–127. doi: 10.1016/j.sbi.2009.03.004. [DOI] [PubMed] [Google Scholar]; d) Yang H, Luo G, Karnchanaphanurach P, Louie TM, Rech I, Cova S, Xun L, Xie XS. Science. 2003;302:262–266. doi: 10.1126/science.1086911. [DOI] [PubMed] [Google Scholar]
- 5.a) Singh P, Francis K, Kohen A. ACS Catal. 2015;5:3067–3073. doi: 10.1021/acscatal.5b00331. [DOI] [PMC free article] [PubMed] [Google Scholar]; b) Van Den Bedem H, Bhabha G, Yang K, Wright PE, Fraser JS. Nature Methods. 2013;10:896–902. doi: 10.1038/nmeth.2592. [DOI] [PMC free article] [PubMed] [Google Scholar]; c) Meadows CW, Tsang JE, Klinman JP. J Am Chem Soc. 2014;136:14821–14833. doi: 10.1021/ja506667k. [DOI] [PMC free article] [PubMed] [Google Scholar]
- 6.a) Klinman JP. Biochemistry. 2013;52:2068–2077. doi: 10.1021/bi301504m. [DOI] [PMC free article] [PubMed] [Google Scholar]; b) Knapp MJ, Rickert K, Klinman JP. J Am Chem Soc. 2002;124:3865–3874. doi: 10.1021/ja012205t. [DOI] [PubMed] [Google Scholar]; c) Meyer MP, Tomchick DR, Klinman JP. Proc Natl Acad Sci USA. 2008;105:1146–1151. 19562. doi: 10.1073/pnas.0710643105. (correction) [DOI] [PMC free article] [PubMed] [Google Scholar]; d) Hu S, Sharma SC, Scouras AD, Scoudackov AV, Carr CAM, Hammes-Schiffer S, Alber T, Klinman JP. J Am Chem Soc. 2014;136:8157–8160. doi: 10.1021/ja502726s. [DOI] [PMC free article] [PubMed] [Google Scholar]
- 7.a) Hatcher E, Soudackov AV, Hammes-Schiffer S. J Am Chem Soc. 2007;129:187–196. doi: 10.1021/ja0667211. [DOI] [PubMed] [Google Scholar]; b) Soudackov AV, Hammes-Schiffer S. J Chem Phys. 2015;143:194101–194112. doi: 10.1063/1.4935045. [DOI] [PMC free article] [PubMed] [Google Scholar]
- 8.Klinman JP. Chem Phys Letters. 2009;471:179–193. doi: 10.1016/j.cplett.2009.01.038. [DOI] [PMC free article] [PubMed] [Google Scholar]
- 9.Hay S, Johannissen LO, Hothi P, Sutcliffe MJ, Scrutton NS. J Am Chem Soc. 2012;134:9749–9754. doi: 10.1021/ja3024115. [DOI] [PubMed] [Google Scholar]
- 10.Nagel ZD, Dong M, Bahnson B, Klinman JP. Proc Natl Acad Sci USA. 2011;108:10520–10525. doi: 10.1073/pnas.1104989108. [DOI] [PMC free article] [PubMed] [Google Scholar]
- 11.a) Kitahara R, Akasak K. Proc Natl Acad Sci USA. 2003;100:3167–3172. doi: 10.1073/pnas.0630309100. [DOI] [PMC free article] [PubMed] [Google Scholar]; b) Kamatari YO, Smith LJ, Dobson CM, Akasak K. Biophys Chem. 2011;156:24–30. doi: 10.1016/j.bpc.2011.01.009. [DOI] [PubMed] [Google Scholar]; c) Kapoor S, Triola G, Vetter IR, Erlkamp M, Waldmann H, Winter R. Proc Natl Acad Sci USA. 2011;109:460–465. doi: 10.1073/pnas.1110553109. [DOI] [PMC free article] [PubMed] [Google Scholar]
- 12.Sharma SC, Klinman JP. Biochemsitry. 2015;54:5447–5456. doi: 10.1021/acs.biochem.5b00374. [DOI] [PMC free article] [PubMed] [Google Scholar]
- 13.Nagel ZD, Meadows CW, Dong M, Bahnson BJ, Klinman JP. Biochemistry. 2012;51:4147–4156. doi: 10.1021/bi3001352. [DOI] [PMC free article] [PubMed] [Google Scholar]
- 14.a) Hay S, Sutcliffe MJ, Scrutton NP. Proc Natl Acad Sci USA. 2007;104:507–512. doi: 10.1073/pnas.0608408104. [DOI] [PMC free article] [PubMed] [Google Scholar]; b) Pudney CR, Hay S, Levy SC, Pang J, Scucliffe MJ, Leys D, Scrutton NS. J Am Chem Soc. 2009;131:17072–17073. doi: 10.1021/ja908469m. [DOI] [PubMed] [Google Scholar]
- 15.a) Boonyaratanakornkit BB, Park CB, Clark DS. Biochim Biophys Acta. 2002;1595:235–249. doi: 10.1016/s0167-4838(01)00347-8. [DOI] [PubMed] [Google Scholar]; b) Jaenicke R. Annu Rev Biphys Bioeng. 1981;10:1–67. doi: 10.1146/annurev.bb.10.060181.000245. [DOI] [PubMed] [Google Scholar]
- 16.Kundrot CE, Richards FM. J Mol Biol. 1987;193:157–170. doi: 10.1016/0022-2836(87)90634-6. [DOI] [PubMed] [Google Scholar]
- 17.Hammes-Schiffer S, Klinman JP. Acc Chem Res. 2015;48:899. doi: 10.1021/acs.accounts.5b00113. [DOI] [PubMed] [Google Scholar]
Associated Data
This section collects any data citations, data availability statements, or supplementary materials included in this article.


