. 2016 Aug 20;5:e17877. doi: 10.7554/eLife.17877

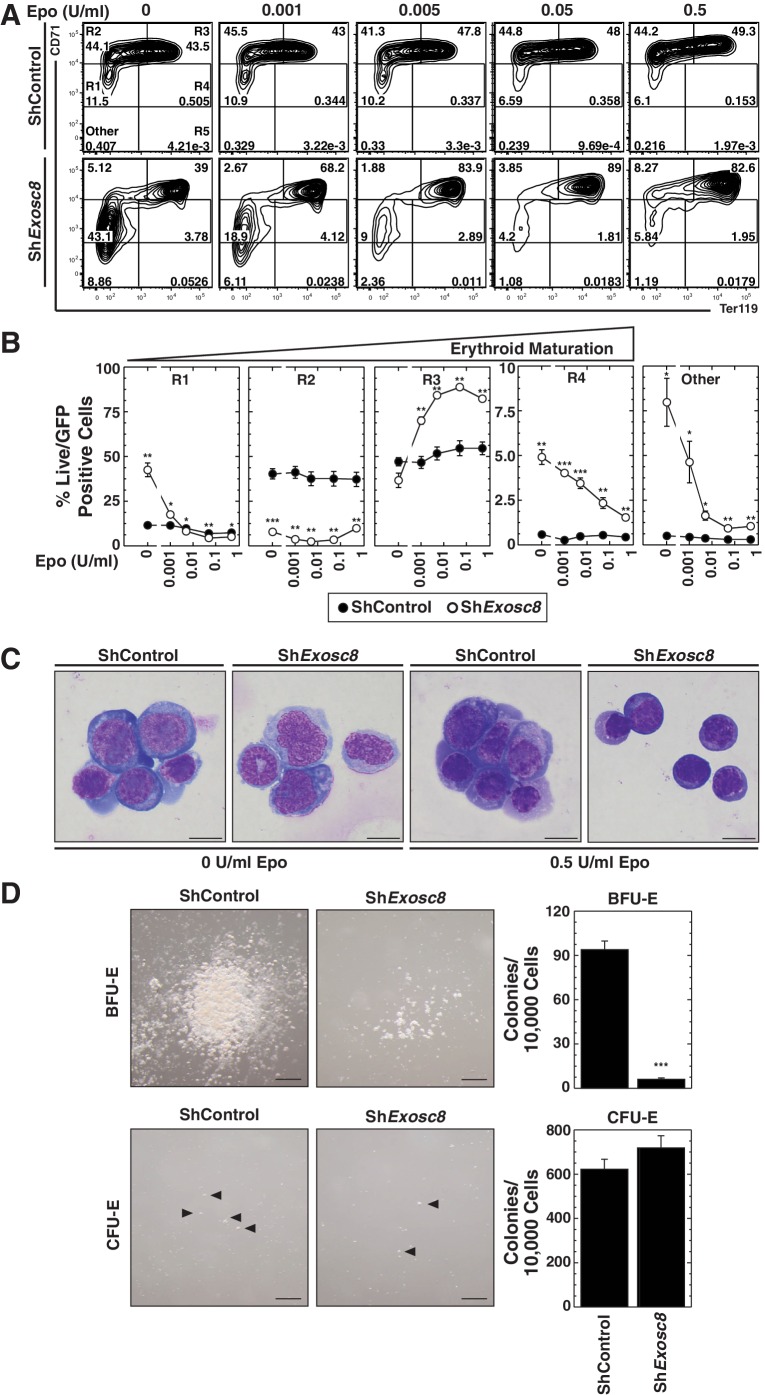
Figure 3. Erythropoietin is required for erythroid differentiation induced by disrupting the exosome complex.

(A) Flow cytometric quantification of erythroid markers CD71 and Ter119 in live control and Exosc8-knockdown erythroid precursor cells cultured for 48 hr in Epo-limiting media. Representative plots with R1-R5 gates denoted. (B) Quantitation of the percentage of live cells in control and Exosc8-knockdown conditions from the R1-R4 and non erythroid gates (mean ± SE, 4 biological replicates). (C) Representative images of Wright-Giemsa-stained, DRAQ7-negative erythroid precursor cells, infected with control or ShExosc8 retrovirus. Cells were cultured with or without Epo for 48 hr (Scale bar, 10 μm). (D) Representative images (left) and quantitation (right) of erythroid colony forming unit activity with FACS-sorted R1 cells 24 hr after Exosc8 knockdown (mean ± SE, 6 biological replicates) (Scale bar 200 μm). Statistical analysis of control and treatment conditions was conducted with the Student’s T-test. *p<0.05, **p<0.01, ***p<0.001. Source data is available in Figure 3—source data 1.

DOI: http://dx.doi.org/10.7554/eLife.17877.008

Figure 3—source data 1. This Excel spreadsheet contains the values for each biological replicate for data presented as either line graphs or histograms (mean ± SE) in Figure 3.
Sheet 1: Figure 3B the percent live cells found in the R1, R2, R3, R4 and R5 flow cytometry gates in control and Exosc8 knockdown cells after 48 hr culture in Epo-limiting conditions. Sheet 2: Figure 3D the CFU-E and BFU-E counts from colony assays performed after 24 hr infection with shExosc8.
DOI: 10.7554/eLife.17877.009

Figure 3.

Figure 3—figure supplement 1. Analysis of the exosome complex-mediated erythroid maturation barricade using a distinct flow cytometric assay.

Figure 3—figure supplement 1.

(A) Erythroid maturation of primary erythroid precursor cells 72 hr post-infection with shExosc8- or shExosc9-expressing retroviruses analyzed by flow cytometric quantification of CD44 and side scatter (SSC). Representative flow cytometry plots with gates I to VI are depicted. (B) Percentage of erythroid cells detected in gates I through VI (3 biological replicates, mean ± SE). (C) Representative images of Wright-Giemsa-stained erythroid cells from the sorted, gated (I-IV) populations under control conditions (Scale bar, 10 μm). Statistical analysis of control and treatment conditions was conducted with the Student’s T-test. *p<0.05, **p<0.01, ***p<0.001.