Abstract
Apple pomace is a by-product of the processing of apple for juice, cider or wine preparation. Rosemary is a herb commonly used as spice and flavoring agent in food processing. Evidence suggests that both apple pomace and rosemary have rich bioactive molecules with numerous metabolic effects. To provide more information for using apple pomace and rosemary as functional foods for management of metabolism-associated disorders, the present study investigated the insulin-sensitizing effect of a mixture of apple pomace and rosemary extract (AR). The results showed that treatment with AR (500 mg/kg, daily, by gavage) for 5 weeks attenuated chronic liquid fructose consumption-induced increases in fasting plasma insulin concentration, the homeostasis model assessment of insulin resistance index and the adipose tissue insulin resistance index in rats. Mechanistically, AR suppressed fructose-induced acceleration of the clearance of plasma non-esterified fatty acids during oral glucose tolerance test, and decreased excessive triglyceride accumulation and the increased Oil Red O staining area in the gastrocnemius. Furthermore, AR restored fructose-induced overexpression of sarcolemmal CD36 that is known to contribute to etiology of insulin resistance by facilitating fatty acid uptake, and downregulation of sarcolemmal glucose transporter (GLUT)-4 that is the insulin-responsive glucose transporter. Thus, these results demonstrate that AR improves fructose-induced insulin resistance in rats via modulation of sarcolemmal CD36 and GLUT-4.
Keywords: Apple pomace, CD36, GLUT-4, insulin resistance, rosemary, skeletal muscle
Introduction
The metabolic syndrome (obesity, insulin resistance, dyslipidemia and hypertension) is associated with development of numerous disorders, such as diabetes, nonalcoholic fatty liver disease, and cardiovascular diseases [1]. Insulin resistance is the key component of the metabolic syndrome.
Apple is one of the most favorite fruits in the world. Based on the report by the Food and Agriculture Organization of the United Nations Statistics Division, the total world apple production for 2012 was 76,378,700 tons, of which China produced 37,001,601 tons (https://en.wikipedia.org/wiki/List of countries by apple production). Current clinical, in vitro, and in vivo data suggest that exposure to apples and apple products is associated with beneficial effects on risk, markers, and etiology of cancer, cardiovascular disease, asthma, and Alzheimer’s disease, and also with improved outcomes related to cognitive decline of normal aging, diabetes, weight management, bone health, pulmonary function, and gastrointestinal protection [2]. Apple pomace is a by-product of the processing of apple for juice, cider or wine preparation. Generally, apple pomace has been thrown away, which causes environmental pollution. However, apple pomace is a precious resource because it contains rich bioactive molecules. Apple pomace has been demonstrated to improve lipid profiles in obese rats [3] and endurance in exercise performance in mice [4]. Furthermore, acute ingestion of apple pomace has been found to improve glucose metabolism in the oral glucose tolerance test (OGTT) in healthy volunteers [5]. On the other hand, rosemary, an aromatic evergreen shrub grown in many parts of the world, is commonly used as spice and flavoring agents in food processing. It has been demonstrated that rosemary also regulates glucose and lipid metabolism in diabetic animals [6-10]. These findings suggest that both apple pomace and rosemary may improve metabolic abnormalities. However, their underlying mechanisms of action are still largely unclear.
Chronically high consumption of fructose is associated with numerous metabolic abnormalities, such as obesity, insulin resistance, fatty liver and dyslipidemia [9]. To provide information for using apple pomace and rosemary as functional foods for management of insulin resistance-associated disorders, the present study examined the effects of a mixture of apple pomace and rosemary extract (AR) on insulin resistance induced by long-term excessive liquid fructose consumption.
Materials and methods
Preparation of AR and quantification of ursolic acid (UA) in AR
Fresh apple (Malus pumila var. domestica) was purchased from Aomori County, Japan. Apple pomace was produced after the free run juice is poured off, and dried below 50°C. Rosemary (Rosmarinus officinalis) extract was purchased from SAMI LABS LIMITED, Bangalore India (Lot No: C131509E). AR was made of apple pomace and rosemary extract at the ratio of 10:1. Because UA is one of the prominent active components contained in both apple pomace and rosemary [10], we determined UA content in the mixture as a quality control. The mixture was extracted with methanol, and quantified by a HPLC method to contain 5.5% UA. HPLC fingerprints of AR and UA standard (Wako, Osaka, Japan) (inset) at 210 nmUV are shown in Figure 1.
Figure 1.
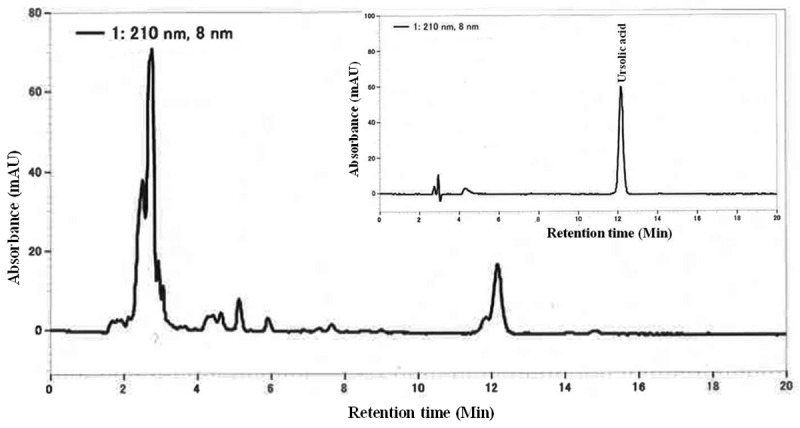
HPLC fingerprints of the mixture of apple pomace and rosemary extract (AR) and ursolic acid standard (inset) at 210 nmUV.
Animals, diet and experimental protocol
All experimental procedures were carried out in accordance with the internationally accepted principles for laboratory animal use and care, and approved by the Animal Ethics Committee, Chongqing Medical University, China (02/03/2015, No: 2015007).
Male Sprague-Dawley rats (210-230 g) and the standard chow were supplied by the laboratory animal center, Chongqing Medical University, China. Rats were housed in the Specific Pathogen Free (SPF) facility (21±1°C, 55±5% relative humidity, a 12-h light/dark cycle). Animals were allowed free access to water and the standard chow for at least 1 week prior to starting the experiments.
The animal model used for the present study was made as described previously [11-15]. Thirty-three rats were divided initially into 2 groups: water controls (n=6) given free access to water, and fructose group (n=27) in which rats had free access to 10% fructose solution (w/v, preparation every day) for 13 weeks. The fructose group was divided into the following 3 groups (n=9 each) during the last 5 weeks: fructose control (AR 0 mg/kg), fructose AR 100 mg/kg and fructose AR 500 mg/kg. Animals in AR-treated groups were administered AR at the dosages of 100 and 500 mg/kg (suspended in 5% Gum Arabic, gavage once daily), respectively. The rats in the corresponding water- and fructose-control groups received vehicle (5% Gum Arabic) alone. All rats had free access to the standard chow. To avoid stress and increase monitoring accuracy of fructose and chow intakes, only 3 rats were housed in a cage at any given time. The consumed chow and fructose solution were measured daily and the intake of fructose was calculated. Blood samples were collected under ether anesthesia under overnight-fasted condition 4 weeks after treatment with vehicle or AR. Here, the plasma concentrations of glucose (kit from Kexin Institute of Biotechnology, Shanghai, China), insulin (kit from Morinaga Biochemical Industries, Tokyo, Japan), triglyceride (Triglyceride-E kit, Wako, Osaka, Japan), non-esterified fatty acids (NEFA) (NEFA-C kit, Wako, Osaka, Japan) and total cholesterol (kit from Kexin Institute of Biotechnology, Shanghai, China) were determined using enzymatic methods or by ELISA. Immediately followed, OGTT was performed. Animals were weighed and euthanized after being fasted overnight at the endpoint of the treatments. Epididymal and peri-renal fats, and gastrocnemius (right) were collected. Segments of gastrocnemius were individually snap frozen in liquid nitrogen and stored at -80°C for subsequent determination of the content of triglyceride and/or gene expression.
OGTT
All overnight-fasted rats received a glucose solution (2 g/kg, p.o.). Blood samples were collected prior to and 20, 60 and 120 min after glucose administration. Plasma glucose and NEFA concentrations were determined. The homeostasis model assessment of insulin resistance (HOMA-IR) index {[fasting insulin (μIU/mL) × fasting glucose (mM)]/22.5} and the Adipo-IR index [Adipo-IR index = fasting insulin (mmol/L) × fasting NEFA (pmol/L)] were calculated [16]. The clearance of plasma NEFA was calculated using the following formula: the concentration under fasting condition (baseline) -the concentration at the time-point (20, 60 or 120 min) after glucose administration. The area under the curve (AUC) of plasma concentrations and/or clearances of NEFA were calculated.
Determination of muscular triglyceride content
Triglyceride content in the gastrocnemius was determined as described previously [13,16]. Briefly, 100 mg of tissue was homogenized and extracted with 2 mL of isopropanol. After centrifugation (3000 rpm), the triglyceride content in supernatant was determined (Wako, Osaka, Japan).
Measurement of muscular fatty droplet accumulation
Frozen gastrocnemius was cut into six-micron sections, and stained with Oil Red O. Fatty droplet accumulation was examined under microscope (BX-51, Olympus Corporation, Tokyo, Japan). Forty fields in individual section were randomly selected, and the Oil Red O-stained and total fiber areas were measured using an ImageJ 1.43 analyzing system. The ratio of the Oil Red O-stained area to the total fiber area was calculated (%).
Real time PCR
Real time PCR described previously [15] was used to determine mRNA expression. Total RNA was isolated from gastrocnemius of individual rats using TRIzol (Takara, Dalian, China). cDNA was synthesized using M-MLV RTase cDNA Synthesis Kit (Takara, Dalian, China) according to the manufacturer’s instructions. Real time PCR was performed with the CFX 96 Real Time PCR Detection System (Biorad Laboratories Inc, Hercules, CA, USA) using the SYBR® Premix Ex Taq™ II (Takara, Dalian, China). The sequences of primers are as follows: β-actin: forward: ACGGTCAGGTCATCACTATCG and reverse: GGCATAGAGGTCTTTACGGATG (Accession number: NM_031144.2); CD36: forward: AACCCAGAGGAAGTGGCAAAG and reverse: GACAGTGAAGGCTCAAAGATGG (Accession number: NM_001109218); and glucose transporter (GLUT)-4: forward: CTTCCGTTTCTCATCCTTCAGC and reverse: GATACCTCTACATCATCC (Accession number: NM_012751.1). The gene expression from each sample was analysed in duplicates and normalized against the internal control gene β-actin. Levels in control rats were arbitrarily assigned a value of 1.
Western blot
Western blot was performed basically as described previously [12,15]. Proteins were prepared from gastrocnemius using the T-PER tissue protein extraction reagent kits (Pierce Biotechnology, Rockford, IL, USA) according to the manufacturer’s instructions. Protein concentration was determined using the Bradford method (Bio Rad Laboratories, Hercules, CA, USA) using bovine serum albumin as a standard. Protein (30 μg) was subjected to SDS-PAGE analysis on a 10% gel, then electrotransferred onto Polyvinylidene Fluoride Membrane (Amersham, Buckinghamshire, UK). CD36 (dilution 1:1000, Abcam, Cambridge, Massachusetts, USA) and GLUT4 (dilution 1:500, Santa Cruz Biotechnology, Santa Cruz, CA, USA) were detected with a rabbit polyclonal antibody. Detection of signals was performed using the ECL Western blot detection kit (Pierce Biotechnology, Rockford, IL, USA) with anti-rabbit horseradish peroxidase-conjugated IgG (dilution 1:5,000, Santa Cruz Biotechnology, Santa Cruz, CA, USA) as second antibody. Polyclonal rabbit GAPDH antibody (dilution 1:10,000, Cell Signaling Technologies, Beverly, MA, USA) was used as loading control to normalize the signal obtained for CD36 or GLUT-4 protein. The immunoreactive bands were visualized by autoradiography and the density was evaluated using ImageJ 1.43. Levels in control rats were arbitrarily assigned a value of 1.
Immunofluorescence staining
To examine the distribution of CD36 and GLUT-4 in skeletal muscle fibers, cryosections were immunofluorescently labeled and analyzed by fluorescence microscopy. Transverse cryosections from gastrocnemius were transferred to glass slides, and allowed to dry at room temperature. The sections were blocked with normal goat serum for 30 min and incubated with rabbit polyclonal anti-CD36 antibody (dilution 1:200, Abcam, Cambridge, Massachusetts, USA) and anti-GLUT-4 (dilution 1:50, Santa Cruz Biotechnology, Santa Cruz, CA, USA) in blocking buffer at 4°C overnight. Sections were rinsed with PBS three times and incubated with CY3-labeled goat anti-rabbit IgG as secondary antibody in blocking buffer for 30 min. Sections were rinsed with PBS three times again and nuclei were counterstained with DAPI (Molecular Probes/Invitrogen Life Technologies, Carlsbad, CA, USA). Finally, sections were mounted and analyzed. Images were collected with fluorescent microscope (NIKON TE2000-U, Nikon Corporation, Tokyo, Japan). Imaging settings were set so that no signal was detected in the respective negative controls and a low fraction of pixels showed saturation intensity values when imaging the stained samples. The fluorescence intensity of the sarcolemmal CD36 and GLUT-4 fluorescent signal of skeletal muscle fiber was quantified by Image Pro Plus 5.1. ~100 fibers were rated each sample. Levels in control rats were arbitrarily assigned a value of 1.
Data analysis
All data are expressed as mean ± SEM. Data were analyzed by ANOVA using StatView, and followed by Student-Newman-Keuls testing to locate the differences between groups. P<0.05 was considered to be statistically significant.
Results
Effects on intakes of fructose and chow, body weight and fat mass in rats
Fructose intake in all fructose-consumed groups was similar (Supplementary Table 1). Further, these groups showed decrease in chow intake, compared to water control, Supplementary Table 1). There was no significant difference in body weight between water control and fructose control or fructose AR groups (Supplementary Table 1). However, long term fructose consumption increased epididymal and perirenal fat weight; treatment with AR was without effect on it (Supplementary Table 1).
Effects on glucose metabolism in rats
Although plasma glucose concentrations at the baseline (Figure 2A) and in OGTT (Figure 2D) were not altered, fasting plasma insulin concentration (Figure 2B) and the HOMA-IR index (Figure 2C) were increased over three folds in fructose controls, compared to those in water controls. Treatment with AR at the dosage of 500 mg/kg significantly decreased fasting plasma glucose concentration (Figure 2A), but did not affect plasma glucose concentrations during OGTT (Figure 2D) in fructose-fed rats. Strikingly AR at 100 and 500 mg/kg suppressed the increases in fasting insulin concentration and the HOMA-IR index (Figure 2B and 2C).
Figure 2.
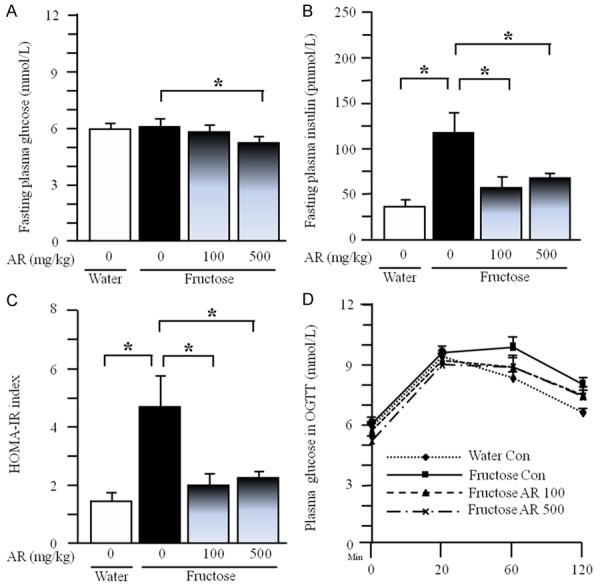
Plasma glucose (A) and insulin (B) concentrations under fasted condition, HOMA-IR index (C) and plasma glucose concentrations (D) in oral glucose tolerance test in rats. The fructose controls (AR 0 mg/kg) and fructose AR (100 and 500 mg/kg) groups had free access to 10% fructose in their drinking water over 13 weeks. The water controls (AR 0 mg/kg) had free access to a tap water. AR was administered by gavage daily during the last 5 weeks. The water and fructose controls received vehicle (5% Gum Arabic) alone. Data are means ± SEM (n=6-9 each group). *P<0.05.
Effects on lipid metabolism in rats
Under fasted condition, plasma total cholesterol concentration (Figure 3A) was unchanged, but plasma triglyceride (Figure 3B) and NEFA concentrations (Figure 3C) and the Adipo-IR index (Figure 3D) were significantly increased after long-term fructose consumption. AR treatment minimally affected the fasting plasma concentrations of total cholesterol, triglyceride and NEFA (Figure 3A-C) in fructose-fed rats. However, AR at dosages of 100 and 500 mg/kg suppressed the increased Adipo-IR index (Figure 3D).
Figure 3.
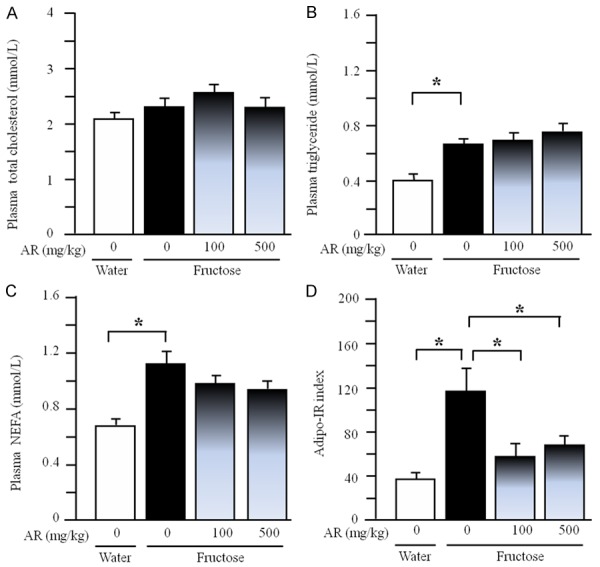
Plasma concentrations of total cholesterol (A), triglyceride (B) and NEFA (C) and Adipo-IR index (D) in rats. The fructose controls (AR 0 mg/kg) and fructose AR (100 and 500 mg/kg) groups had free access to 10% fructose in their drinking water over 13 weeks. The water controls (AR 0 mg/kg) had free access to a tap water. AR was administered by gavage daily during the last 5 weeks. The water and fructose controls received vehicle (5% Gum Arabic) alone. Data are means ± SEM (n=6-9 each group). *P<0.05.
Oral glucose administration potently decreased plasma NEFA concentration at 20-min point; there was no significant difference in plasma NEFA concentration (Figure 4A) and the AUC of plasma NEFA concentration (Figure 4B) in OGTT among water control, fructose control and fructose 500 mg/kg group. However, the clearance of plasma NEFA (Figure 4C) and the AUC of plasma NEFA clearance (Figure 4D) were increased in fructose controls compared to water controls. AR treatment significantly decreased the clearance of plasma NEFA (Figure 4C) and the AUC of plasma NEFA clearance (Figure 4D) in fructose-fed rats.
Figure 4.
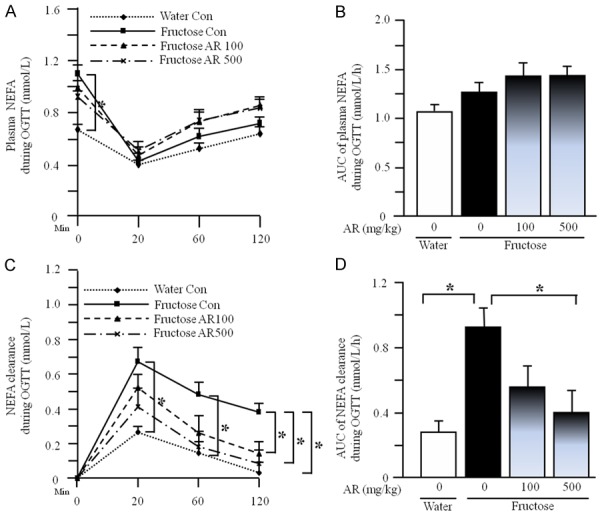
Plasma NEFA concentrations (A), the AUC of plasma NEFA concentrations (B), plasma NEFA clearance (C), and the AUC of plasma NEFA clearance (D) during OGTT in rats. The fructose controls (AR 0 mg/kg) and fructose AR (500 mg/kg) groups had free access to 10% fructose in their drinking water over 13 weeks. The water controls (AR 0 mg/kg) had free access to a tap water. AR was administered by gavage daily during the last 5 weeks. The water and fructose controls received vehicle (5% Gum Arabic) alone. Data are means ± SEM (n=6-9 each group). *P<0.05.
The quantifications showed no obvious difference in gastrocnemius weight between water control and fructose control or fructose AR groups (Figure 5A). However, long term fructose consumption increased triglyceride content (Figure 5B) and Oil Red O stained area (Figure 5C-E) in the gastrocnemius. AR at 500 mg/kg inhibited the increases in triglyceride content and Oil Red O staining area (Figure 5B, 5C and 5F).
Figure 5.
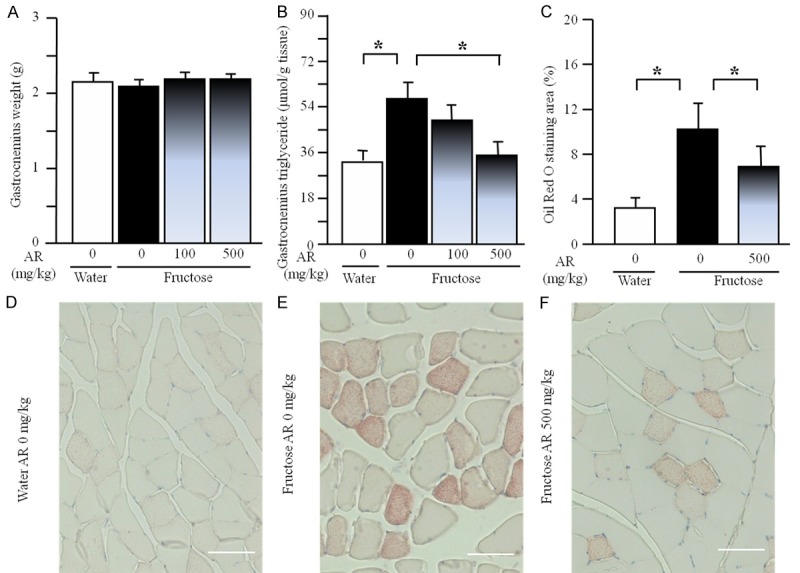
Gastrocnemius weight (A), triglyceride content (B), Oil Red O staining area (C) and representative images (Oil Red O staining, scale bars: 50 μm) (D-F) in rats. The fructose controls (AR 0 mg/kg) and fructose AR (100 and 500 mg/kg) groups had free access to 10% fructose in their drinking water over 13 weeks. The water controls (AR 0 mg/kg) had free access to a tap water. AR was administered by gavage daily during the last 5 weeks. The water and fructose controls received vehicle (5% Gum Arabic) alone. Data are means ± SEM (n=6-9 each group). *P<0.05.
Gene/protein expression profile in rats
Generally, treatment with AR at 500 mg/kg showed better metabolic effects than 100 mg/kg. We analyzed and compared gene expression in gastrocnemius among water control, fructose control and fructose AR 500 mg/kg groups.
By Real-time PCR and Western blot, fructose feeding did not significantly affect total muscular mRNA and protein expression of CD36 and GLUT-4; AR treatment was without effect in fructose-fed rats (Supplementary Figure 1A-D). By immunofluorescence staining, however, fructose feeding increased sarcolemmal CD36 expression, compared to water feeding (Figure 6A and 6B). In contrast, sarcolemmal GLUT-4 expression was significantly decreased after fructose consumption (Figure 6C and 6D). AR treatment reversed fructose-induced overexpressed sarcolemmal CD36 and downregulated sarcolemmal GLUT-4 expression in the skeletal muscle fibers (Figure 6A-D).
Figure 6.
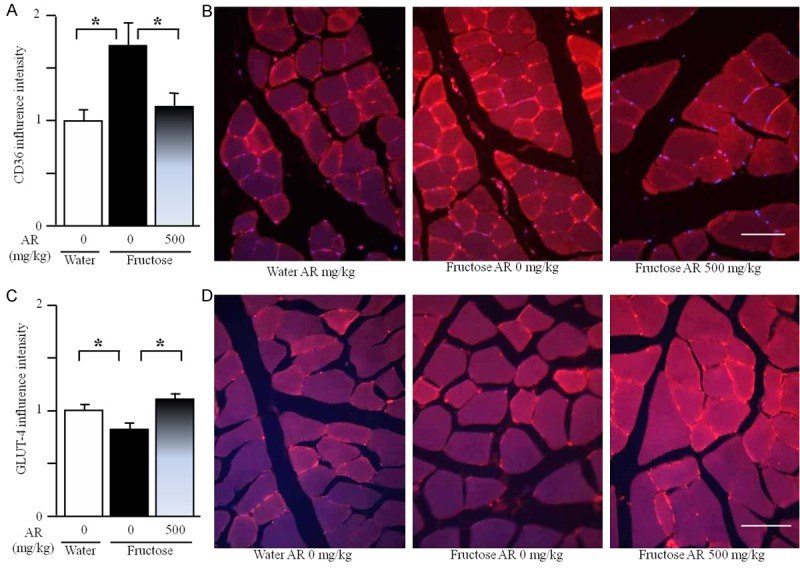
Expression of sarcolemmal CD36 (A) and GLUT-4 (C), representative images (immunofluorescence staining, B and D, scale bars: 50 μm) in the gastrocnemius of rats. The fructose controls (AR 0 mg/kg) and fructose AR (500 mg/kg) groups had free access to 10% fructose in their drinking water over 13 weeks. The water controls (AR 0 mg/kg) had free access to a tap water. AR was administered by gavage daily during the last 5 weeks. The water and fructose controls received vehicle (5% Gum Arabic) alone. After staining, the intensity of CD36 and GLUT-4 expression was determined using ImageJ 1.43. Levels in control rats were arbitrarily assigned a value of 1. Data are means ± SEM (n=6-9 each group). *P<0.05.
Discussion
The previous research findings have suggested that apple pomace [3,5] and rosemary [6-8] improve metabolic abnormalities. Insulin resistance plays a pivotal role in the development of metabolism-associated disorders. The present results clearly demonstrate that treatment with AR suppressed fructose-induced both hyperinsulinemia, and increases in the HOMA-IR index and the Adipo-IR index. Thus, these results support that AR treatment improves insulin resistance/hyperinsulinemia in rats.
It is known that restriction of energy intake may result in an increase in insulin sensitivity. Adipose tissue, liver and skeletal muscle are the main targets of insulin. Skeletal muscle is the major site of insulin resistance in obesity and type 2 diabetes [17]. Mounting evidence indicates that insulin resistance is closely associated with intramyocellular triglyceride overaccumulation [18]. Long-term high fructose diets cause insulin resistance [19] and triglyceride overaccumulation [20] in the skeletal muscle of rodents. It has been demonstrated that apple pomace extract improves endurance in exercise performance by increasing strength and weight of skeletal muscle [4]. Rosemary extract increases skeletal muscle glucose uptake [21]. In the present study, AR treatment was without significant effect on fructose and chow intakes, and fructose-induced adiposity. In contrast, fructose-induced increases in triglyceride accumulation and Oil Red O-stained area in the skeletal muscle of rats were diminished after treatment with AR. This diminishment was accompanied by improvement of insulin resistance. Thus, these results raise the possibility that skeletal muscle is one of the key target sites in AR treatment-elicited improvement of insulin resistance.
The increased muscular lipid deposition is secondary to increased fatty acid transport in obese Zucker rats [22], high fat-fed rats [23] and obese, insulin-resistant humans [24]. In muscle, increased plasma free fatty acids disrupt the glucose-fatty acid cycle [25]. The predominant defect in insulin action in skeletal muscle relates to an inhibitory effect of the increased plasma free fatty acids on insulin-mediated glucose transport [26]. Postprandial hyperinsulinemia is the most important physiological stimulus to enhance fatty acid uptake [27]. Thus, the clearance of plasma fatty acids in OGTT reflects the status of uptake of fatty acids by the key tissues, such as skeletal muscle. In the present study, long-term fructose consumption increased clearance of plasma NEFA during OGTT. This acceleration was attenuated by AR treatment. These results suggest that AR treatment may decrease fructose-induced excessive triglyceride accumulation in the skeletal muscle by inhibiting the increased uptake of fatty acids.
CD36, a multi-functional glycoprotein, facilitates a major fraction of fatty acid uptake by some key tissues, such as skeletal muscle, and plays an important role in membrane transport and utilization of long-chain fatty acids [28]. Enhancement of fatty acid uptake by postprandial hyperinsulinemia is mediated by induction of CD36 translocation [27]. CD36 may contribute to development of insulin resistance and the other key components of the metabolic syndrome [28,29]. In skeletal muscle from diabetic rodents and humans, more CD36 is recruited to the plasma membrane, leading to persistent enhancement of fatty acid uptake, thereby contributing to the impairment of insulin signaling and glucose utilization [30]. The increase in surface presence of CD36 is due to not increased expression, but a permanent relocation from its intracellular storage compartment. Fructose feeding has been demonstrated to increase CD36 expression in the sarcolemma, but not in whole muscular homogenates in rats [31]. Consistently, fructose consumption in the present study resulted in sarcolemmal CD36 overexpression, but it did not alter CD36 mRNA and protein expression in whole skeletal muscle. This overexpressed sarcolemmal CD36 was restored by AR treatment. Thus, these results suggest that AR treatment-elicited improvement of insulin resistance is associated with regulation of fatty acid uptake in the skeletal muscle through repair of the impaired sarcolemmal CD36 recycling.
Uptake of glucose by the muscle cell is via facilitated diffusion through GLUT-4. GLUT-4 is the main insulin-responsive glucose transporter and located primarily in muscle cells and adipocytes. Normally, GLUT-4 is recycled between the plasma membrane and intracellular storage pools [32]. In obesity and type 2 diabetes, however, GLUT-4 internalizes and is retained in intracellular depots, resulting in decreased expression in the plasma membrane, despite similar level of total availablity [33]. Excessive sarcolemmal content of CD36 correlated well with reduced insulin-stimulated GLUT-4 translocation and glucose uptake [34]. It has been demonstrated that UA increases glucose uptake in L6 muscle cells [35]. Furthermore, UA was found to increase the translocation of GLUT-4 from cytoplasm to cell membrane [36]. In the present study, fructose consumption did not affect total GLUT-4 mRNA and protein expression in skeletal muscle. However, it reduced plasma membrane GLUT-4 content. Treatment with AR did not alter muscular GLUT-4 mRNA and protein expression, but it completely restored the decreased plasma membrane GLUT-4 in fructose-fed rats. Thus, it appears that AR-elicited improvement of fructose-induced insulin resistance is also associated with repair of the impaired sarcolemmal GLUT-4 recycling.
UA (3β-hydroxy-urs-12-en-28-oic acid) is a natural pentacyclic triterpenoid carboxylic acid. It exists widely in natural plants in the form of free acid or aglycones for triterpenoid saponins. Pharmacological studies have indicated that UA has numerous beneficial effects, such as hepatoprotection, anti-oxidative stress, anti-inflammation, anticancer and anti-hyperlipidemia [37]. UA has been identified as an inhibitor of skeletal muscle atrophy, and daily UA consumption results in skeletal muscle hypertrophy [38]. UA was found to ameliorate aging-associated metabolic phenotypes through promotion of skeletal muscle rejuvenation [39], and to improve age-related skeletal muscle weakness and atrophy [40]. It has been demonstrated that the hexane extract of dry apple pomace or dry rosemary leaf contains 49.7% and 22.7% UA, respectively [10]. The mixture used in the present study contained 5.5% UA. To further elucidate the underlying mechanisms of metabolic action of AR and other UA-rich herbs, therefore, it needs to investigate the role of UA in AR-elicited improvement of insulin resistance in the future.
In conclusion, our present results demonstrate that treatment with a mixture of apple pomace and rosemary extract improves chronic fructose consumption-induced insulin resistance in rats via repair of the impaired sarcolemmal CD36 and GLUT-4 recycling. Our findings may provide important information for using apple pomace, a by-product, and rosemary as functional foods for prevention and treatment of metabolism-associated disorders.
Acknowledgements
This work was supported financially by the grants from the National Natural Science Foundation of China, China (Grant No: 81374033), the Natural Science Foundation of Chongqing Medical University, China (Grant No: X12100), and R&D Agency for Curative Natural Products (a Japanese government-registered non-profit organization), Kyoto, Japan.
Disclosure of conflict of interest
None.
Abbreviations
- Adipo-IR
Adipose tissue insulin resistance
- AR
Apple pomace and rosemary extract
- AUC
The area under the curve
- GLUT
Glucose transporter
- HOMA-IR
The homeostasis model assessment of insulin resistance
- NEFA
Non-esterified fatty acids
- OGTT
Oral glucose tolerance test
- UA
Ursolic acid
Supporting Information
References
- 1.Cornier MA, Dabelea D, Hernandez TL, Lindstrom RC, Steig AI, Stob NR, Van Pelt RE, Wang H, Eckel RH. The metabolic syndrome. Endocr Rev. 2008;29:777–822. doi: 10.1210/er.2008-0024. [DOI] [PMC free article] [PubMed] [Google Scholar]
- 2.Hyson DA. A comprehensive review of apples and apple components and their relationship to human health. Adv Nutr. 2001;2:408–420. doi: 10.3945/an.111.000513. [DOI] [PMC free article] [PubMed] [Google Scholar]
- 3.Cho KD, Han CK, Lee BH. Loss of body weight and fat and improved lipid profiles in obese rats fed apple pomace or apple juice concentrate. J Med Food. 2013;16:823–830. doi: 10.1089/jmf.2013.2784. [DOI] [PMC free article] [PubMed] [Google Scholar]
- 4.Jeong JW, Shim JJ, Choi ID, Kim SH, Ra J, Ku HK, Lee DE, Kim TY, Jeung W, Lee JH, Lee KW, Huh CS, Sim JH, Ahn YT. Apple pomace extract improves endurance in exercise performance by increasing strength and weight of skeletal muscle. J Med Food. 2015;18:1380–1386. doi: 10.1089/jmf.2014.3401. [DOI] [PubMed] [Google Scholar]
- 5.Makarova E, Górnaś P, Konrade I, Tirzite D, Cirule H, Gulbe A, Pugajeva I, Seglina D, Dambrova M. Acute anti-hyperglycaemic effects of anunripe apple preparation containing phlorizin in healthy volunteers: apreliminary study. J Sci Food Agr. 2015;95:560–568. doi: 10.1002/jsfa.6779. [DOI] [PubMed] [Google Scholar]
- 6.Bakirel T, Bakirel U, Keleş OU, Ulgen SG, Yardibi H. In vivo assessment of antidiabetic and antioxidant activities of rosemary (Rosmarinus officinalis) in alloxan-diabetic rabbits. J Ethnopharmacol. 2008;116:64–73. doi: 10.1016/j.jep.2007.10.039. [DOI] [PubMed] [Google Scholar]
- 7.Ramadan KS, Khalil OA, Danial EN, Alnahdi HS, Ayaz NO. Hypoglycemic and hepatoprotective activity of Rosmarinus officinalis extract in diabetic rats. J Physiol Biochem. 2013;69:779–783. doi: 10.1007/s13105-013-0253-8. [DOI] [PubMed] [Google Scholar]
- 8.Nazem F, Farhangi N, Neshat-Gharamaleki M. Beneficial effects of endurance exercise with rosmarinus officinalis labiatae leaves extract on blood antioxidant enzyme activities and lipid peroxidation in streptozotocin-induced diabetic rats. Can J Diabetes. 2015;39:229–234. doi: 10.1016/j.jcjd.2014.11.003. [DOI] [PubMed] [Google Scholar]
- 9.Tappy L, Le KA. Metabolic effects of fructose and the worldwide increase in obesity. Physiol Rev. 2010;90:23–46. doi: 10.1152/physrev.00019.2009. [DOI] [PubMed] [Google Scholar]
- 10.Jäger S, Trojan H, Kopp TM, Laszczyk N, Scheffler A. Pentacyclic triterpene distribution in various plants-rich sources for a new group of multi-potent plant extracts. Molecules. 2009;14:2016–2031. doi: 10.3390/molecules14062016. [DOI] [PMC free article] [PubMed] [Google Scholar]
- 11.Gao H, Guan T, Li C, Zuo G, Yamahara J, Wang J, Li Y. Treatment with ginger ameliorates fructose-induced Fatty liver and hypertriglyceridemia in rats: modulation of the hepatic carbohydrate response element-binding protein-mediated pathway. Evid Based Complement Alternat Med. 2012;2012:570948. doi: 10.1155/2012/570948. [DOI] [PMC free article] [PubMed] [Google Scholar]
- 12.Liu C, Li Y, Zuo G, Xu W, Gao H, Yang Y, Yamahara J, Wang J, Li Y. Oleanolic Acid diminishes liquid fructose-induced Fatty liver in rats: role of modulation of hepatic sterol regulatory element-binding protein-1c-mediated expression of genes responsible for de novo Fatty Acid synthesis. Evid Based Complement Alternat Med. 2013;2013:534084. doi: 10.1155/2013/534084. [DOI] [PMC free article] [PubMed] [Google Scholar]
- 13.Wang J, Gao H, Ke D, Zuo G, Yang Y, Yamahara J, Li Y. Improvement of liquid fructose-induced adipose tissue insulin resistance by ginger treatment in rats is associated with suppression of adipose macrophage-related proinflammatory cytokines. Evid Based Complement Alternat Med. 2013;2013:590376. doi: 10.1155/2013/590376. [DOI] [PMC free article] [PubMed] [Google Scholar]
- 14.Li Y, Wang J, Gu T, Yamahara J, Li Y. Oleanolic acid supplement attenuates liquid fructose-induced adipose tissue insulin resistance through the insulin receptor substrate-1/phosphatidylinositol 3-kinase/Akt signaling pathway in rats. Toxicol Appl Pharmacol. 2014;277:155–163. doi: 10.1016/j.taap.2014.03.016. [DOI] [PubMed] [Google Scholar]
- 15.Xing X, Li D, Chen D, Zhou L, Chonan R, Yamahara J, Wang J, Li Y. Mangiferin treatment inhibits hepatic expression of acyl-coenzyme A: diacylglycerol acyltransferase-2 in fructose-fed spontaneously hypertensive rats: a link to amelioration of fatty liver. Toxicol Appl Pharmacol. 2014;280:207–215. doi: 10.1016/j.taap.2014.08.001. [DOI] [PubMed] [Google Scholar]
- 16.Neuschwander-Tetri BA. Hepatic lipotoxicity and the pathogenesis of nonalcoholic steatohepatitis: the central role of nontriglyceride fatty acid metabolites. Hepatology. 2010;52:774–788. doi: 10.1002/hep.23719. [DOI] [PubMed] [Google Scholar]
- 17.Kelley DE, Goodpaster BH, Storlien L. Muscle triglyceride and insulin resistance. Annu Rev Nutr. 2002;22:325–346. doi: 10.1146/annurev.nutr.22.010402.102912. [DOI] [PubMed] [Google Scholar]
- 18.Machann J, Häring H, Schick F, Stumvoll M. Intramyocellular lipids and insulin resistance. Diabetes Obes Metab. 2004;6:239–248. doi: 10.1111/j.1462-8902.2004.00339.x. [DOI] [PubMed] [Google Scholar]
- 19.Storlien LH, Pan DA, Kusunoki M, Cooney GJ. Effects of benfluorex on in vivo patterns of insulin resistance induced by diets rich in fat or fructose. Diabetes Metab Rev. 1993;1:65S–72S. doi: 10.1002/dmr.5610090511. [DOI] [PubMed] [Google Scholar]
- 20.Song GY, Ren LP, Chen SC, Wang C, Liu N, Wei LM, Li F, Sun W, Peng LB, Tang Y. Similar changes in muscle lipid metabolism are induced by chronic high-fructose feeding and high-fat feeding in C57BL/J6 mice. Clin Exp Pharmacol Physiol. 2012;39:1011–1018. doi: 10.1111/1440-1681.12017. [DOI] [PubMed] [Google Scholar]
- 21.Naimi M, Tsakiridis T, Stamatatos TC, Alexandropoulos DI, Tsiani E. Increased skeletal muscle glucose uptake by rosemary extract through AMPK activation. Appl Physiol Nutr Metab. 2015;40:407–413. doi: 10.1139/apnm-2014-0430. [DOI] [PubMed] [Google Scholar]
- 22.Coort SL, Bonen A, van der Vusse GJ, Glatz JF, Luiken JJ. Cardiac substrate uptake and metabolism in obesity and type-2 diabetes: role of sarcolemmal substrate transporters. Mol Cell Biochem. 2007;299:5–18. doi: 10.1007/s11010-006-9372-7. [DOI] [PMC free article] [PubMed] [Google Scholar]
- 23.Ouwens DM, Diamant M, Fodor M, Habets DD, Pelsers MM, El Hasnaoui M, Dang ZC, van den Brom CE, Vlasblom R, Rietdijk A, Boer C, Coort SL, Glatz JF, Luiken JJ. Cardiac contractile dysfunction in insulin-resistant rats fed a high-fat diet is associated with elevated CD36-mediated fatty acid uptake and esterification. Diabetologia. 2007;50:1938–1948. doi: 10.1007/s00125-007-0735-8. [DOI] [PMC free article] [PubMed] [Google Scholar]
- 24.Bonen A, Parolin ML, Steinberg GR, Calles-Escandon J, Tandon NN, Glatz JF, Luiken JJ, Heigenhauser GJ, Dyck DJ. Triacylglycerol accumulation in human obesity and type 2 diabetes is associated with increased rates of skeletal muscle fatty acid transport and increased sarcolemmal FAT/CD36. FASEB J. 2004;18:1144–1146. doi: 10.1096/fj.03-1065fje. [DOI] [PubMed] [Google Scholar]
- 25.Schalch DS, Kipnis DM. Abnormalities in carbohydrate tolerance associated with elevated plasma nonesterified fatty acids. J Clin Invest. 1965;44:2010–2020. doi: 10.1172/JCI105308. [DOI] [PMC free article] [PubMed] [Google Scholar]
- 26.Roden M, Krssak M, Stingl H, Gruber S, Hofer A, Furnsinn C, Moser E, Waldhausl W. Rapid impairment of skeletal muscle glucose transport/phosphorylation by free fatty acids in humans. Diabetes. 1999;48:358–336. doi: 10.2337/diabetes.48.2.358. [DOI] [PubMed] [Google Scholar]
- 27.Glatz JF, Luiken JJ, Bonen A. Membrane fatty acid transporters as regulators of lipid metabolism: implications for metabolic disease. Physiol Rev. 2010;90:367–417. doi: 10.1152/physrev.00003.2009. [DOI] [PubMed] [Google Scholar]
- 28.Love-Gregory L, Abumrad NA. CD36 genetics and the metabolic complications of obesity. Curr Opin Clin Nutr Metab Care. 2011;14:527–534. doi: 10.1097/MCO.0b013e32834bbac9. [DOI] [PMC free article] [PubMed] [Google Scholar]
- 29.Su X, Abumrad NA. Cellular fatty acid uptake: a pathway under construction. Trends Endocrinol Metab. 2009;20:72–77. doi: 10.1016/j.tem.2008.11.001. [DOI] [PMC free article] [PubMed] [Google Scholar]
- 30.Schwenk RW, Luiken JJ, Bonen A, Glatz JF. Regulation of sarcolemmal glucose and fatty acid transporters in cardiac disease. Cardiovasc Res. 2008;79:249–258. doi: 10.1093/cvr/cvn116. [DOI] [PubMed] [Google Scholar]
- 31.Huynh M, Luiken JJ, Coumans W, Bell RC. Dietary fructose during the suckling period increases body weight and fatty acid uptake into skeletal muscle in adult rats. Obesity. 2008;16:1755–1762. doi: 10.1038/oby.2008.268. [DOI] [PubMed] [Google Scholar]
- 32.Shepherd PR, Kahn BB. Glucose transporters and insulin action-implications for insulin resistance and diabetes mellitus. N Engl J Med. 1999;341:248–257. doi: 10.1056/NEJM199907223410406. [DOI] [PubMed] [Google Scholar]
- 33.Goodyear LJ, Kahn BB. Exercise, glucose transport, and insulin sensitivity. Annu Rev Med. 1998;49:235–261. doi: 10.1146/annurev.med.49.1.235. [DOI] [PubMed] [Google Scholar]
- 34.Severson DL. Diabetic cardiomyopathy: recent evidence from mouse models of type 1 and type 2 diabetes. Can J Physiol Pharmacol. 2004;82:813–823. doi: 10.1139/y04-065. [DOI] [PubMed] [Google Scholar]
- 35.Lee MS, Thuong PT. Stimulation of glucose uptake by triterpenoids from Weigela subsessilis. Phytother Res. 2010;24:49–53. doi: 10.1002/ptr.2865. [DOI] [PubMed] [Google Scholar]
- 36.He Y, Li W, Li Y, Zhang S, Wang Y, Sun C. Ursolic acid increases glucose uptake through the PI3K signaling pathway in adipocytes. PLoS One. 2014;9:e110711. doi: 10.1371/journal.pone.0110711. [DOI] [PMC free article] [PubMed] [Google Scholar]
- 37.Liu J. Pharmacology of oleanolic acid and ursolic acid. J Ethnopharmacol. 1995;49:57–68. doi: 10.1016/0378-8741(95)90032-2. [DOI] [PubMed] [Google Scholar]
- 38.Kunkel SD, Suneja M, Ebert SM, Bongers KS, Fox DK, Malmberg SE, Alipour F, Shields RK, Adams CM. mRNA expression signatures of human skeletal muscle atrophy identify a natural compound that increases muscle mass. Cell Metab. 2011;13:627–638. doi: 10.1016/j.cmet.2011.03.020. [DOI] [PMC free article] [PubMed] [Google Scholar]
- 39.Bakhtiari N, Hosseinkhani S, Tashakor A, Hemmati R. Ursolic acid ameliorates aging-metabolic phenotype through promoting of skeletal muscle rejuvenation. Med Hypotheses. 2015;285:1–6. doi: 10.1016/j.mehy.2015.02.014. [DOI] [PubMed] [Google Scholar]
- 40.Ebert SM, Dyle MC, Bullard SA, Dierdorff JM, Murry DJ, Fox DK, Bongers KS, Lira VA, Meyerholz DK, Talley JJ, Adams CM. Identification and small molecule inhibition of an activating transcription factor 4 (ATF4)-dependent pathway to age-related skeletal muscle weakness and atrophy. J Biol Chem. 2015;290:25497–25511. doi: 10.1074/jbc.M115.681445. [DOI] [PMC free article] [PubMed] [Google Scholar]
Associated Data
This section collects any data citations, data availability statements, or supplementary materials included in this article.


