

Summary
Dendritic cells (DCs) are professional antigen-presenting cells that hold great therapeutic potential. Multiple DC subsets have been described, and it remains challenging to align them across tissues and species to analyze their function in the absence of macrophage contamination. Here, we provide and validate a universal toolbox for the automated identification of DCs through unsupervised analysis of conventional flow cytometry and mass cytometry data obtained from multiple mouse, macaque, and human tissues. The use of a minimal set of lineage-imprinted markers was sufficient to subdivide DCs into conventional type 1 (cDC1s), conventional type 2 (cDC2s), and plasmacytoid DCs (pDCs) across tissues and species. This way, a large number of additional markers can still be used to further characterize the heterogeneity of DCs across tissues and during inflammation. This framework represents the way forward to a universal, high-throughput, and standardized analysis of DC populations from mutant mice and human patients.
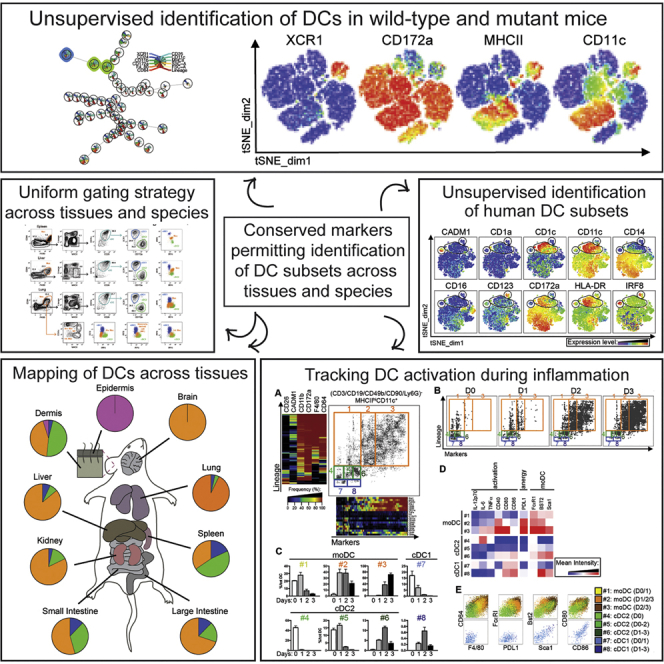
Graphical Abstract
Highlights
-
•
A conserved gating strategy aligns dendritic cells (DCs) in mouse and human tissues
-
•
Unsupervised computational analysis of flow cytometry data outperforms manual analysis
-
•
Mass cytometry reveals heterogeneity of DC subsets across mouse and human tissues
-
•
DC activation upon inflammation tracked by automated analysis of mass cytometry
Using unsupervised analysis of flow cytometry and mass cytometry data obtained from multiple mouse, macaque, and human tissues, Guilliams et al. provide a universal toolbox for the automated identification of dendritic cells. This framework represents the way forward to high-throughput and standardized analysis of dendritic cells from mutant mice and patients.
Introduction
Conventional dendritic cells (cDCs) are found in almost all tissues and lymph nodes (LNs) and act as sentinels capable of integrating multiple environmental signals and conveying them to CD4+ and CD8+ T lymphocytes. Plasmacytoid DCs (pDCs) produce type I interferons and can also develop into antigen-presenting cells, particularly when stimulated by virus or self DNA.
Human and mouse cDCs are derived from committed DC precursors (pre-cDCs) produced in the bone marrow (BM). These pre-cDCs migrate from the BM into the blood and then seed the various tissues where they develop into two distinct lineages of cDC. The existence of two distinct DC lineages is supported by the identification of lineage-defining transcription factors (TFs) required for development and/or function of cDC1 (IRF8, BATF3, ID2) and cDC2 (IRF4, ZEB2) (Breton et al., 2015, Grajales-Reyes et al., 2015, Guilliams et al., 2014, Lee et al., 2015, Naik et al., 2006, Schlitzer et al., 2015, Scott et al., 2016). A separate E2-2-dependent progenitor with prominent pDC potential has been recently described (Onai et al., 2013). With these recent molecular insights, it is now clear that cDCs belonging to the same lineage are present in various tissues and species; however, these have been historically characterized by different surface markers. Additionally, macrophages (Macs) have often contaminated cDC populations. This results from the fact that many murine Macs can express the prototypical cDC markers CD11c or MHCII and, conversely, that cDC2 can express the Mac marker F4/80 (Bain et al., 2012, Schlitzer et al., 2015, Scott et al., 2015, Tamoutounour et al., 2012, Tamoutounour et al., 2013). Distinguishing DCs from Macs in human tissues has been equally challenging (Collin et al., 2013, McGovern et al., 2015). Finally, the lack of conserved markers to identify DCs hampered communication between mouse and human experts and was detrimental for fostering translational medicine. The advent of multicolor flow cytometry only aggravated the matter by yielding a seemingly ever-growing list of DC subsets based on different marker combinations. Therefore, a rational approach simplifying the classification of DC subsets across tissues and species, yet still permitting the use of additional markers to study tissue- and disease-specific activation states, is urgently needed.
It was recently proposed to classify DCs based on their ontogeny before subdividing them based on their micro-anatomical location or specific functional specialization (Guilliams et al., 2014). This would yield only three subsets of DCs: conventional type 1 DCs (cDC1s), conventional type 2 DC (cDC2s), and pDCs. However, due to a lack of consensus regarding how to define DC subsets experimentally, such classification remains of limited practical use (Guilliams and van de Laar, 2015). Recent progress in the unsupervised analysis of high-dimensional flow cytometry datasets has rendered the identification process of cell subsets more objective and more reproducible (Saeys et al., 2016). However, a limitation of those approaches is that they give an equal weight to all the surface markers, not necessarily yielding the most biologically meaningful clusters. For instance, both Langerhans cells (LCs) and cDC1s express CD207, CD24, MHCII, and CD11c, but they have completely different localization, ontogeny, lifespan, and functional specialization (Malissen et al., 2014). Thus, the way forward has to be based on better markers to faithfully identify DC subsets alongside computational approaches that simplify the classification of DC subsets without compromising the multidimensional marker combinations necessary to grasp the fascinating functional heterogeneity of DCs.
Results
A Unique Gating Strategy Allows the Identification of cDC1s and cDC2s across Mouse Tissues
CD64 is highly expressed on Macs and can be used in combination with F4/80 to discriminate these cells from cDC2s (Bain et al., 2012, Gautier et al., 2012, Langlet et al., 2012, Plantinga et al., 2013, Schlitzer et al., 2013, Scott et al., 2015, Tamoutounour et al., 2013) (Figure 1A). Outgating Macs on the basis of their CD64+F4/80+ phenotype is essential to prevent them from contaminating the cDC2 gate in most tissues (Figure S1). As F4/80 is expressed on a part of the cDC2s, it should not be used alone to exclude Macs, as has been proposed (Gurka et al., 2015). CD3+ T cells, CD19+B220+ B cells, and NK1.1+ natural killer (NK) cells were next excluded from further analysis using a “lineage mix” and the remaining cells gated for expression of MHCII molecules (Lineage−MHCII+ cells). pDCs can be found among the lineage+ (Lin+) cells and identified as 120G8(CD317)+B220+CD11c+Ly6C+CD11b− cells (Figure S1). To obviate the fact that CD11c, a “classical” cDC marker, can be downregulated on DCs (Osorio et al., 2014) and is lowly expressed by the “double-negative” cDC2s found in the dermis (Tussiwand et al., 2015), CD26 was added as an additional cDC marker, since it is highly expressed on all mouse cDCs across tissues (see below). This permitted us to identify a well-defined population of CD11c+CD26+ cDC across tissues (Figure 1A, cyan gate) that can be further subdivided into XCR1hiCD172alo (dark blue gate) and XCR1loCD172ahi (green gate) cDCs.
Figure 1.

Identification of cDC1s and cDC2s across Mouse Tissues
(A) Representative flow cytometry plots showing identification of CD64hiF4/80hi macrophages (orange gate), CD11chiCD26hi cDC (cyan gate), XCR1hiCD172alo cDC1 (blue gate), and XCR1loCD172ahi cDC2 (green gate) in the spleen, liver, lung, small intestine, and large intestine of wild-type (WT) mice (flow panel see Table S1). Cells were pre-gated as single live CD45+ cells. Lung CD64hiF4/80hi macrophages were subdivided in CD11chi alveolar macrophages, MHCIIhiCD11chi monocyte-derived cells (MC), and MHCIIhiCD11clo interstitial macrophages.
(B) IRF8 and IRF4 expression of cDC1, cDC2, and macrophage (flow panel: see Table S2).
(C) Relative numbers of cDCs and macrophages among CD45+ cells in the indicated tissues of WT and Flt3l−/− mice. See Figure 2 for the gating strategy utilized in the skin.
(D) Competitive BM chimeric mice were generated by lethally irradiating CD45.1+CD45.2+ WT mice and reconstituting with a 50:50 mix of Batf3−/− or Irf4−/− CD45.2+ BM with WT CD45.1+ BM. The ratio between CD45.1+ and CD45.2+ is shown for cDC1s and cDC2s.
(E) Piecharts of the proportion of cDC1s, cDC2s, macrophages, and LC across mouse tissues. Data are representative of three (A, B, C, E) or two (D) independent experiments, with at least three mice per group (C, D). ∗ = p < 0.05.
Please see Figure S1 for the profile of macrophages from the distinct tissues, and for the identification of pDCs.
To validate that XCR1hiCD172alo and XCR1loCD172ahi cells corresponded to cDC1s and cDC2s, respectively, we relied on their differential expression on IRF8 and IRF4 (Murphy et al., 2015, Sichien et al., 2016). Analysis of the co-expression of both transcription factors (TFs) by intracellular staining revealed that XCR1hiCD172alo cDC1 and XCR1loCD172ahi cDC2 had an IRF8hiIRF4lo or IRF8loIRF4hi profile, respectively (Figure 1B), while Macs and pDCs had an IRF8intIRF4int or IRF8hiIRF4lo-int profile, respectively (Figure 1B and Figure S1). The pulmonary CD11c+MHCII+CD64+F4/80+CD172a+ monocyte-derived cells (often referred to as moDCs) also had an IRF8intIRF4int profile. As expected, cDCs were lacking in Flt3L−/− mice (Figure 1C) and competitive BM chimeras showed that cDC1 development was BATF3 dependent and IRF4 independent in all tissues analyzed (Figure 1D). cDC2s developed independently of BATF3, whereas they were IRF4 dependent particularly in the LNs. This likely reflects a late requirement for IRF4 in cDC2 survival (Persson et al., 2013, Schlitzer et al., 2013) and is consistent with the fact that IRF4 deficiency blocks the migration of dermal cDC2s to cutaneous LNs, but not their intradermal development (Bajaña et al., 2012). Therefore, the differential dependence on subset-defining TFs and growth factors validates the correct identification of cDC1s and cDC2s using just eight surface markers. Intracellular IRF4-IRF8 double staining can be further used to validate the correct assignment of cDC1s, cDC2s, pDCs, and Macs across tissues. Identifying cDC1s and cDC2s across tissues in parallel allowed us to analyze their relative abundance in all tissues (Figure 1E).
Inclusion of CD24 Permits the Separation of Langerhans Cells from Dermal cDC2s
The network of myeloid cells found in the mouse skin and cutaneous LNs is particularly complex to dissect due to the presence of LCs. LCs share many markers with cDCs (MHCII, CD207 [langerin], CD24, and CD11c) and Macs (F4/80) (Henri et al., 2010, Malissen et al., 2014). Presently, LC radioresistance constitutes the best way to distinguish them from radiosensitive dermal cDCs (Ginhoux et al., 2007, Henri et al., 2010). To distinguish LCs from cDCs, CD64+F4/80+ Macs were first outgated and the broadly CD11c+CD26+ cells found among Lin−MHCII+ cells (Figure 2A, cyan gate) were subdivided into XCR1hiCD172alo and XCR1loCD172ahi cells. Owing to their CD64loLin−MHCII+XCR1loCD172ahi phenotype, LCs must be distinguished from bona fide cDC2s present in the same gate, and CD24 expression allowed this. On a CD26-CD24 dot plot, CD26intCD24lo cDC2s (green gate) were readily distinguishable from CD26loCD24hi LCs (purple gate). The distinction of cDCs from LCs on the basis of this minimalistic surface marker combination was validated using BM chimeras (Figure 2B). Intracellular IRF4-IRF8 staining validated the correct identification of DCs and macrophages (Macs), in that all cDC1s displayed an IRF8hiIRF4lo profile, all cDC2s displayed an IRF8loIRF4hi profile, and all Macs and LCs displayed an IRF8intIRF4int profile (Figures 1 and 2). Therefore, our gating strategy allows cDC1s and cDC2s to be identified across mouse tissues when CD24 is added to the panel to separate LCs from cDCs in skin.
Figure 2.

Identification of cDC1 and cDC2 in the Murine Skin and Kidneys
(A) Representative flow cytometry plots showing identification of CD64hiF4/80hi macrophages (orange gate), CD11chiCD26hi cDC (cyan gate), XCR1hiCD172alo cDC1 (blue gate), XCR1loCD172ahi cDC2 (green gate), and CD24hiCD26lo LC (purple gate) in the skin of WT mice (extracellular flow panel, see Table S1; intracellular IRF8-IRF4 panel, see Table S2). Cells were pre-gated as single live CD45+ cells.
(B) BM chimeric mice were generated by lethally irradiating CD45.2+ WT mice and reconstituting with CD45.1+ BM. Radioresistant LC were identified as CD45.2+CD45.1− MHCIIhiCD11chi cells in the skin and the skin-draining auricular lymph nodes. The CD26-CD24, as well as the CD11b-F4/80 profile of skin (purple) and LN (pink) LCs, is shown.
(C) Competitive BM chimeric mice were generated by lethally irradiating CD45.1+CD45.2+ WT mice and reconstituting with a 50:50 mix of Batf3−/− or Irf4−/− CD45.2+ BM with WT CD45.1+ BM. The ratio between CD45.1+ and CD45.2+ is shown for CD103hi and CD103lo cDC1s, as well as for CD11bhi and CD11blo cDC2s. Data are representative of three (A) and two independent experiments (B and C).
(D) Representative flow cytometry plots showing identification of CD64+F4/80+ cells (orange gate), CD11c+CD26+ cDC (cyan gate), XCR1hiCD172alo cDC1 (blue gate), and XCR1loCD172ahi cDC2 (green gate) in the kidney of WT mice (extracellular flow panel see Table S1). Cells were pre-gated as single live CD45+. CD64+F4/80+ cells, cDC1s, and cDC2s were subsequently analyzed for expression of IRF4 and IRF8 (intracellular IRF8-IRF4 panel, see Table S2). Histograms show CD64, F4/80, CD26, and CD11c expression among CD64+F4/80+IRF4intIRF8int cells (red gate) and CD64hiF4/80hiIRF8loIRF4hi cells (purple gate).
(E) Proportion (of Live CD45+) and absolute number of CD26+CD11c+CD64− cDCs (cyan gate), IRF4intIRF8intCD64+ cells (red gate), and IRF4hiIRF8loCD64+ cells (purple gate) in the kidneys of Flt3L+/+ and Flt3L−/− mice. ∗∗p < 0.01, ∗∗∗p < 0.001 Student’s t test. Data are representative of three (A) and two independent experiments (B–D) or are pooled from two independent experiments (E) with n = 7 per group.
Please see Figure S2 for the use of FlowSOM to analyze mutant mouse strains automatically.
The dermis has been shown to contain cDC1s with a CD103hi and CD103lo phenotype and double-negative cDC2s that have low expression of CD11c and CD11b (Henri et al., 2010, Tussiwand et al., 2015). Therefore, we added CD103 and CD11b to the panel. Skin cDC1s indeed comprised both CD103hi and CD103lo cells. Among skin cDC2s, CD11b expression permitted CD11bloCD11clo double-negative cDC2s (olive green gate) to be distinguished from CD11bhiCD11chi cDC2s (green gate). Nonetheless, all cDC1s had a homogeneous IRF8hiIRF4lo profile and were BATF3 dependent and IRF4 independent, whereas all cDC2s showed a homogeneous IRF8loIRF4hi profile and were BATF3 independent and IRF4 dependent (Figures 2A and 2C). This illustrates that using a restricted set of lineage-imprinted markers facilitates the correct alignment of cDCs into cDC1s and cDC2s according to their ontogeny while still permitting the inclusion of additional markers to further gauge the presence of different subsets of cDC1s and cDC2s within a given tissue.
Kidney CD64+ cDC2 Can Be Identified by Their CD26hiCD11chiIRF8loIRF4hi Profile
Clec9A-based fate-mapping identified a putative cDC2 subpopulation expressing CD64 in the kidney (Schraml et al., 2013). Consistent with this, our gating strategy revealed that, unlike in other organs, kidney CD64+F4/80+ cells were not homogeneously IRF8intIRF4int (Figure 1) but contained a small population of IRF8loIRF4hi cDC2-like cells (Figure 2D). These IRF8loIRF4hi cells expressed higher CD26 and CD11c and lower F4/80 and CD64 compared with IRF8intIRF4int cells (Figure 2D). Furthermore, IRF8loIRF4hiCD64+F4/80+ cells, but not the IRF8intIRF4intCD64+F4/80+ cells, were Flt3L dependent, identifying the IRF8loIRF4hi and IRF8intIRF4int cells as cDC2s and Macs, respectively. Therefore, regardless of the expression of CD64 on a small fraction of kidney cDC2s, our gating strategy unambiguously identified cDC2s in the kidney.
Unsupervised Analysis Aligns cDC1 and cDC2 across Mouse Tissues
The flow cytometry dataset from distinct tissues was subjected to the unsupervised identification method FlowSOM (Van Gassen et al., 2015). FlowSOM uses a self-organizing map (SOM) to cluster cells in different nodes based on the expression of the distinct markers used in a given flow cytometry dataset and subsequently structures the nodes in a minimal spanning tree. We first concatenated live CD45+ cells from all tissues and used FlowSOM to generate a single FlowSOM tree. To identify the node(s) corresponding to the cDC1s and cDC2s, we defined them ab initio as XCR1hiCD24hiCD26hiCD11chiMHCIIhiCD11bloCD172aloF4/80loCD64loLinloFSCloSSClo and CD11bhiCD172ahiCD26hiCD11chiMHCIIhiXCR1loF4/80loCD64loLinloFSCloSSClo cells, respectively (Figure 3). For each node, we calculated a final score indicating its correspondence with the defined cDC1 or cDC2 profile. First, a marker score was calculated for each node as the difference between the median value of the node for that marker and the minimum or maximum median node value present in the tree. Then, for each marker, the score was normalized between zero and one, and the final node score was then computed as the mean of its scores for each individual marker. All nodes with a final node score of at least 0.95 times the highest score were selected as fitting the profile. This yielded one cDC1 node and two cDC2 nodes (Figure 3C). Separate analysis of each tissue confirmed the presence of discrete cDC1 and cDC2 nodes in all tissues (Figure 3D). Finally, exporting the cells within the cDC1 and cDC2 nodes identified by FlowSOM on XCR1-CD172a, CD11c-CD26, and CD64-F4/80 dot plots confirmed that cDC1 and cDC2 were correctly identified across tissues (Figure 3E). Notably, although cDC2s are defined as F4/80lo, FlowSOM clustered F4/80int cDC2 with the F4/80lo cDC2 (Figure 3E), since a small difference in one marker is not sufficient to separate cells into two separate clusters. Therefore, unsupervised analysis corroborated our manual gating strategy and allowed the robust and fully automated identification of cDC1s and cDC2s across mouse tissues.
Figure 3.

Unsupervised Identification of cDC1 and cDC2 across Mouse Tissues Using FlowSOM
(A–C) Cells from the lungs, spleens, livers, small intestines, and colons from three WT mice were stained with the extracellular panel (Table S1). Single live CD45+ for each sample were exported and concatenated. This concatenated file was then analyzed using FlowSOM and cells were clustered into 49 nodes. To identify the node(s) corresponding to the cDC1s and cDC2s, we defined cDC1 as XCR1hiCD24hiCD26hiCD11chiMHCIIhiCD11bloCD172aloF4/80loCD64loLinloFSCloSSClo and cDC2 as CD11bhiCD172ahiCD26hiCD11chiMHCIIhiXCR1loF4/80loCD64loLinloFSCloSSClo. A score indicating the correspondence with the requested cell profile was then attributed to each node in the FlowSOM tree. (C) All nodes with a final score of at least 0.95 times the highest score were selected as fitting the requested profile, yielding one cDC1 node (blue) and two cDC2 nodes (green).
(D) FlowSOM trees for each tissue separately.
(E) The cells present in the cDC1 and cDC2 nodes of the distinct tissues were exported and manually analyzed for their XCR1, CD172a, CD11c, CD26, CD64, and F4/80 expression. The black gates correspond to the manual gates used in Figure 1. The data shown are representative of two independent experiments. The FlowSOM algorithm was run five times to ensure reproducibility of the results.
Please see Figure S3 for the use of FlowSOM and tSNE to analyze mutant mouse strains automatically.
Unsupervised Analysis of Mutant Mouse Strains Using FlowSOM and tSNE Outperforms Manual Analysis
An additional advantage of unsupervised identification algorithms such as FlowSOM or tSNE is that each marker on a cell is analyzed simultaneously, compared with manual techniques that rely on sequential gating using pairs of surface markers. We have recently reported that splenic cDC1s lacking XBP1 downregulate their surface expression of CD11c (Osorio et al., 2014). This results in the loss of a fraction of CD11clo cDC1s from the analysis when using a classical manual gating strategy (Figure S2A). In contrast, since our proposed manual gating strategy includes identification of cDCs by their CD11c+CD26+ profile, it was easier to avoid missing the CD11clo cDC1s, as these cells maintained their high CD26 profile (Figure S2B). More importantly, both FlowSOM (Figures S2D and S2E) and tSNE (Figure S2F) readily identified cDC1s regardless of their lower CD11c expression because the remaining XCR1hiCD172aloCD64loF4/80loMHCIIhiCD26hi profile was sufficient to identify these cells as cDC1s in a fully unsupervised way. This demonstrates that unsupervised gating using FlowSOM or tSNE outperformed classical manual gating for the analysis of the DC compartment of XBP1-deficient mice.
A Conserved Gating Strategy Aligns cDC Subsets in Mouse, Human, and Macaque Tissues
We next aimed to align DCs across mouse, macaque, and human tissues (Figures 4 and S3). We first had to overcome a few obstacles, such as the species-specific expression pattern of some markers (CD64 in human and macaque) and the lack of cross-reactive antibodies (CD26 for macaque and XCR1 for human and macaque). In human and macaque, CD64 cannot be used, as cDCs also express some CD64 (Figure S3E). Therefore, we opted to exclude monocytes and macs on the basis of CD14 and CD16 expression as classically used. In mouse, human, and macaque and in all organs tested (spleen, liver, lung for mouse and spleen, blood, lung for human and macaque), cDCs were thus defined as CD45+Lin−MHCIIhiCD11cint-hi cells that are F4/80lo-intCD64lo in mouse and CD14loCD16lo in human and macaque. As in the mouse, CD26 was further used to define cDCs in humans. Although mouse cDC1s and cDC2s were both CD11chiCD26hi, human cDC1s were CD26hiCD11cint, whereas cDC2s were CD26loCD11chi (Figure S3B).
Figure 4.

Defining cDC Subsets in Mouse, Human, and Macaque Using Similar Gating Strategies in Different Tissues
(A) Representative flow cytometry plots showing identification of cDC1 (blue gate) and cDC2 (green gate) in mouse, human, and macaque spleens.
(B) Representative flow cytometry plots showing identification of cDC1s (blue gate) and cDC2s (green gate) in the mouse liver and peripheral human and macaque blood.
(C) Representative flow cytometry plots showing identification of cDC1 (blue gate) and cDC2 (green gate) in mouse, human, and macaque lungs. Macs were outgated using CD64-F4/80 for mouse tissues and CD14-CD16 for human and macaque tissues (see Figure S4). Among CADM1loCD172ahi cells, cDC2 were validated as XCR1lo cells in mouse tissues. Human and macaque cDC2s were gated as CD11chiCD1chi among CADM1loCD172ahi cells to avoid contamination of CD11chiCD1clo cells (see Figure S5). CADM1hiCD172alo cells were further analyzed for the expression of XCR1 (mouse), CD26 (human), and IRF8 (macaque) to validate the correct cDC1 identification. For each organ, the IRF8-IRF4 profiles of cDC1 (blue) and cDC2 (green) are shown. Data are representative of at least three independent experiments using cells from different individuals.
Please see Figure S4 for the gating strategies.
We investigated whether CADM1 could be used as a cDC1 marker instead of XCR1 since CADM1 is expressed on porcine and macaque cDC1s (Dutertre et al., 2014, Maisonnasse et al., 2015). To compare the degree of overlap between the expression of XCR1 and CADM1, we used a chimeric protein consisting of human XCL1—the ligand of XCR1—and of the mCherry fluorescent protein (mCherry-XCL1 vaccibodies [Fossum et al., 2015]) to detect XCR1 on human and macaque spleen cells (Figure S4). All CADM1hiCD172alo cDC in human, macaque, and mouse spleen displayed a high XCR1 expression and also strongly expressed IRF8, but not IRF4 (Figure S4). Thus, cDC1s can be defined as CADM1hiCD172alo cDC in mouse, human, and macaque. We next evaluated the use of this panel in multiple mouse, human, and macaque tissues in combination with classical human DC markers such as CD1c (BDCA1) (Figure 4). While CADM1loCD172ahi cells comprised only IRF4hiIRF8lo bona fide cDC2s in mouse, two populations of CADM1loCD172ahi cells were detected in human and macaque lung: a population of bona fide cDC2s with a CD1chiIRF4hiIRF8lo phenotype and a population of CD1clo cells showing the typical IRF4intIRF8int expression observed for macs (Figures 4C and S4A). Therefore, in the case of human and macaque, monocytes or macs were not properly outgated using CD14 and CD16 expression, and CD1c expression was further required to define cDC2s. Hence, across tissues and species, cDC1s and cDC2s could be identified as CADM1hiCD172aloCD11cint-hiCD26hiIRF8hiIRF4lo and CADM1loCD172ahiCD1chiCD11chiIRF4hiIRF8lo cells, respectively. Akin to mouse pDCs, human and macaque pDCs (defined as CD45+CD11cloHLADRhi cells) were IRF8hiIRF4int across tissues (Figures S4B–S4D). Finally, in the human and macaque skin, the gating strategy required an additional marker, CD1a, to identify and outgate CD1ahiCD11cint LC before cDC1s and cDC2s could be faithfully identified (Figure S4). Therefore, using a limited number of flow cytometry markers, it is possible to align cDC subsets across several human, macaque, and mouse tissues, including the skin.
tSNE Automatically Identifies cDCs across Tissues and Species
We next used tSNE to perform an unsupervised analysis of the flow cytometry dataset generated from different tissues of mouse, human, and macaque (Figure 5). For each species (Figures 5A, 5E, and 5I), CD45+Lin−MHCIIhi cells of the distinct tissues were exported, concatenated, and displayed in a single tSNE contour plot (tSNE_dim1-tSNE_dim2). Heatmap representations of the expression of various markers that define Macs, cDCs, and pDCs defined clusters of cells corresponding to the different cell subsets (Figures 5B, 5F, and 5J). Cells falling in the cDC1 (blue), cDC2 (green), and (for human and macaque) pDC (pink) tSNE cell clusters were overlaid on classical contour plots, indicating that the DC subsets automatically delineated on tSNE fit the criteria used to define them by manual gating (Figures 5C, 5G, and 5K). Comparison of the different tissues showed that equivalent DC subsets always fell in the same tSNE regions (Figures 5D, 5H, and 5L). Additionally, tSNE analysis confirmed that, in human lung, CD14loCD16loHLADRhiCD172ahiCD1cloIRF4intIRF8int cells, identified by manual gating (Figures 4 and S4A), were indeed related to monocytes or Macs since they clustered with CD14loCD16hi monocytes (Figures S4C and S4D).
Figure 5.

tSNE Analysis of Flow Cytometry Data from Lineage−MHCII+ Cells across Mouse, Human, and Macaque Tissues
Unsupervised analysis of single live CD45+Lin–MHCIIhi events from the flow cytometry data of (A–D) mouse liver, spleen, and lung and (E–H) human or (I–L) macaque blood, spleen, and lung using nonlinear dimensionality reduction in conjunction with the t-distributed stochastic linear embedding (tSNE) algorithm.
(A, E, and I) tSNE plot of concatenated above-cited organs are shown.
(B, F, and J) The heatmaps of the selected markers on the concatenated tSNE plots are used to define the clusters of cells (circled) that display the phenotype of cDC1, cDC2 or pDC (only for human and macaque).
(C, G, and K) Backgating of the cDC1 (blue), cDC2 (green), and pDC (pink) clusters defined in the tSNE plots into classical flow cytometry dot plots.
(D, H, and L) tSNE plots obtained for each individual (D) mouse, (H) human, or (L) macaque organs. Please see Figure S5 for analysis of the contaminating CD11chiCD1clo CADM1loCD172ahi cells and identification of cDCs in the human and macaque skin.
One-SENSE Analysis of CyTOF Data Reveals Heterogeneity of DC Subsets across Mouse and Human Tissues
To elucidate the heterogeneity among the DC subsets, mass cytometry (CyTOF) data were acquired from different mouse and human tissues and total DC events were analyzed using One-SENSE (one-dimensional soli-expression by nonlinear stochastic embedding) (Cheng et al., 2015). Here, manually chosen lineage-imprinted markers define the first dimension, and the other markers define the second dimension (Figure 6). The “lineage dimension” was defined using two positive markers per DC subset. This resulted in the generation of multiple clusters of CADM1hiCD26hi cDC1 (blue), CD172ahiCD11bhi (mouse), or CD172ahiCD1chi (human) cDC2s (green) and SiglecHhiB220hi (mouse) or CD123hiCD303hi (human) pDCs (pink) (Figures 6A and 6D). Binned frequency heatmaps were generated for each dimension.
Figure 6.

One-SENSE Unsupervised Analysis of CyTOF Data to Simultaneously Define DC Subsets and Their Heterogeneity across Mouse and Human Tissues
Lin−MHCII+CD26+CD11c+ or SiglecH+ events from mouse (A–C) and Lin−HLADR+ events from human (D–G) from CyTOF data from mouse spleen, lung, and intestine (A–C) and human blood, spleen, lung, and intestine (D–G) were analyzed using nonlinear dimensionality reduction in conjunction with the One-SENSE algorithm.
(A and B) The lineage dimension of the mouse One-SENSE plots includes CADM1 and CD26 as cDC1 markers, CD172a and CD11b as cDC2 markers, and Siglec-H and B220 as pDC markers.
(D and F) The lineage dimension of the human One-SENSE plots includes CADM1 and CD26 as cDC1 markers, CD1c and CD172a as cDC2 markers, and CD123 and CD303 as pDC markers. The markers dimension includes all the other non-lineage markers of the CyTOF panels. Frequency heatmaps of markers expression are displayed for both dimensions. cDC1 clusters (delineated in blue), cDC2 clusters (delineated in green), pDC clusters (delineated in pink), and for human, CD172aloCD1clo contaminating myeloid cell clusters (orange), are shown on the concatenated files containing the cells from all organs (A and D) and on the individual plots for each organ (B and F).
(E) Classical contour plots showing the expression of CD123, CD11c, CD26, CD172a, CADM1, and CD1c of cDC1 (blue), cDC2 (green), pDC (pink), and CD172ahiCD1clo cells (orange).
(C and G) Heatmaps of the mean expression intensity of selected markers for the different clusters are shown. The numbers in (C and G) correspond to each of the clusters shown in the analysis of the file containing the concatenated cells from all organs (A and D).
Please see Figure S6 for classical contour plots, histograms of the mouse surface markers, and histograms of the human surface markers.
In human tissues, the lineage dimension validated the established DC subsets and also revealed contaminating CD172ahiCD1clo cells (region delineated by an orange rectangle), separating them from the bona fide CD172ahiCD1chi cDC2s (Figure 6D). As before, these contaminating cells were confirmed to be CD11chiCD26loCADM1loCD172ahiCD1clo cells when visualized in classical two-dimensional (2D) contour plots (Figure 6E).
The marker dimension gave key information concerning the degree of heterogeneity that exists among DC subsets (Figures 6A and 6D). Such heterogeneity can be primarily accounted for by tissue imprinting (Figures 6B and 6F). Heatmaps (Figures 6C and 6G), 2D contour plots, or histograms (Figure S5) illustrated the mean expression of the list of differentially expressed markers for each of the three DC subsets. In mouse, this analysis confirmed that ESAMhi cDC2s (cluster 3) were mainly found in the spleen, while spleen cDC1s (cluster 5) had the highest CD8α and the lowest CD103 expression compared with the majority of cDC1s in the lung and gut (clusters 4 and 6, Figure 6C). In humans, cDC phenotypic heterogeneity was also mostly explained by the tissue of residence (Figure 6F). Furthermore, some heterogeneity could be observed for human pDCs with a subset expressing higher CD141, CD56, CLA, CD62L, CD5, CXCR3, CD2, CX3CR1, and CD39 (cluster 6) being observed in the spleen and in lower proportions in the blood and lung. Therefore, our analysis reveals a previously unappreciated phenotypic heterogeneity in both mouse and human DCs that can now be mined for functional relevance.
One-SENSE Analysis of CyTOF Data Automatically Delineates DC Activation during Inflammation
To demonstrate the usefulness of our approach in inflammatory settings, we utilized One-SENSE to track the activation of cDC1s, cDC2s, and monocyte-derived cells upon LPS-induced inflammation in mice. Lin−MHCII+CD11c+ cells from the lung and mediastinal LNs harvested 1, 2, or 3 days following intranasal treatment with LPS were profiled using CyTOF followed by One-SENSE analysis (Figures 7 and S6A). Lin−MHCII+CD11c+ cells from the different time points post-LPS were exported and concatenated, yielding a single One-SENSE analysis for the lung (Figure 7A) and for the LN (Figure 7F). F4/80 and CD64 were added to the lineage markers to analyze monocyte-derived cells, yielding separated clusters of CD26hiCADM1hiCD11bloCD172alo cDC1 (blue clusters), CD11bhiCD172ahiF4/80lo-intCD64lo-int cDC2 (green clusters), and CD11bhiCD172ahiF4/80hiCD64hi monocyte-derived cells (orange clusters). These were then further subdivided into multiple smaller clusters along the “marker dimension,” revealing variations linked to the duration of LPS treatment (Figures 7B, 7C, 7G, and 7H), including progressive phenotypic changes in expression of costimulatory receptors and inflammatory cytokines (Figures 7D, 7E, 7I, and 7J). This analysis also revealed striking differences in the proportion of cDCs and monocyte-derived cells in both organs after LPS challenge. Day 1 (D1) following LPS-treatment, cDC1s and cDC2s were strongly reduced in the lung, which was paralleled by a massive accumulation of monocyte-derived cells that represented 95% of all lung Lin−MHCII+CD11c+ cells by D3 after LPS. Monocyte-derived cells appeared later in the LN, and their frequency gradually increased from below 1% at D0 and D1 to 36% at D3.
Figure 7.

One-SENSE Unsupervised Analysis of CyTOF Data Unravels the Cellular Dynamics in the Lung and Its Draining Lymph Nodes following Intranasal LPS Administration
Analysis of (CD3-D19-CD49b-CD90-Ly6G)− MHCIIhiCD11c+ cells from the lung (A–D) and corresponding draining lymph node (F–J) of mice (n = 2 per group) prior to (D0) or at D1, D2, or D3 post intranasal LPS treatment were analyzed using CyTOF and nonlinear dimensionality reduction in conjunction with the One-SENSE algorithm.
(A, B, F, and G) The lineage dimension of the One-SENSE plots includes CADM1 and CD26 as cDC1 markers, CD172a and CD11b as cDC2 markers, and F4/80 and CD64 as monocyte-derived cell markers. The markers dimension includes other non-lineage markers of the CyTOF panel. Frequency heatmaps of markers expression are displayed for both dimensions. cDC1 (delineated in blue), cDC2 (delineated in green), and monocyte-derived cells (MC, delineated in orange) clusters are shown on the concatenated files containing the cells from both organs (A and F) and on the individual plots for each time point (B and G).
(C and H) Histograms of the proportion of each cluster are shown among total DCs.
(D and I) Heatmaps of the mean expression intensity of selected markers for the different clusters are shown. The numbers in (D and I) correspond to each of the clusters shown in the analysis of the file containing the concatenated cells from all organs (A and F).
(E and J) Classical contour plots showing the expression of F4/80, CD64, PDL1, FcεRI, Sca1, Bst2, CD86, and CD80 of all clusters.
Please see Figure S7 for the CD11c-MHCII gates and for classical dotsplots of the distinct populations.
At D0, both cDC subsets found in the lung and LN were not activated (low CD40, CD80, and CD86 expression), and cDCs reached maximal activation only after migration to the LNs (see migratory cDC2 #3, cDC1 #6, and #7 at D1 in the LN). Lung monocyte-derived cells upregulated the costimulatory molecules CD80 and CD86, as well as the inhibitory receptor PDL1 (see monocyte-derived cells #3 at D3). We also observed a progressive increase of FcεRI, Bst2, and Sca1 expression by monocyte-derived cells in the lung post-challenge (expression: #1 < #2 < #3; Figures 7D and 7E). LN monocyte-derived cells likely represent cells directly recruited from the bloodstream, as previously described (Nakano et al., 2009). Both lung and LN monocyte-derived cells expressed inflammatory cytokines IL-12p70, tumor necrosis factor (TNF), and interleukin-6 (IL-6), whereas high costimulatory molecule expression was limited to those in the lung. Altogether, this analysis demonstrates the power of our approach in which cDCs and monocyte-derived cell activation can be tracked automatically during an inflammatory response. This open-ended approach could, in the future, include phospho-STAT signaling analysis or a wider range of cytokines, chemokines, or costimulatory receptors.
Discussion
Recent developments in computational methods permit more robust analysis of flow cytometry and CyTOF data. Relying on objective mathematical principles to define cellular clusters, automated analyses increase the reproducibility of flow analysis by circumventing manual gating (Saeys et al., 2016). This constitutes a major improvement, since manual gating is one of the largest variables in the analysis of flow cytometry experiments (Mair et al., 2015). Furthermore, automated analyses assess the expression of all markers simultaneously and are not influenced by the order in which cells are gated, as in manual sequential pairwise comparisons. Finally, these techniques simplify the visualization of the multidimensional datasets, which is particularly important when analyzing such data with more than 30 markers. However, application of these techniques for the study of DCs has remained limited.
Here, we have defined lineage-imprinted surface markers that permit the faithful identification of cDC1s and cDC2s across species and tissues by adding CD26 as a cDC marker complementary to CD11c, combining CD64 and F4/80 to ensure a better distinction between DCs and Macs in mice, using CADM1 or XCR1 in combination with CD172a to separate cDC1s from cDC2s, and using IRF8-IRF4 staining to validate the identification of cDC1s and cDC2s. Our strategy was validated using ontogenic criteria. Moreover, unsupervised computational techniques, such as FlowSOM and tSNE, confirmed the robustness of our strategy for defining cDC1s and cDC2s across mouse, human, and macaque tissues. These techniques could also identify cDC1 and cDC2 populations automatically, paving the way toward the reliable analysis of the DC compartment of many mutant mice in a high-throughput, unsupervised, and standardized manner. Importantly, automated identification can outperform classical manual gating in the analysis of mutant strains when markers change their expression profile, as was exemplified here with the correct identification of CD11clo XBP1-deficient cDC1s that were missed by the classical manual gating strategy.
Although XCR1 identifies cDC1s in mouse (Crozat et al., 2010, Dorner et al., 2009) and is highly expressed on human and macaque cDC1s, as demonstrated with XCL1-mCherry vaccibodies, no commercial anti-human or anti-macaque XCR1 antibody is currently available. Similarly, although CD26 is expressed by macaque DCs at the RNA level (data not shown), none of the commercial anti-CD26 antibodies tested showed cross-reactivity with macaque. Generating cross-species reactive anti-XCR1 and anti-CD26 antibodies will be invaluable, as it will allow further simplification of the minimalistic and universal cDC phenotyping panel proposed here. Likewise, identifying better Mac-specific markers will smoothen this approach. Ideally, we would need one or two surface markers that allow the identification of all Macs (including LCs) across tissues and species, an essential issue to avoid contamination of the cDC2 population since Macs are also XCR1loCD172ahi.
As confirmed by the addition of additional markers to our standard minimalistic panel, previous studies have shown that heterogeneity exists within the cDC1 and cDC2 populations. For instance, mouse skin XCR1hiCD172aloIRF8hiIRF4lo cDC1s comprise both CD103hi and CD103lo cells (Henri et al., 2010). In mouse, the foundations of DC subset specialization are imprinted in the BM, as pre-cDCs already contain cells committed toward the cDC1 or cDC2 lineage before colonizing peripheral tissues (Grajales-Reyes et al., 2015, Schlitzer et al., 2015). These lineage-imprinted programs include the mutually exclusive expression of XCR1 versus CD172a and of IRF8 versus IRF4. To acquire the phenotype of terminally differentiated tissue cDC1s and cDC2s, precursors likely further integrate tissue-associated programs on the top of those lineage-imprinted foundations.
In some organs, cDCs occupy distinct micro-anatomical compartments that can provide distinct environmental cues to developing cDC1s and cDC2s. For example, only those cDC2s that are localized in the splenic bridging channels specifically express CD4. This subset of splenic cDC2s requires Notch2 for their terminal differentiation (Caton et al., 2007, Lewis et al., 2011) and depends on the expression of chemotactic receptor EBI2 for their localization in the bridging channels (Gatto et al., 2013). Analysis by flow cytometry of the splenic DC compartment of EBI2-deficient or NOTCH2-deficient mice using only XCR1 and CD172a yields a less dramatic phenotype than with the inclusion of CD4, because a significant fraction of CD172a+CD4− cDC2s are found in these mice. Use of additional, tissue-imprinted markers such as CD4 is therefore required to fully appreciate the functional heterogeneity of the splenic cDC compartment. As such, understanding those tissue-imprinted programs requires a second level of analysis. The One-SENSE approach we have described fulfills such a requirement, as it first aligns the DC across tissues based on lineage-imprinted markers yielding a simplified lineage dimension and subsequently analyzes the heterogeneity resulting from the tissue-imprinted programs through an unsupervised “marker dimension.” It simplifies the classification of DCs into cDC1s and cDC2s across tissues and species based on conserved lineage-imprinted markers without losing the power that multi-dimensional analyses offer. On that basis, we have gauged the differences that exist in cDC1s and cDC2s according to their tissue of residence and following an inflammatory insult. This highlighted the importance of peripheral programming on cDC development. This type of analysis can be readily expanded to track any parameters of interest, such as the production of inflammatory mediators, or to dissect particular signaling pathways using phospho-flow approaches.
In conclusion, the herein described methodology should provide a useful framework to analyze the complexity of the DC compartment, paving the way toward the identification of the best DC subset(s) to target for specific therapeutic applications such as the development of next-generation vaccines.
Experimental Procedures
Mice
C57BL/6 mice used in France and Belgium were obtained from Harlan or Janvier Laboratories. Flt3l−/− and Itgaxcre x Xbp1fl/fl mice were housed in the VIB-UGent animal facility. C57BL/6 mice for the experiment in Singapore were from the Biological Resource Center (BRC), Agency for Science, Technology and Research (A∗STAR). All animals were housed under specific pathogen-free conditions in individually ventilated cages in a controlled day-night cycle and were given food and water ad libitum. All animal experiments performed were approved by the local animal ethics committee (VIB-UGent; Institutional Animal Care and Use Committee of the Biological Resource Center, A∗STAR; CIML) and were performed according to the guidelines of Belgian, French, and European animal protection law and of the Agri-Food and Veterinary Authority and the National Advisory Committee for Laboratory Animal Research of Singapore. See Supplemental Experimental Procedures for additional information about the generation of BM chimeras, the intranasal LPS treatment, and the digestion of mouse tissues.
Intranasal LPS
C57BL/6 mice were treated or not intranasally with 5μg LPS (Invivogen) and were euthanized 1, 2, or 3 days later. 8 hr before euthanasia, mice were injected intraperiotoneally with 0.25mg of BrefeldinA (sigma) in 200 μL PBS.
Human Tissues
Human samples were obtained with approval from Singapore Singhealth and National Health Care Group Research Ethics Committees. Normal skin was obtained from mammoplasty and breast reconstruction surgery. Lung was obtained from peritumoral tissue. Spleen was obtained from distal pancreatomy patients with pancreatic tumors. Samples were prepared as described previously for skin (McGovern et al., 2014), lung (Schlitzer et al., 2013), and colon (Watchmaker et al., 2014). Spleen was prepared in a similar manner to lung.
Flow Cytometry Stainings
The antibodies and reagents used for FACS analyses of mouse tissues are listed in Tables S1 (extracellular panel) and S2 (IRF4 and IRF8). The antibodies used for FACS analyses of human tissues were all mouse anti-human monoclonal antibodies, except the chicken anti-human CADM1 IgY primary mAb. The list of antibodies and reagents used for human and macaque flow cytometry experiments are listed in Table S3, and details of the antibody combinations (panels) can be found in Table S4. See Supplemental Experimental Procedures for additional information.
Mass Cytometry Stainings, Barcoding, Acquisition, and Data Pre-processing
For mass cytometry CyTOF analyses, purified antibodies were obtained from Invitrogen, Becton Dickinson, Biolegend, eBioscience, BioXCell Fluidigm, R&D biosystems AbD, and AbD Serotec using clones as listed in Table S5 for mouse experiments and in Table S6 for human experiments. Cells were acquired and analyzed using a CyTOF Mass cytometer. The data were exported as a traditional flow cytometry file (.fcs) format, and cells for each barcode were deconvoluted using Boolean gating. One-SENSE analysis was performed as recently described (Cheng et al., 2015). See Supplemental Experimental Procedures for additional information.
FlowSOM and tSNE-Based Unsupervised Analysis
The automated analysis was performed by the FlowSOM algorithm (Van Gassen et al., 2015) or the tSNE algorithm (Becher et al., 2014, Wong et al., 2015). See Supplemental Experimental Procedures for additional information.
Author Contributions
Conceptualization, M.G., C.-A.D., C.L.S., N.McG., D.S., B.N.L., B.M., and F.G.; Methodology, M.G., C.-A.D., C.L.S., N.McG., D.S., A.L., I.L., H.R.S., E.W.N., B.M., H.L., B.N.L., F.G., and Y.S.; Clinicians for helping to access samples, multiple advice, and discussion, J.K.Y.C., C.N.M., M.C., T.J.K.C., D.K.H.C., K.K.T., and T.L.K.H.; Bio-IT analysis, J.C., M.P., S.V.G., and Y.S.; Formal analysis, M.G., C.-A.D., C.L.S., N.McG., S.V.G., H.R.S., E.W.N., and D.S.; Investigation, M.G., C.-A.D., C.L.S., N.McG., D.S., S.H., H.L., B.N.L., B.M., and F.G.; Key reagent, E.F. and B.B.; Resources: M.G., C.-A.D., B.N.L., B.M., and F.G.; Writing, M.G., C.-A.D., C.L.S., E.N., B.N.L., B.M., and F.G.
Acknowledgments
We thank Gert Van Isterdael and Charlene Foong Shu Fen from the Flow Cytometry Core Platform of the IRC and SingHealth, respectively. This work was supported by core grants of the Singapore Immunology Network to F.G. and E.W.N. and by the National Research Foundation Singapore under its cooperative basic research grant new investigator grant (NMRC/BNIG/2026/2014) and administered by the Singapore Ministry of Health’s National Medical Research Council to C.-A.D. C.L.S. is supported by a Marie Curie Intra-European Fellowship (IEF) as part of Horizon 2020. M.G. is supported by a Marie Curie Reintegration grant, an Odysseus grant, and FWO grants of the Flemish Government. B.M. is supported by the CNRS, INSERM, PHENOMIN, and European Research Council (FP7/2007–2013 grant n° 322465). S.V.G. is funded by the Flanders Agency for Innovation by Science and Technology (IWT).
Published: September 13, 2016
Footnotes
Supplemental Information includes Supplemental Experimental Procedures, six figures, and seven tables and can be found with this article online at http://dx.doi.org/10.1016/j.immuni.2016.08.015.
Contributor Information
Martin Guilliams, Email: martin.guilliams@irc.vib-ugent.be.
Bart N. Lambrecht, Email: bart.lambrecht@irc.vib-ugent.be.
Bernard Malissen, Email: bernardm@ciml.univ-mrs.fr.
Florent Ginhoux, Email: florent_ginhoux@immunol.a-star.edu.sg.
Supplemental Information
References
- Bain C.C., Scott C.L., Uronen-Hansson H., Gudjonsson S., Jansson O., Grip O., Guilliams M., Malissen B., Agace W.W., Mowat A.M. Resident and pro-inflammatory macrophages in the colon represent alternative context-dependent fates of the same Ly6C(hi) monocyte precursors. Mucosal Immunol. 2012;6:498–510. doi: 10.1038/mi.2012.89. [DOI] [PMC free article] [PubMed] [Google Scholar]
- Bajaña S., Roach K., Turner S., Paul J., Kovats S. IRF4 promotes cutaneous dendritic cell migration to lymph nodes during homeostasis and inflammation. J. Immunol. 2012;189:3368–3377. doi: 10.4049/jimmunol.1102613. [DOI] [PMC free article] [PubMed] [Google Scholar]
- Becher B., Schlitzer A., Chen J., Mair F., Sumatoh H.R., Teng K.W., Low D., Ruedl C., Riccardi-Castagnoli P., Poidinger M. High-dimensional analysis of the murine myeloid cell system. Nat. Immunol. 2014;15:1181–1189. doi: 10.1038/ni.3006. [DOI] [PubMed] [Google Scholar]
- Breton G., Lee J., Zhou Y.J., Schreiber J.J., Keler T., Puhr S., Anandasabapathy N., Schlesinger S., Caskey M., Liu K., Nussenzweig M.C. Circulating precursors of human CD1c+ and CD141+ dendritic cells. J. Exp. Med. 2015;212:401–413. doi: 10.1084/jem.20141441. [DOI] [PMC free article] [PubMed] [Google Scholar]
- Caton M.L., Smith-Raska M.R., Reizis B. Notch-RBP-J signaling controls the homeostasis of CD8- dendritic cells in the spleen. J. Exp. Med. 2007;204:1653–1664. doi: 10.1084/jem.20062648. [DOI] [PMC free article] [PubMed] [Google Scholar]
- Cheng Y., Wong M.T., van der Maaten L., Newell E.W. Categorical analysis of human t cell heterogeneity with one-dimensional soli-expression by nonlinear stochastic embedding. J. Immunol. 2015;196:924–932. doi: 10.4049/jimmunol.1501928. [DOI] [PMC free article] [PubMed] [Google Scholar]
- Collin M., McGovern N., Haniffa M. Human dendritic cell subsets. Immunology. 2013;140:22–30. doi: 10.1111/imm.12117. [DOI] [PMC free article] [PubMed] [Google Scholar]
- Crozat K., Guiton R., Contreras V., Feuillet V., Dutertre C.A., Ventre E., Vu Manh T.P., Baranek T., Storset A.K., Marvel J. The XC chemokine receptor 1 is a conserved selective marker of mammalian cells homologous to mouse CD8alpha+ dendritic cells. J. Exp. Med. 2010;207:1283–1292. doi: 10.1084/jem.20100223. [DOI] [PMC free article] [PubMed] [Google Scholar]
- Dorner B.G., Dorner M.B., Zhou X., Opitz C., Mora A., Güttler S., Hutloff A., Mages H.W., Ranke K., Schaefer M. Selective expression of the chemokine receptor XCR1 on cross-presenting dendritic cells determines cooperation with CD8+ T cells. Immunity. 2009;31:823–833. doi: 10.1016/j.immuni.2009.08.027. [DOI] [PubMed] [Google Scholar]
- Dutertre C.A., Jourdain J.P., Rancez M., Amraoui S., Fossum E., Bogen B., Sanchez C., Couëdel-Courteille A., Richard Y., Dalod M. TLR3-responsive, XCR1+, CD141(BDCA-3)+/CD8α+-equivalent dendritic cells uncovered in healthy and simian immunodeficiency virus-infected rhesus macaques. J. Immunol. 2014;192:4697–4708. doi: 10.4049/jimmunol.1302448. [DOI] [PubMed] [Google Scholar]
- Fossum E., Grødeland G., Terhorst D., Tveita A.A., Vikse E., Mjaaland S., Henri S., Malissen B., Bogen B. Vaccine molecules targeting Xcr1 on cross-presenting DCs induce protective CD8+ T-cell responses against influenza virus. Eur. J. Immunol. 2015;45:624–635. doi: 10.1002/eji.201445080. [DOI] [PubMed] [Google Scholar]
- Gatto D., Wood K., Caminschi I., Murphy-Durland D., Schofield P., Christ D., Karupiah G., Brink R. The chemotactic receptor EBI2 regulates the homeostasis, localization and immunological function of splenic dendritic cells. Nat. Immunol. 2013;14:446–453. doi: 10.1038/ni.2555. [DOI] [PubMed] [Google Scholar]
- Gautier E.L., Shay T., Miller J., Greter M., Jakubzick C., Ivanov S., Helft J., Chow A., Elpek K.G., Gordonov S., Immunological Genome Consortium Gene-expression profiles and transcriptional regulatory pathways that underlie the identity and diversity of mouse tissue macrophages. Nat. Immunol. 2012;13:1118–1128. doi: 10.1038/ni.2419. [DOI] [PMC free article] [PubMed] [Google Scholar]
- Ginhoux F., Collin M.P., Bogunovic M., Abel M., Leboeuf M., Helft J., Ochando J., Kissenpfennig A., Malissen B., Grisotto M. Blood-derived dermal langerin+ dendritic cells survey the skin in the steady state. J. Exp. Med. 2007;204:3133–3146. doi: 10.1084/jem.20071733. [DOI] [PMC free article] [PubMed] [Google Scholar]
- Grajales-Reyes G.E., Iwata A., Albring J., Wu X., Tussiwand R., Kc W., Kretzer N.M., Briseño C.G., Durai V., Bagadia P. Batf3 maintains autoactivation of Irf8 for commitment of a CD8α(+) conventional DC clonogenic progenitor. Nat. Immunol. 2015;16:708–717. doi: 10.1038/ni.3197. [DOI] [PMC free article] [PubMed] [Google Scholar]
- Guilliams M., van de Laar L. A hitchhiker’s guide to myeloid cell subsets: practical implementation of a novel mononuclear phagocyte classification system. Front. Immunol. 2015;6:406. doi: 10.3389/fimmu.2015.00406. [DOI] [PMC free article] [PubMed] [Google Scholar]
- Guilliams M., Ginhoux F., Jakubzick C., Naik S.H., Onai N., Schraml B.U., Segura E., Tussiwand R., Yona S. Dendritic cells, monocytes and macrophages: a unified nomenclature based on ontogeny. Nat. Rev. Immunol. 2014;14:571–578. doi: 10.1038/nri3712. [DOI] [PMC free article] [PubMed] [Google Scholar]
- Gurka S., Hartung E., Becker M., Kroczek R.A. Mouse conventional dendritic cells can be universally classified based on the mutually exclusive expression of xcr1 and sirpα. Front. Immunol. 2015;6:35. doi: 10.3389/fimmu.2015.00035. [DOI] [PMC free article] [PubMed] [Google Scholar]
- Henri S., Poulin L.F., Tamoutounour S., Ardouin L., Guilliams M., de Bovis B., Devilard E., Viret C., Azukizawa H., Kissenpfennig A., Malissen B. CD207+ CD103+ dermal dendritic cells cross-present keratinocyte-derived antigens irrespective of the presence of Langerhans cells. J. Exp. Med. 2010;207:189–206. doi: 10.1084/jem.20091964. [DOI] [PMC free article] [PubMed] [Google Scholar]
- Langlet C., Tamoutounour S., Henri S., Luche H., Ardouin L., Grégoire C., Malissen B., Guilliams M. CD64 expression distinguishes monocyte-derived and conventional dendritic cells and reveals their distinct role during intramuscular immunization. J. Immunol. 2012;188:1751–1760. doi: 10.4049/jimmunol.1102744. [DOI] [PubMed] [Google Scholar]
- Lee J., Breton G., Oliveira T.Y., Zhou Y.J., Aljoufi A., Puhr S., Cameron M.J., Sékaly R.P., Nussenzweig M.C., Liu K. Restricted dendritic cell and monocyte progenitors in human cord blood and bone marrow. J. Exp. Med. 2015;212:385–399. doi: 10.1084/jem.20141442. [DOI] [PMC free article] [PubMed] [Google Scholar]
- Lewis K.L., Caton M.L., Bogunovic M., Greter M., Grajkowska L.T., Ng D., Klinakis A., Charo I.F., Jung S., Gommerman J.L. Notch2 receptor signaling controls functional differentiation of dendritic cells in the spleen and intestine. Immunity. 2011;35:780–791. doi: 10.1016/j.immuni.2011.08.013. [DOI] [PMC free article] [PubMed] [Google Scholar]
- Mair F., Hartmann F.J., Mrdjen D., Tosevski V., Krieg C., Becher B. The end of gating? An introduction to automated analysis of high dimensional cytometry data. Eur. J. Immunol. 2015;46:34–43. doi: 10.1002/eji.201545774. [DOI] [PubMed] [Google Scholar]
- Maisonnasse P., Bouguyon E., Piton G., Ezquerra A., Urien C., Deloizy C., Bourge M., Leplat J.J., Simon G., Chevalier C. The respiratory DC/macrophage network at steady-state and upon influenza infection in the swine biomedical model. Mucosal Immunol. 2015;9:834–849. doi: 10.1038/mi.2015.105. [DOI] [PubMed] [Google Scholar]
- Malissen B., Tamoutounour S., Henri S. The origins and functions of dendritic cells and macrophages in the skin. Nat. Rev. Immunol. 2014;14:417–428. doi: 10.1038/nri3683. [DOI] [PubMed] [Google Scholar]
- McGovern N., Schlitzer A., Gunawan M., Jardine L., Shin A., Poyner E., Green K., Dickinson R., Wang X.N., Low D. Human dermal CD14+ cells are a transient population of monocyte-derived macrophages. Immunity. 2014;41:465–477. doi: 10.1016/j.immuni.2014.08.006. [DOI] [PMC free article] [PubMed] [Google Scholar]
- McGovern N., Chan J.K., Ginhoux F. Dendritic cells in humans--from fetus to adult. Int. Immunol. 2015;27:65–72. doi: 10.1093/intimm/dxu091. [DOI] [PubMed] [Google Scholar]
- Murphy T.L., Grajales-Reyes G.E., Wu X., Tussiwand R., Briseno C.G., Iwata A., Kretzer N.M., Durai V., Murphy K.M. Transcriptional control of dendritic cell development. Annu. Rev. Immunol. 2015;34:93–119. doi: 10.1146/annurev-immunol-032713-120204. [DOI] [PMC free article] [PubMed] [Google Scholar]
- Naik S.H., Metcalf D., van Nieuwenhuijze A., Wicks I., Wu L., O’Keeffe M., Shortman K. Intrasplenic steady-state dendritic cell precursors that are distinct from monocytes. Nat. Immunol. 2006;7:663–671. doi: 10.1038/ni1340. [DOI] [PubMed] [Google Scholar]
- Nakano H., Lin K.L., Yanagita M., Charbonneau C., Cook D.N., Kakiuchi T., Gunn M.D. Blood-derived inflammatory dendritic cells in lymph nodes stimulate acute T helper type 1 immune responses. Nat. Immunol. 2009;10:394–402. doi: 10.1038/ni.1707. [DOI] [PMC free article] [PubMed] [Google Scholar]
- Onai N., Kurabayashi K., Hosoi-Amaike M., Toyama-Sorimachi N., Matsushima K., Inaba K., Ohteki T. A clonogenic progenitor with prominent plasmacytoid dendritic cell developmental potential. Immunity. 2013;38:943–957. doi: 10.1016/j.immuni.2013.04.006. [DOI] [PubMed] [Google Scholar]
- Osorio F., Tavernier S.J., Hoffmann E., Saeys Y., Martens L., Vetters J., Delrue I., De Rycke R., Parthoens E., Pouliot P. The unfolded-protein-response sensor IRE-1α regulates the function of CD8α+ dendritic cells. Nat. Immunol. 2014;15:248–257. doi: 10.1038/ni.2808. [DOI] [PubMed] [Google Scholar]
- Persson E.K., Uronen-Hansson H., Semmrich M., Rivollier A., Hägerbrand K., Marsal J., Gudjonsson S., Håkansson U., Reizis B., Kotarsky K., Agace W.W. IRF4 transcription-factor-dependent CD103(+)CD11b(+) dendritic cells drive mucosal T helper 17 cell differentiation. Immunity. 2013;38:958–969. doi: 10.1016/j.immuni.2013.03.009. [DOI] [PubMed] [Google Scholar]
- Plantinga M., Guilliams M., Vanheerswynghels M., Deswarte K., Branco-Madeira F., Toussaint W., Vanhoutte L., Neyt K., Killeen N., Malissen B. Conventional and monocyte-derived CD11b(+) dendritic cells initiate and maintain T helper 2 cell-mediated immunity to house dust mite allergen. Immunity. 2013;38:322–335. doi: 10.1016/j.immuni.2012.10.016. [DOI] [PubMed] [Google Scholar]
- Saeys Y., Gassen S.V., Lambrecht B.N. Computational flow cytometry: helping to make sense of high-dimensional immunology data. Nat. Rev. Immunol. 2016;16:449–462. doi: 10.1038/nri.2016.56. [DOI] [PubMed] [Google Scholar]
- Schlitzer A., McGovern N., Teo P., Zelante T., Atarashi K., Low D., Ho A.W., See P., Shin A., Wasan P.S. IRF4 transcription factor-dependent CD11b+ dendritic cells in human and mouse control mucosal IL-17 cytokine responses. Immunity. 2013;38:970–983. doi: 10.1016/j.immuni.2013.04.011. [DOI] [PMC free article] [PubMed] [Google Scholar]
- Schlitzer A., Sivakamasundari V., Chen J., Sumatoh H.R., Schreuder J., Lum J., Malleret B., Zhang S., Larbi A., Zolezzi F. Identification of cDC1- and cDC2-committed DC progenitors reveals early lineage priming at the common DC progenitor stage in the bone marrow. Nat. Immunol. 2015;16:718–728. doi: 10.1038/ni.3200. [DOI] [PubMed] [Google Scholar]
- Schraml B.U., van Blijswijk J., Zelenay S., Whitney P.G., Filby A., Acton S.E., Rogers N.C., Moncaut N., Carvajal J.J., Reis e Sousa C. Genetic tracing via DNGR-1 expression history defines dendritic cells as a hematopoietic lineage. Cell. 2013;154:843–858. doi: 10.1016/j.cell.2013.07.014. [DOI] [PubMed] [Google Scholar]
- Scott C.L., Bain C.C., Wright P.B., Sichien D., Kotarsky K., Persson E.K., Luda K., Guilliams M., Lambrecht B.N., Agace W.W. CCR2(+)CD103(-) intestinal dendritic cells develop from DC-committed precursors and induce interleukin-17 production by T cells. Mucosal Immunol. 2015;8:327–339. doi: 10.1038/mi.2014.70. [DOI] [PMC free article] [PubMed] [Google Scholar]
- Scott C.L., Soen B., Martens L., Skrypek N., Saelens W., Taminau J., Blancke G., Van Isterdael G., Huylebroeck D., Haigh J. The transcription factor Zeb2 regulates development of conventional and plasmacytoid DCs by repressing Id2. J. Exp. Med. 2016;213:897–911. doi: 10.1084/jem.20151715. [DOI] [PMC free article] [PubMed] [Google Scholar]
- Sichien D., Scott C.L., Martens L., Vanderkerken M., Van Gassen S., Plantinga M., Joeris T., De Prijck S., Vanhoutte L., Vanheerswynghels M. IRF8 controls survival and function in terminally differentiated conventional and plasmacytoid dendritic cells respectively. Immunity. 2016;45:626–640. doi: 10.1016/j.immuni.2016.08.013. this issue. [DOI] [PubMed] [Google Scholar]
- Tamoutounour S., Henri S., Lelouard H., de Bovis B., de Haar C., van der Woude C.J., Woltman A.M., Reyal Y., Bonnet D., Sichien D. CD64 distinguishes macrophages from dendritic cells in the gut and reveals the Th1-inducing role of mesenteric lymph node macrophages during colitis. Eur. J. Immunol. 2012;42:3150–3166. doi: 10.1002/eji.201242847. [DOI] [PubMed] [Google Scholar]
- Tamoutounour S., Guilliams M., Montanana Sanchis F., Liu H., Terhorst D., Malosse C., Pollet E., Ardouin L., Luche H., Sanchez C. Origins and functional specialization of macrophages and of conventional and monocyte-derived dendritic cells in mouse skin. Immunity. 2013;39:925–938. doi: 10.1016/j.immuni.2013.10.004. [DOI] [PubMed] [Google Scholar]
- Tussiwand R., Everts B., Grajales-Reyes G.E., Kretzer N.M., Iwata A., Bagaitkar J., Wu X., Wong R., Anderson D.A., Murphy T.L. Klf4 expression in conventional dendritic cells is required for T helper 2 cell responses. Immunity. 2015;42:916–928. doi: 10.1016/j.immuni.2015.04.017. [DOI] [PMC free article] [PubMed] [Google Scholar]
- Van Gassen S., Callebaut B., Van Helden M.J., Lambrecht B.N., Demeester P., Dhaene T., Saeys Y. FlowSOM: Using self-organizing maps for visualization and interpretation of cytometry data. Cytometry A. 2015;87:636–645. doi: 10.1002/cyto.a.22625. [DOI] [PubMed] [Google Scholar]
- Watchmaker P.B., Lahl K., Lee M., Baumjohann D., Morton J., Kim S.J., Zeng R., Dent A., Ansel K.M., Diamond B. Comparative transcriptional and functional profiling defines conserved programs of intestinal DC differentiation in humans and mice. Nat. Immunol. 2014;15:98–108. doi: 10.1038/ni.2768. [DOI] [PMC free article] [PubMed] [Google Scholar]
- Wong M.T., Chen J., Narayanan S., Lin W., Anicete R., Kiaang H.T., De Lafaille M.A., Poidinger M., Newell E.W. Mapping the Diversity of Follicular Helper T Cells in Human Blood and Tonsils Using High-Dimensional Mass Cytometry Analysis. Cell Rep. 2015;11:1822–1833. doi: 10.1016/j.celrep.2015.05.022. [DOI] [PubMed] [Google Scholar]
Associated Data
This section collects any data citations, data availability statements, or supplementary materials included in this article.