

Abstract
Emerging research indicates that depression could be one of the earliest prodromal symptoms or risk factors associated with the pathogenesis of Parkinson’s disease (PD), the second most common neurodegenerative disorder worldwide, but the mechanisms underlying the association between both diseases remains unknown. Understanding the molecular networks linking these diseases could facilitate the discovery of novel diagnostic and therapeutics. Transcriptomic meta-analysis and network analysis of blood microarrays from untreated patients with PD and depression identified genes enriched in pathways related to the immune system, metabolism of lipids, glucose, fatty acids, nicotinamide, lysosome, insulin signaling and type 1 diabetes. Nicotinamide phosphoribosyltransferase (NAMPT), an adipokine that plays a role in lipid and glucose metabolism, was identified as the most significant dysregulated gene. Relative abundance of NAMPT was upregulated in blood of 99 early stage and drug-naïve PD patients compared to 101 healthy controls (HC) nested in the cross-sectional Parkinson’s Progression Markers Initiative (PPMI). Thus, here we demonstrate that shared molecular networks between PD and depression provide an additional source of biologically relevant biomarkers. Evaluation of NAMPT in a larger prospective longitudinal study including samples from other neurodegenerative diseases, and patients at risk of PD is warranted.
Parkinson’s disease (PD) is a devastating neurodegenerative disease that affects movement and it is characterized by the progressive and selective loss of nigrostriatal dopamine neurons and the presence of proteinaceous cytoplasmic inclusions called Lewy Bodies1. Although PD is predominantly characterized as a movement disorder, emerging research indicates that a wide range of non-motor conditions including constipation, sleep disturbances, diabetes, cognitive decline, and depression may play a role in the development of PD. Among these conditions, major depressive disorder (MDD) is one of the most common non-motor symptoms with up to 35% or more PD patients suffering from depression early in the disease2,3. Characteristic symptoms of depression including loss of appetite, sleep disturbances, fatigue, and loss of energy, are commonly observed in PD patients4.
Increasing evidence from epidemiological studies suggest that patients with MDD have an increased risk of PD compared to patients with other chronic conditions including osteoarthritis and diabetes5,6,7,8,9,10,11. More recently, a direct association between depression and subsequent development of PD was confirmed in the largest to date case control study including over 140,000 individuals with depression. Strikingly, the association between depression and PD was significant for a follow-up period of more than 2 decades suggesting that depression may be one of the earliest prodromal symptoms of PD12. Despite this progress, the mechanisms underlying the association between PD and depression remains poorly understood.
Diagnosis of PD and MDD relies upon the assessment of clinical symptoms and to date, there are no fully validated biomarkers for either PD or MDD. In this context, blood biomarkers are promising and several molecular signatures have been identified in blood of PD patients13,14,15,16,17,18 and MDD patients19,20,21 with the potential to become useful clinical diagnostics. Recently, network-based approaches have been employed to identify novel diagnostics, biological pathways and therapeutic targets for several neurodegenerative disorders22,23,24 and depression19. More relevant, network-based approaches have been used to dissect the molecular networks in PD and diabetes and to identify biologically relevant biomarkers for PD25,26,27,28. Using similar methods, herein we interrogate the blood transcriptome of untreated PD and MDD patients to identify shared dysregulated pathways and biologically relevant biomarkers. We identified nicotinamide phosphoribosyltransferase (NAMPT), an adipokine involved in lipid, glucose metabolism, inflammation and insulin resistance29, as a potential blood biomarker for de novo PD patients.
Results
Transcriptomic and network analyses of PD and MDD blood microarrays
To identify a common transcriptional signature in blood of PD and MDD patients, we searched the curated database NextBio Research for human microarray studies from untreated PD and MDD patients (See Materials and Methods). Four microarray studies met the inclusion criteria and were used for further analysis (Table 1). The overall analysis strategy is presented in Fig. 1. We first analyzed the overlap in gene expression between each individual PD and MDD datasets. Only genes with a fold change of 1.2 or higher and a p-value of less than 0.05 were included in the analysis. Using this cut-off criteria, few genes in blood were identified as overlapping between each PD and MDD dataset (Fig. 2). Venn diagram analysis identified NAMPT as the only overlapping gene in all four datasets of untreated PD and MDD patients (Fig. 2).
Table 1. Microarray datasets in blood of untreated PD and MDD patients.
| GEO accession no. | No. of samples | Description | Platform | Reference |
|---|---|---|---|---|
| GSE54536 | PD = 4; HC = 4 | Untreated sporadic PD Patients (mean Hoehn and Yahr stage = 1) | Ilumina HT-12 V4 | 45 |
| GSE72267 | PD = 40; HC = 19 | Untreated sporadic PD (mean Hoehn and Yahr stage = 1.4) | Affymetrix Human Genome U133A 2.0 Array | 16 |
| GSE32280 | MDD = 8; HC = 8 | Transcription profiling of blood from MDD and HC subjects. | Affymetrix Human Genome U133 Plus 2.0 Array | Unpublished |
| GSE46743 | MDD = 69; HC = 91, males | Transcription profiling of blood from MDD and HC subjects. | Illumina HumanHT-12 V3.0 | Unpublished |
Figure 1. Integrative transcriptomic and network analysis.
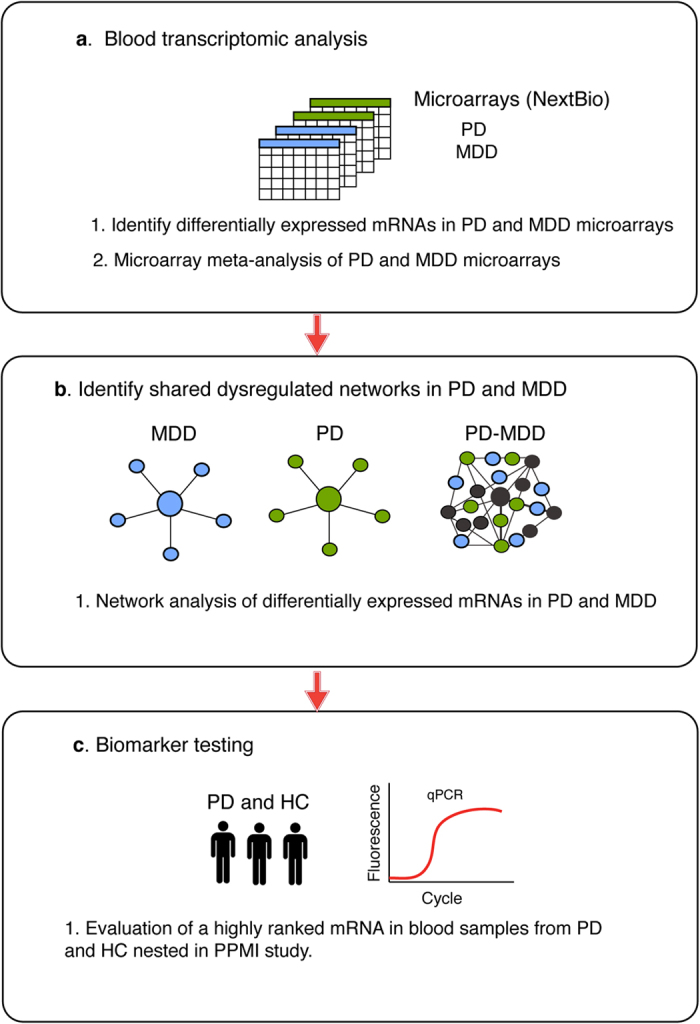
Microarray datasets from PD and MDD were downloaded from NextBio Research. Differential gene expression and microarray meta-analysis were performed using NextBio. Differentially expressed genes shared between PD and MDD were analyzed using network and pathway analysis in GeneMANIA. The most significant gene ranked in meta-analysis and in network analysis was tested in RT-qPCR assays in RNA samples from blood of early stage and drug naïve PD patients and HC nested in PPMI.
Figure 2. Venn diagram analysis.
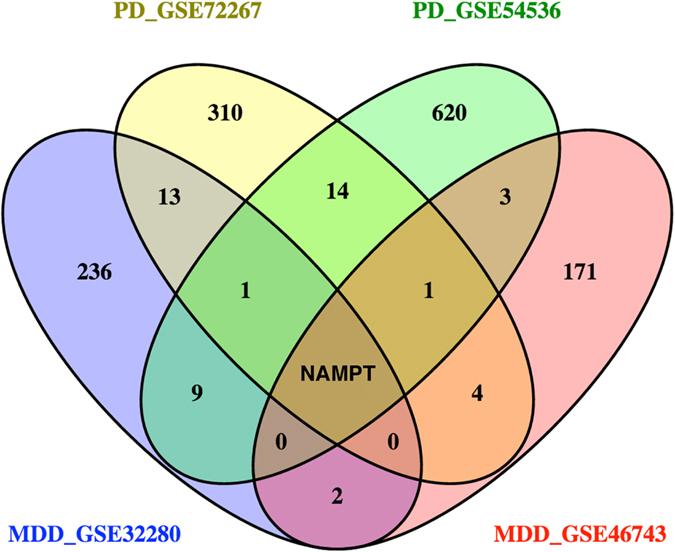
Venn diagram analysis of differentially expressed genes in blood microarrays of untreated PD and MDD patients identified NAMPT as the only overlapping gene across all four datasets.
In order to identify the biological and functional properties of genes shared between PD and MDD, we performed network analysis on each pair of shared genes between PD and MDD datasets using GeneMANIA30 (Fig. 3). Genes within these networks were enriched in pathways related to the immune system (p = 8.6E-09), adipocytokine signaling (7.4E-08), epidermal growth factor receptor pathway (EGFR) (p = 7.9E-04), and type 1 diabetes (p = 1.5E-03).
Figure 3. Network analysis of shared genes in PD and MDD.

Gene network analysis was performed in GeneMANIA. Shared genes between PD and MDD are displayed in black circles and other genes with the greater number of interactions are displayed in gray circles. The sizes of the gray nodes represent the degree of association with the input genes (i.e, smaller size represents low connectivity). Purple lines indicate coexpression, blue lines indicate pathway, pink lines show physical interactions, green lines are genetic interactions. NAMPT, highlighted in green, was the only common gene across all the datasets.
We next performed an integrative meta-analysis of all datasets using the meta-analysis tool in NextBio (See Methods). NAMPT was identified as the most significant gene with differential expression in blood of untreated PD and MDD patients across all four datasets (Fig. 4a). Specifically, NAMPT was upregulated in both datasets from untreated PD patients and in one out of the two MDD datasets (Fig. 4a). The top 20 genes identified in the meta-analysis are listed in Table 2 and the complete list is provided in Supplementary Table S1.
Figure 4. Evaluation of NAMPT mRNA in PD.

(a) Meta-analysis results for NAMPT mRNA across the four PD (green) and MDD (blue) datasets used in this study. NAMPT was significantly upregulated in both datasets from untreated PD patients compared to HC. (b) RT-qPCR assays were used to confirm the results from the meta-analysis. Relative abundance of NAMPT mRNA in blood of 99 PD patients (green) compared to 101 HC (white) in samples obtained from PPMI. The geometric mean of two reference genes, GAPDH and PGK1, were used to normalize for input RNA. A Student t-test (two-tailed) was used to assess the significance between PD and controls. Error bars represent 95% confidence interval. A p-value of 0.05 or less was regarded as significant (c) ROC analysis of NAMPT resulted in an AUC value of 0.63.
Table 2. Top 20 genes identified in meta-analysis of PD and MDD datasets.
| Gene | Gene Description | Specificity | Overall Gene score |
|---|---|---|---|
| NAMPT | Nicotinamide phosphoribosyltransferase | 4 out of 4 | 331.1 |
| LILRA5 | Leukocyte immunoglobulin-like receptor, subfamily A (with TM domain), member 5 | 3 out of 4 | 291.3 |
| LTBP3 | Latent transforming growth factor beta binding protein 3 | 3 out of 4 | 232.1 |
| EGR1 | Early growth response 1 | 2 out of 4 | 199.0 |
| CXCL5 | Chemokine (C-X-C motif) ligand 5 | 2 out of 4 | 197.5 |
| DUSP6 | Dual specificity phosphatase 6 | 2 out of 4 | 190.6 |
| IL1RN | Interleukin 1 receptor antagonist | 2 out of 4 | 185.2 |
| MNDA | Myeloid cell nuclear differentiation antigen | 2 out of 4 | 182.7 |
| GNB5 | Guanine nucleotide binding protein (G protein), beta 5 | 2 out of 4 | 182.6 |
| MS4A7 | Membrane-spanning 4-domains, subfamily A, member 7 | 2 out of 4 | 182.2 |
| MAN1C1 | Mannosidase, alpha, class 1C, member 1 | 2 out of 4 | 181.3 |
| CLEC7A | C-type lectin domain family 7, member A | 2 out of 4 | 179.0 |
| STAP1 | Signal transducing adaptor family member 1 | 2 out of 4 | 178.8 |
| CFLAR | CASP 8 and FADD-like apoptosis regulator | 2 out of 4 | 176.7 |
| LMO4 | LIM domain only 4 | 2 out of 4 | 176.4 |
| FOS | FBJ murine osteosarcoma viral oncogene homolog | 2 out of 4 | 176.0 |
| PATL2 | Protein associated with topoisomerase II homolog 2 (yeast) | 2 out of 4 | 174.9 |
| RASSF4 | Ras association (RalGDS/AF-6) domain family member 4 | 2 out of 4 | 173.9 |
| IL18RAP | Interleukin 18 receptor accessory protein | 2 out of 4 | 173.1 |
| TPCN2 | Two pore segment channel 2 | 2 out of 4 | 172.9 |
Specificity indicates the number of datasets where the gene was significantly differentially expressed. The overall gene score is calculated from a non-parametric ranking in NextBio.
Biological pathways altered across the PD and MDD datasets were determined using a rank-based enrichment statistical analysis and the Molecular Signatures Database (MSigDB) in NextBio. Shared genes identified in meta-analysis were enriched in several pathways including cytokine signaling, lipid metabolism, nucleotide-binding oligomerization domain-like receptors 1 and 2 (NOD1/2) signaling, insulin signaling, glucose metabolism, lysosome, nicotinamide metabolism, type 1 diabetes, spliceosome and protein folding (Fig. 5). Most of the overrepresented biological pathways were upregulated in both MDD and PD. Genes related to splicing and protein folding appeared to be upregulated in MDD but downregulated in PD.
Figure 5. Shared dysregulated pathways in MDD and PD.
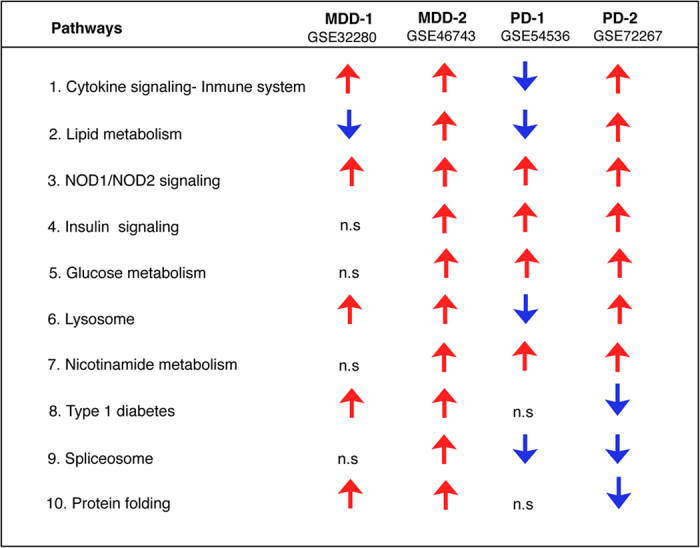
Biological and functional analysis of differentially expressed genes in the MDD and PD datasets used in this study was performed using the Molecular Signatures Database (MSigDB) in NextBio. Differentially expressed genes in each dataset were enriched in the canonical pathways shown in this table (MSigDB). Red and blue arrows indicate upregulation and downregulation, respectively. n.s indicates not significant.
Biomarker evaluation in de novo PD patients
In order to confirm the results from the meta-analysis and network analysis, we tested NAMPT mRNA using real time quantitative polymerase chain reaction (RT-qPCR) assays in blood samples from early stage and drug naïve PD patients and healthy controls (HC) nested in Parkinson’s Progression Markers Initiative (PPMI). Demographic and clinical characteristics of study participants are provided in Table 3. Statistical comparisons of demographic and clinical characteristics for this subset of participants have been published elsewhere15. Briefly, there were no significant differences in mean age and sex distribution between PD and HC (Table 3). PD patients had a small but significantly less years of education compared to HC (p = 0.02)15. RT-qPCR assays revealed that the relative abundance of NAMPT mRNA was upregulated in PD patients compared to HC (p = 0.0008) (Fig. 4b). This result was sustained after adjusting for covariates including age, sex, education and RNA integrity using a general linear model (p = 0.0006). Pearson correlation analysis demonstrated that relative abundance of NAMPT mRNA did not correlate with any of the clinical variables including Hoehn & Yahr (p = 0.26), Movement Disorder Society-sponsored revision of the Unified Parkinson’s Disease Rating Scale (MDS-UPDRS) total (p = 0.86), MDS-UPDRS part I (p = 0.24), MDS-UPDRS part I patient questionnaire (p = 0.21), MDS-UPDRS part II patient questionnaire (p = 0.80), MDS-UPDRS part III patient questionnaire (p = 0.93), and University of Pennsylvania Smell Identification Test (UPSIT) (p = 0.24). Correlation of NAMPT mRNA with the Geriatric depression scale (GDS) trended toward significance but was weak (r = 0.13, p = 0.07). Receiver operating characteristic curve (ROC) analysis resulted in an area under the curve (AUC) value of 0.63 (Fig. 4c).
Table 3. Comparison of demographic and clinical characteristics between PD patients and HC.
| Characteristic | HC (n = 101) | PD (n = 99) | P valuea |
|---|---|---|---|
| Age, mean (SD) [95% CI], y | 61 (10) [59–63] | 63 (9) [61–65] | 0.19 |
| Female/male, No. (% male) | 45/56 (55.4) | 49/50 (50.5) | 0.57b |
| Education, mean (SD) [95% CI], y | 16.2 (2.9) [15.6–16.8] | 15.1 (3.2) [14.4–15.7] | 0.02 |
| Disease duration, media (range), months | n/a | 4 (1–36) | n/a |
| Hoehn and Yahr stage, mean (SD) | 0.009 (0.09) | 1.44 (0.50) | <0.001 |
| MDS-UPDRS total | 4.87 (4.41) | 31.79 (12.41) | <0.001 |
| MoCA, mean (SD) [95% CI] | 28.23 (1.07) [28.02–28.44] | 25.98 (2.53) [25.48–26.48] | <0.001 |
| UPSIT score, mean (SD)[95% CI] | 34.00 (4.86) [33.04–34.96] | 21.08 (8.12) [19.46–22.70] | <0.0001 |
| GDS score, mean (SD) [95% CI] | 1.27 (1.89) [0.89–1.64] | 2.15 (2.48) [1.64–2.67] | <0.007 |
| SCOPA, mean (SD) [95% CI] | 5.86 (3.28) [5.21–6.51] | 9.27 (5.40) [8.16–10.38] | <0.0001 |
Abbreviations: CI = 95% confidence interval; GDS = Geriatric Depression Scale; HC = healthy controls; MoCA = Montreal Cognitive Assessment; MDS-UPDRS = Movement Disorder Society-sponsored revision of the Unified Parkinson’s Disease Rating Scale; PD = Parkinson’s disease; SCOPA = Scale for Outcomes in Parkinson’s disease for Autonomic Symptoms SD = standard deviation; y = years. UPSIT = University of Pennsylvania Smell Identification Test.
aBased on a Student t-test.
bBased on chi-square test (X2).
Building a non-invasive diagnostic model for PD
We next sought to build a non-invasive diagnostic model for PD by integrating the results from our RNA biomarkers with the UPSIT clinical test, which has been shown to be a highly predictive indicator of neurodegeneration31. UPSIT is a commercially available test that consists of a scratch and sniff exam, which can be self-administered to test an individual’s olfactory function32. We performed a forward step-wise linear discriminant analysis to achieve the highest sensitivity and specificity (Methods). We first combined our RNA biomarkers including NAMPT and the coatomer protein complex subunit zeta 1 (COPZ1), a blood RNA biomarker replicated previously in the same subset of samples from Parkinson’s Progression Markers Initiative (PPMI)15. Using both markers individually and in combination resulted in an overall diagnostic accuracy of 58% and COPZ1 was removed from the model (Supplementary Tables S2–S5).
We next combined both RNA markers with UPSIT scores. Based on this analysis, UPSIT and NAMPT mRNA were capable to distinguish PD patients from HC, independently of sex and age, with an overall diagnostic accuracy of 86% (90% sensitivity, 82% specificity) (Supplementary Tables S6 and S7). COPZ1, age, and sex were excluded from the model. Using UPSIT scores alone, PD patients were identified with an overall diagnostic accuracy of 84% (91% sensitivity, 80% specificity) (Supplementary Table S8), indicating the limited contribution of NAMPT mRNA to the classification model.
Discussion
Mounting evidence suggests that depression plays an important role in the pathogenesis of PD. Despite the increasing evidence from epidemiological studies, the molecular mechanisms linking both diseases remain unknown. Several hypotheses have been proposed to explain the relationship between depression and PD. For example, the “serotonin hypothesis” is based upon the finding that serotonin activity is lower in the brains of patients with depression and PD compared to healthy individuals33,34. Another hypothesis, the Braak hypothesis, states that alpha synuclein, a central protein in the pathogenesis of PD, is sequentially accumulated in the raphe nuclei, where serotonin is released, and later in the substantia nigra, where dopamine neurons control movement35. Lastly, it has been proposed that proinflammatory cytokines cause alterations in serotonin and dopamine neurotransmission leading to depression and PD36. Despite the accumulating evidence, the precise mechanism underlying the association between depression and PD remains unknown. Therefore, a system-level understanding of PD and depression may lead to novel diagnostic and therapeutic approaches.
To this end, we employed an integrated transcriptomic and network analysis to identify shared dysregulated pathways and molecular networks in MDD and PD. Because drugs to treat PD or depression may affect gene expression changes in blood, we used microarray datasets from drug naïve PD and MDD patients. Network analysis revealed that shared genes between PD and MDD datasets were enriched in pathways related to the immune system, adipocytokine signaling, EGFR pathway, and type 1 diabetes. In this context, growing evidence suggests that inflammation and diabetes may be involved in the pathogenesis of PD27,28,37,38,39. Similarly, increased inflammation has been associated with decreased corticostriatal functional connectivity in depression40 and elevated levels of inflammatory cytokines including interleukins IL-6, IL-1β, and tumor necrosis factor (TNF) have been found in serum of MDD patients compared to non-depressed subjects41. Low plasma levels of epidermal growth factor (EGF) have been associated with cognitive decline in PD patients42,43. Likewise, increased plasma levels of EGF have been found in MDD patients compared to non-depressed controls21. Thus, EGF may be a useful biomarker for PD and depression.
We next performed an integrative transcriptomic meta-analysis of four blood microarrays from untreated PD and MDD patients. Consistent with the results from the network analysis, genes identified in the meta-analysis were enriched in several pathways including cytokine signaling, lipid metabolism, NOD1/2 signaling, insulin signaling, glucose metabolism, lysosome, nicotinamide metabolism, type 1 diabetes, spliceosome and protein folding (Fig. 5). Most of these pathways appeared to be dysregulated in the same direction in both PD and MDD, thus reinforcing the numerous epidemiological studies that have shown a positive association between both diseases (Fig. 5)5,6,7,8,9,10,11. Notably, NOD1/2 signaling, important for the induction of inflammatory processes, is upregulated across all datasets. This is not surprising since the increased expression levels of inflammatory molecules are prominent features of both PD and MDD and are thought to play a causative role in both diseases39,40,41.
Genes involved in protein misfolding, a central mechanism in the pathogenesis of PD, appeared to be upregulated in MDD datasets but downregulated in PD. To the best of our knowledge, dysregulation of this pathway has not been documented in MDD. Similarly, genes involved in the spliceosome were upregulated in MDD and downregulated in PD (Fig. 5). In this context, aberrant splicing has been implicated in both PD13,14,22,44,45 and MDD46. Nonetheless, the pathway divergence observed in protein folding and splicing in MDD and PD warrants further investigation.
Meta-analysis identified NAMPT mRNA as the most significant gene dysregulated in blood of PD and MDD patients. Specifically, NAMPT mRNA was significantly upregulated in blood of PD patients compared to HC in both datasets from PD patients. NAMPT is a regulator of the intracellular nicotinamide adenine dinucleotide (NAD), an essential coenzyme involved in the cellular oxidative stress response. Recently, treatment with an enzymatic product of NAMPT protected against 6-hydroxydopamine (6-OHDA) neurotoxicity in vitro, thus suggesting a novel therapeutic strategy for PD47. Interestingly, altered levels of extracellular NAMPT are associated with several metabolic conditions including obesity, non-alcoholic fatty liver disease, and type 2 diabetes29. Further, NAMPT is an adipocytokine secreted by visceral fat tissues with insulin-mimetic effects48 and its mRNA expression is stimulated by factors associated with insulin resistance such as IL-6, dexamethasone, growth hormone, and TNF29. In this regard, insulin resistance has been associated with PD27,28 and drug naïve PD patients have been found to have glucose levels characteristic of insulin resistance15. Recently, several studies have identified genetic overlap between diabetes and MDD49,50. Thus, diabetes may play an important role in the pathogenesis of both PD and MDD.
We next evaluated NAMPT as a potential biomarker for PD using blood samples from PD patients and HC nested in PPMI. Relative abundance of NAMPT levels were significantly increased in early stage drug naïve PD patients compared to HC, although a substantial overlap in expression levels between the two groups was observed. The AUC value assessed by ROC curve analysis was 0.63 thus demonstrating a low diagnostic capacity. Nonetheless, this diagnostic capacity is similar to other RNA biomarkers that have been tested in blood of untreated PD patients. For instance, relative abundance of COPZ1 and synuclein alpha (SNCA) mRNAs were differentially expressed in PD patients compared to HC nested in PPMI15,51. The reported AUC values for COPZ1 and SNCA in PPMI were 0.60 and 0.58, respectively. Besides RNA markers, reduced plasma levels of apolipoprotein A1 (APOA1) were confirmed in PPMI17. Despite this progress, none of these biomarkers have achieved the optimal diagnostic capacity to be translated into the clinical setting.
Integration of omics approaches with clinical information has the potential to improve the diagnosis of PD. Recently, an integrative model including genetic risk factors, demographic information and olfactory function using the UPSIT scores, correctly distinguished early stage untreated PD patients from HC nested in PPMI with 83% sensitivity and 90% specificity31. Of note, the classification model using UPSIT scores alone was highly accurate compared to the integrative model31. Similarly, we combined our biomarker expression data with UPSIT scores and achieved comparable results. Our classification model including UPSIT scores and NAMPT mRNA were capable to distinguish PD patients from HC with 90% sensitivity and 82% specificity. Nonetheless, using UPSIT scores alone PD patients were classified with 91% sensitivity and 80% specificity thereby demonstrating the limited contribution of NAMPT mRNA to the model. In this study, like the integrative model proposed by Nalls et al.31, UPSIT test alone is individually strong to distinguish PD patients from HC. Despite the high diagnostic accuracy afforded by UPSIT, olfactory dysfunction is present in atypical parkinsonian disorders and other neurodegenerative diseases including Alzheimer’s disease and cerebellar ataxia52,53. Thus, olfactory dysfunction is not restrictive to PD and therefore, UPSIT analysis alone is not specific enough to overcome the high misdiagnosis rate in PD and other neurodegenerative disorders.
The search for a non-invasive biomarker with the optimal sensitivity and specificity continue to be a major challenge in the field. We expect that a combination of protein and RNA markers will significantly improve the diagnosis of untreated PD patients. In addition, it will be important to evaluate NAMPT mRNA in larger prospective longitudinal studies and in at risk populations for PD. Further, NAMPT may be an early indicator of neurodegeneration in MDD patients. Therefore, future studies will seek to evaluate NAMPT in blood of MDD patients and PD patients with comorbid MDD.
Methods
Microarray meta-analysis and network analysis
We used the curated database NextBio Research (Illumina Inc, CA, USA) to search gene expression studies in PD and MDD. Microarray studies using RNA prepared from human blood from untreated PD, MDD patients and healthy controls at baseline were used for subsequent analysis. Using the search terms “Parkinson’s disease”, “blood”, “depression”, “major depression disorder”, “transcriptional profiling” we identified 4 microarrays studies that meet our inclusion criteria as of March 01, 2016. Description of microarray datasets included in this study is provided in Table 1. Differentially expressed genes were extracted from NextBio. Negative values, if any, were replaced with the smallest positive number in the dataset. Statistical analyses were performed on log scale data. Genes whose mean normalized test and control intensities were both less than the 20th percentile of the combined normalized signal intensities were removed. Microarray meta-analysis was performed for PD and MDD datasets using the meta-analysis tool in NextBio that uses a normalized ranking approach, which enables comparability across gene expression datasets from different studies, platforms, and methods by removing dependence on absolute values of fold changes54,55. Ranks are assigned to each gene signature based on the magnitude of fold-change and then normalized to eliminate any bias owing to varying platform size. Only genes with a p-value of 0.05 or less and an absolute fold-change of 1.2 or greater were regarded as significantly differentially expressed. This meta-analysis tool has been used by others to identify dysregulated pathways shared in mouse and human studies55. Network analysis was performed using GeneMANIA30 in Cytoscape v.3.0.3. We used the default settings to include the 10 genes that have the highest number of interactions and advanced settings to include co-expression, physical, genetic, pathways, and transcription factor interactions.
Study Participants
The parent cohort for this study is the PPMI, a 5-year observational, longitudinal, and international study comprising over 400 untreated and early stage PD patients and nearly 200 HC recruited from 32 clinical sites in Australia, United States of America (USA) and Europe. A power analysis based on each biomarker from our previous studies15,22,25, indicated that a minimum fold change of 1 between PD and controls could be detected with a 95% power using 100 samples per group. We selected a total of 200 participants including 99 PD patients and 101 age and sex matched HC nested in the PPMI study. PD patients that had a dopamine transporter deficit assessed by DaTscan imaging and with a Hoehn and Yahr stage I or II were chosen for this study. HC were cognitively normal, free of neurological disorder, and with no detectable dopamine transporter deficit. Demographic and clinical characteristics about the study participants are shown in Table 3. This table has been slightly modified from our previous publication15. Methods were conducted in accordance with the rules and guidelines of The Institutional Review Boards of Rosalind Franklin University of Medicine and Science. The Institutional Review Boards of Rosalind Franklin University of Medicine and Science and all sites participating in the PPMI study approved the study. The list of all participant clinical sites can be found at the PPMI website (http://www.ppmi-info.org/about-ppmi/ppmi-clinical-sites/). Written informed consent was obtained from all participants before inclusion in the study. All participants were evaluated for clinical features by investigators at each participant site. More information about study participants have been described elsewhere in refs. 15 and 56 and at the PPMI website (http://www.ppmi-info.org/). To access the data from this manuscript or to request samples visit the PPMI website (http://www.ppmi-info.org/access-data-specimens/request-specimens/).
Blood sample collection and handling
Whole blood was collected at baseline during 8 am–10 am, at each participant site as described in the PPMI biologics manual (http://www.ppmi-info.org/). Patients were asked to fast overnight before blood collection. PAXgene blood RNA tubes were used according to the study protocol as described in the PPMI biologics manual and elsewhere in ref. 15. Briefly, PAXgene tubes containing blood were immediately inverted gently 8–10 times to mix the samples. Tubes were placed upright and incubated for 24 hrs at room temperature before freezing. After the 24 hrs incubation period, PAXgene blood tubes were stored at −80 °F until shipment. Frozen samples were sent to the PPMI Biorepository Core laboratories for RNA extraction. Blinded frozen samples were shipped in dry ice to Rosalind Franklin University of Medicine for the studies described herein.
Quantitative Polymerase Chain Reaction Assays
Samples with RNA integrity values >7.0 and absorbance 260/280 between 1.2 and 3.0 were used in this study. One microgram of RNA was reverse transcribed into cDNA using a mix of random hexamer primers (High Capacity cDNA Synthesis Kit, Life Technologies, USA). RT-qPCR assays were performed using the DNA engine Opticon 2 Analyzer (Bio-Rad Life Sciences, Hercules, CA, USA). Each 25 microliters reaction contained Power SYBR Green (Life Technologies, USA) and primers at a concentration of 0.05 mM. Samples were run in triplicates and non-template control was used in all experiments. The geometric mean of two reference genes, glyceraldehyde-3-phosphate dehydrogenase (GAPDH) and phosphoglycerate kinase 1 (PGK1), were used to normalize for input RNA. Primer sequences for PGK1 and GAPDH have been published elsewhere in refs 57 and 13. Primer sequences used for NAMPT are as follows: forward, 5′-CTATAAACAATATCCACCCAACACAAG-3′, reverse 5′-GTTTCCTCATATTTCACCTTCCTTAATT-3′. Samples were randomly distributed on PCR plates to avoid run-order bias. RT-qPCR amplification conditions have been reported in our previous studies13,14.
Statistical Analysis
Statistical analysis was performed using STATISTICA 12 (StatSoft, OK, USA) and GraphPad Prism version 5 (GraphPad Software, Inc., CA, USA). A Student-t-test (unpaired, two tailed) was used to assess the differences between two groups and a chi-square test was used to analyze categorical data. Pearson correlation was performed for all correlations. The relative abundance of each biomarker was independently assessed using a general linear regression model adjusting for age, sex, and educational level. ROC analysis was performed to determine the diagnostic accuracy. We performed a forward step-wise linear discriminant analysis as demonstrated previously13,14 using our biomarker expression data, UPSIT scores and potential confounding variables including age and sex in STATISTICA 12 (StatSoft, OK, USA). A p-value of 0.05 or less was considered significant.
Additional Information
How to cite this article: Santiago, J. A. et al. Integrative transcriptomic meta-analysis of Parkinson’s disease and depression identifies NAMPT as a potential blood biomarker for de novo Parkinson’s disease. Sci. Rep. 6, 34579; doi: 10.1038/srep34579 (2016).
Supplementary Material
Acknowledgments
Data used in the preparation of this article were obtained from the Parkinson’s Progression Markers Initiative (PPMI) database (www.ppmi-info.org/data). For up-to-date information on the study, visit www.ppmi-info.org. PPMI – a public-private partnership – is funded by the Michael J. Fox Foundation for Parkinson’s Research and funding partners, including Abbvie, Avid Radiopharmaceuticals, Biogen Idec, Bristol-Myers Squibb, Covance, GE healthcare, Genentech, GlaxoSmithKline, Lilly, Lundbeck, Merck, Meso Scale Discovery, Pfizer, Piramal, Roche, Servier, and UCB found at www.ppmi-info.org/fundingpartners. This study was also partially funded by the US Army Medical Research and Materiel Command under awards number W81XWH-09-0708 and W81XWH13-1-0025 to JAP. Funding agencies had no role in study design, data collection and analysis, decision to publish, or preparation of the manuscript.
Footnotes
Author Contributions J.A.S. and J.A.P. conceived and designed the research. J.A.S. and A.M.L. performed network and pathway analyses. J.A.S. performed transcriptomic meta-analysis, qPCR experiments, statistical analysis and prepared figures. J.A.S. and J.A.P. wrote the manuscript. All authors reviewed the manuscript.
References
- Dauer W. & Przedborski S. Parkinson’s disease: mechanisms and models. Neuron 39, 889–909 (2003). [DOI] [PubMed] [Google Scholar]
- Aarsland D., Pahlhagen S., Ballard C. G., Ehrt U. & Svenningsson P. Depression in Parkinson disease–epidemiology, mechanisms and management. Nat Rev Neurol 8, 35–47, doi: 10.1038/nrneurol.2011.189 (2012). [DOI] [PubMed] [Google Scholar]
- Hanganu A. et al. Influence of depressive symptoms on dopaminergic treatment of Parkinson’s disease. Front Neurol 5, 188, doi: 10.3389/fneur.2014.00188 (2014). [DOI] [PMC free article] [PubMed] [Google Scholar]
- Schrag A. et al. Depression rating scales in Parkinson’s disease: critique and recommendations. Mov Disord 22, 1077–1092, doi: 10.1002/mds.21333 (2007). [DOI] [PMC free article] [PubMed] [Google Scholar]
- Nilsson F. M., Kessing L. V. & Bolwig T. G. Increased risk of developing Parkinson’s disease for patients with major affective disorder: a register study. Acta Psychiatr Scand 104, 380–386 (2001). [DOI] [PubMed] [Google Scholar]
- Nilsson F. M., Kessing L. V., Sorensen T. M., Andersen P. K. & Bolwig T. G. Major depressive disorder in Parkinson’s disease: a register-based study. Acta Psychiatr Scand 106, 202–211 (2002). [DOI] [PubMed] [Google Scholar]
- Shiba M. et al. Anxiety disorders and depressive disorders preceding Parkinson’s disease: a case-control study. Mov Disord 15, 669–677 (2000). [DOI] [PubMed] [Google Scholar]
- Schuurman A. G. et al. Increased risk of Parkinson’s disease after depression: a retrospective cohort study. Neurology 58, 1501–1504 (2002). [DOI] [PubMed] [Google Scholar]
- Leentjens A. F., Van den Akker M., Metsemakers J. F., Lousberg R. & Verhey F. R. Higher incidence of depression preceding the onset of Parkinson’s disease: a register study. Mov Disord 18, 414–418, doi: 10.1002/mds.10387 (2003). [DOI] [PubMed] [Google Scholar]
- Fang F. et al. Depression and the subsequent risk of Parkinson’s disease in the NIH-AARP Diet and Health Study. Mov Disord 25, 1157–1162, doi: 10.1002/mds.23092 (2010). [DOI] [PMC free article] [PubMed] [Google Scholar]
- Shen C. C., Tsai S. J., Perng C. L., Kuo B. I. & Yang A. C. Risk of Parkinson disease after depression: a nationwide population-based study. Neurology 81, 1538–1544, doi: 10.1212/WNL.0b013e3182a956ad (2013). [DOI] [PubMed] [Google Scholar]
- Gustafsson H., Nordstrom A. & Nordstrom P. Depression and subsequent risk of Parkinson disease: A nationwide cohort study. Neurology 84, 2422–2429, doi: 10.1212/WNL.0000000000001684 (2015). [DOI] [PMC free article] [PubMed] [Google Scholar]
- Potashkin J. A., Santiago J. A., Ravina B. M., Watts A. & Leontovich A. A. Biosignatures for Parkinson’s disease and atypical parkinsonian disorders patients. PLoS One 7, e43595, doi: 10.1371/journal.pone.0043595 (2012). [DOI] [PMC free article] [PubMed] [Google Scholar]
- Santiago J. A., Scherzer C. R. & Potashkin J. A. Specific splice variants are associated with Parkinson’s disease. Mov Disord 28, 1724–1727, doi: 10.1002/mds.25635 (2013). [DOI] [PMC free article] [PubMed] [Google Scholar]
- Santiago J. A. & Potashkin J. A. Blood Biomarkers Associated with Cognitive Decline in Early Stage and Drug-Naive Parkinson’s Disease Patients. PLoS One 10, e0142582, doi: 10.1371/journal.pone.0142582 (2015). [DOI] [PMC free article] [PubMed] [Google Scholar]
- Calligaris R. et al. Blood transcriptomics of drug-naive sporadic Parkinson’s disease patients. BMC Genomics 16, 876, doi: 10.1186/s12864-015-2058-3 (2015). [DOI] [PMC free article] [PubMed] [Google Scholar]
- Swanson C. R. et al. Plasma apolipoprotein A1 associates with age at onset and motor severity in early Parkinson’s disease patients. Mov Disord 30, 1648–1656, doi: 10.1002/mds.26290 (2015). [DOI] [PMC free article] [PubMed] [Google Scholar]
- Simchovitz A., Soreq L. & Soreq H. Transcriptome profiling in Parkinson’s leukocytes: from early diagnostics to neuroimmune therapeutic prospects. Curr Opin Pharmacol 26, 102–109, doi: 10.1016/j.coph.2015.10.007 (2016). [DOI] [PubMed] [Google Scholar]
- Redei E. E. et al. Blood transcriptomic biomarkers in adult primary care patients with major depressive disorder undergoing cognitive behavioral therapy. Transl Psychiatry 4, e442, doi: 10.1038/tp.2014.66 (2014). [DOI] [PMC free article] [PubMed] [Google Scholar]
- Bilello J. A. et al. MDDScore: confirmation of a blood test to aid in the diagnosis of major depressive disorder. J Clin Psychiatry 76, e199–e206, doi: 10.4088/JCP.14m09029 (2015). [DOI] [PubMed] [Google Scholar]
- Papakostas G. I. et al. Assessment of a multi-assay, serum-based biological diagnostic test for major depressive disorder: a pilot and replication study. Mol Psychiatry 18, 332–339, doi: 10.1038/mp.2011.166 (2013). [DOI] [PubMed] [Google Scholar]
- Santiago J. A. & Potashkin J. A. Network-based metaanalysis identifies HNF4A and PTBP1 as longitudinally dynamic biomarkers for Parkinson’s disease. Proc Natl Acad Sci USA 112, 2257–2262, doi: 10.1073/pnas.1423573112 (2015). [DOI] [PMC free article] [PubMed] [Google Scholar]
- Santiago J. A. & Potashkin J. A. A network approach to diagnostic biomarkers in progressive supranuclear palsy. Mov Disord 29, 550–555, doi: 10.1002/mds.25761 (2014). [DOI] [PubMed] [Google Scholar]
- Santiago J. A. & Potashkin J. A. A network approach to clinical intervention in neurodegenerative diseases. Trends Mol Med 20, 694–703, doi: 10.1016/j.molmed.2014.10.002 (2014). [DOI] [PubMed] [Google Scholar]
- Santiago J. A., Scherzer C. R. & Potashkin J. A. Network analysis identifies SOD2 mRNA as a potential biomarker for Parkinson’s disease. PLoS One 9, e109042, doi: 10.1371/journal.pone.0109042 (2014). [DOI] [PMC free article] [PubMed] [Google Scholar]
- Santiago J. A. & Potashkin J. A. Integrative network analysis unveils convergent molecular pathways in Parkinson’s disease and diabetes. PLoS One 8, e83940, doi: 10.1371/journal.pone.0083940 (2013). [DOI] [PMC free article] [PubMed] [Google Scholar]
- Santiago J. A. & Potashkin J. A. Shared dysregulated pathways lead to Parkinson’s disease and diabetes. Trends Mol Med 19, 176–186, doi: 10.1016/j.molmed.2013.01.002 (2013). [DOI] [PubMed] [Google Scholar]
- Santiago J. A. & Potashkin J. A. System-based approaches to decode the molecular links in Parkinson’s disease and diabetes. Neurobiol Dis 72 Pt A, 84–91, doi: 10.1016/j.nbd.2014.03.019 (2014). [DOI] [PubMed] [Google Scholar]
- Garten A. et al. Physiological and pathophysiological roles of NAMPT and NAD metabolism. Nat Rev Endocrinol 11, 535–546, doi: 10.1038/nrendo.2015.117 (2015). [DOI] [PubMed] [Google Scholar]
- Warde-Farley D. et al. The GeneMANIA prediction server: biological network integration for gene prioritization and predicting gene function. Nucleic Acids Res 38, W214–W220, doi: 10.1093/nar/gkq537 (2010). [DOI] [PMC free article] [PubMed] [Google Scholar]
- Nalls M. A. et al. Diagnosis of Parkinson’s disease on the basis of clinical and genetic classification: a population-based modelling study. Lancet Neurol 14, 1002–1009, doi: 10.1016/S1474-4422(15)00178-7 (2015). [DOI] [PMC free article] [PubMed] [Google Scholar]
- Doty R. L., Shaman P., Kimmelman C. P. & Dann M. S. University of Pennsylvania Smell Identification Test: a rapid quantitative olfactory function test for the clinic. Laryngoscope 94, 176–178 (1984). [DOI] [PubMed] [Google Scholar]
- Mayeux R. The “serotonin hypothesis” for depression in Parkinson’s disease. Adv Neurol 53, 163–166 (1990). [PubMed] [Google Scholar]
- Ishihara L. & Brayne C. A systematic review of depression and mental illness preceding Parkinson’s disease. Acta Neurol Scand 113, 211–220, doi: 10.1111/j.1600-0404.2006.00579.x (2006). [DOI] [PubMed] [Google Scholar]
- Braak H. et al. Staging of brain pathology related to sporadic Parkinson’s disease. Neurobiol Aging 24, 197–211 (2003). [DOI] [PubMed] [Google Scholar]
- Pessoa Rocha N., Reis H. J., Vanden Berghe P. & Cirillo C. Depression and cognitive impairment in Parkinson’s disease: a role for inflammation and immunomodulation? Neuroimmunomodulation 21, 88–94, doi: 10.1159/000356531 (2014). [DOI] [PubMed] [Google Scholar]
- Spielman L. J., Little J. P. & Klegeris A. Inflammation and insulin/IGF-1 resistance as the possible link between obesity and neurodegeneration. J Neuroimmunol 273, 8–21, doi: 10.1016/j.jneuroim.2014.06.004 (2014). [DOI] [PubMed] [Google Scholar]
- Wang L. et al. Metabolic inflammation exacerbates dopaminergic neuronal degeneration in response to acute MPTP challenge in type 2 diabetes mice. Exp Neurol 251, 22–29, doi: 10.1016/j.expneurol.2013.11.001 (2014). [DOI] [PubMed] [Google Scholar]
- Nolan Y. M., Sullivan A. M. & Toulouse A. Parkinson’s disease in the nuclear age of neuroinflammation. Trends Mol Med 19, 187–196, doi: 10.1016/j.molmed.2012.12.003 (2013). [DOI] [PubMed] [Google Scholar]
- Felger J. C. et al. Inflammation is associated with decreased functional connectivity within corticostriatal reward circuitry in depression. Mol Psychiatry, doi: 10.1038/mp.2015.168 (2015). [DOI] [PMC free article] [PubMed] [Google Scholar]
- Dowlati Y. et al. A meta-analysis of cytokines in major depression. Biol Psychiatry 67, 446–457, doi: 10.1016/j.biopsych.2009.09.033 (2010). [DOI] [PubMed] [Google Scholar]
- Chen-Plotkin A. S. et al. Plasma epidermal growth factor levels predict cognitive decline in Parkinson disease. Ann Neurol 69, 655–663, doi: 10.1002/ana.22271 (2011). [DOI] [PMC free article] [PubMed] [Google Scholar]
- Pellecchia M. T. et al. Serum epidermal growth factor predicts cognitive functions in early, drug-naive Parkinson’s disease patients. J Neurol 260, 438–444, doi: 10.1007/s00415-012-6648-6 (2013). [DOI] [PubMed] [Google Scholar]
- La Cognata V., D’Agata V., Cavalcanti F. & Cavallaro S. Splicing: is there an alternative contribution to Parkinson’s disease? Neurogenetics 16, 245–263, doi: 10.1007/s10048-015-0449-x (2015). [DOI] [PMC free article] [PubMed] [Google Scholar]
- Alieva A. et al. Involvement of endocytosis and alternative splicing in the formation of the pathological process in the early stages of Parkinson’s disease. Biomed Res Int 2014, 718732, doi: 10.1155/2014/718732 (2014). [DOI] [PMC free article] [PubMed] [Google Scholar]
- Glatt S. J., Cohen O. S., Faraone S. V. & Tsuang M. T. Dysfunctional gene splicing as a potential contributor to neuropsychiatric disorders. Am J Med Genet B Neuropsychiatr Genet 156B, 382–392, doi: 10.1002/ajmg.b.31181 (2011). [DOI] [PMC free article] [PubMed] [Google Scholar]
- Zou X. D., Guo S. Q., Hu Z. W. & Li W. L. NAMPT protects against 6-hydroxydopamine-induced neurotoxicity in PC12 cells through modulating SIRT1 activity. Mol Med Rep, doi: 10.3892/mmr.2016.5034 (2016). [DOI] [PubMed] [Google Scholar]
- Fukuhara A. et al. Visfatin: a protein secreted by visceral fat that mimics the effects of insulin. Science 307, 426–430, doi: 10.1126/science.1097243 (2005). [DOI] [PubMed] [Google Scholar]
- Ji H. F., Zhuang Q. S. & Shen L. Genetic overlap between type 2 diabetes and major depressive disorder identified by bioinformatics analysis. Oncotarget, doi: 10.18632/oncotarget.8202 (2016). [DOI] [PMC free article] [PubMed] [Google Scholar]
- Kan C. et al. Genetic overlap between type 2 diabetes and depression in Swedish and Danish twin registries. Mol Psychiatry, doi: 10.1038/mp.2016.28 (2016). [DOI] [PMC free article] [PubMed] [Google Scholar]
- Locascio J. J. et al. Association between alpha-synuclein blood transcripts and early, neuroimaging-supported Parkinson’s disease. Brain 138, 2659–2671, doi: 10.1093/brain/awv202 (2015). [DOI] [PMC free article] [PubMed] [Google Scholar]
- Abele M., Riet A., Hummel T., Klockgether T. & Wullner U. Olfactory dysfunction in cerebellar ataxia and multiple system atrophy. J Neurol 250, 1453–1455, doi: 10.1007/s00415-003-0248-4 (2003). [DOI] [PubMed] [Google Scholar]
- Doty R. L. Olfaction in Parkinson’s disease and related disorders. Neurobiol Dis 46, 527–552, doi: 10.1016/j.nbd.2011.10.026 (2012). [DOI] [PMC free article] [PubMed] [Google Scholar]
- Kupershmidt I. et al. Ontology-based meta-analysis of global collections of high-throughput public data. PLoS One 5, doi: 10.1371/journal.pone.0013066 (2010). [DOI] [PMC free article] [PubMed] [Google Scholar]
- Takao K. & Miyakawa T. Genomic responses in mouse models greatly mimic human inflammatory diseases. Proc Natl Acad Sci USA 112, 1167–1172, doi: 10.1073/pnas.1401965111 (2015). [DOI] [PMC free article] [PubMed] [Google Scholar]
- The Parkinson Progression Marker Initiative (PPMI). Prog Neurobiol 95, 629–635, doi: 10.1016/j.pneurobio.2011.09.005 (2011). [DOI] [PMC free article] [PubMed] [Google Scholar]
- Falkenberg V. R., Whistler T., Murray J. R., Unger E. R. & Rajeevan M. S. Identification of Phosphoglycerate Kinase 1 (PGK1) as a reference gene for quantitative gene expression measurements in human blood RNA. BMC Res Notes 4, 324, doi: 10.1186/1756-0500-4-324 (2011). [DOI] [PMC free article] [PubMed] [Google Scholar]
Associated Data
This section collects any data citations, data availability statements, or supplementary materials included in this article.