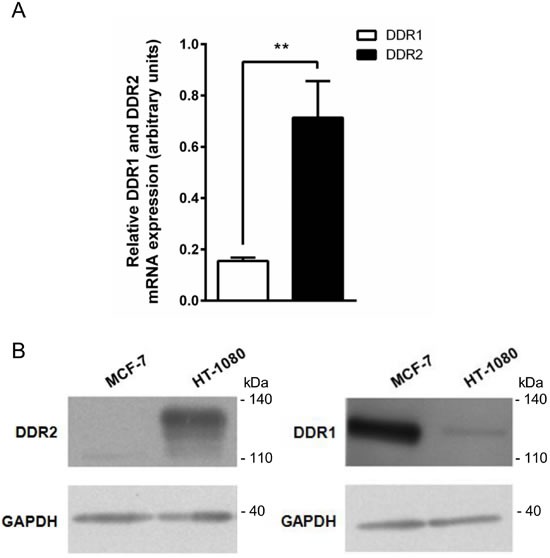
Figure 5. DDR1 and DDR2 expression in HT-1080 and MCF-7 cells.

HT-1080 and MCF-7 cells were cultured on plastic. A. DDR2 and DDR1 transcripts contents in HT-1080 cells were evaluated by real-time quantitative polymerase chain reaction. B. DDR2 (left panel) and DDR1 (right panel) protein expression was analyzed by western blot. Glyceraldehyde 3-phosphate dehydrogenase (GAPDH) was used as a loading control. Data shown are representative of three independent experiments (**p < 0.01, ***p < 0.001).
