Figure 2. Survival curves.

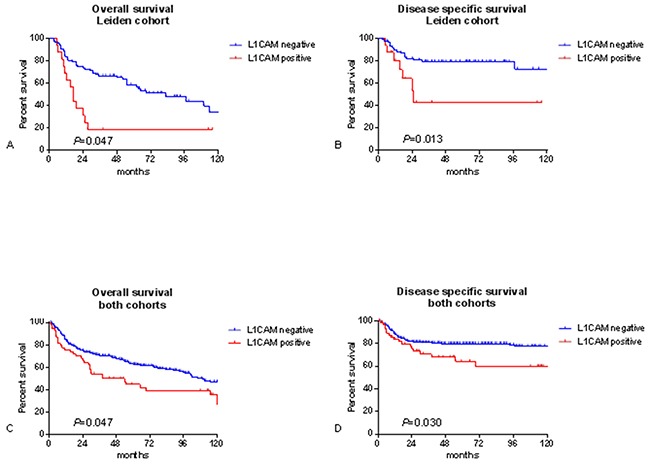
Kaplan meier survival curves for the leiden cohort, n=103 A, B. and both cohorts combined, n=348 C, D. P-values for log-rank test.

Kaplan meier survival curves for the leiden cohort, n=103 A, B. and both cohorts combined, n=348 C, D. P-values for log-rank test.