Abstract
Vertical sounding measurements within stratocumuli during two aircraft field campaigns, Marine Stratus/stratocumulus Experiment (MASE) and Physics of Stratocumulus Top (POST), are used to validate Moderate Resolution Imaging Spectroradiometer (MODIS) cloud optical thickness (COT), cloud liquid water path (LWP), and cloud effective radius (r e). In situ COT, LWP, and r e were calculated using 5 m vertically averaged droplet probe measurements of complete vertical cloud penetrations. MODIS COT, LWP, and r e 1 km pixels were averaged along these penetrations. COT comparisons in POST showed strong correlations and a near 1:1 relationship. In MASE, comparisons showed strong correlations; however, MODIS COT exceeded in situ COT, likely due to larger temporal differences between MODIS and in situ measurements. LWP comparisons between two cloud probes show good agreement for POST but not MASE, giving confidence to POST data. Both projects provided strong LWP correlations but MODIS exceeded in situ by 14–36%. MODIS in situ r e correlations were strong, but MODIS 2.1 µm r e exceeded in situ r e, which contributed to LWP bias; in POST, MODIS r e was 20–30% greater than in situ r e. Maximum in situ r e near cloud top showed comparisons nearer 1:1. Other MODIS r e bands (3.7 µm and 1.6 µm) showed similar comparisons. Temporal differences between MODIS and in situ measurements, airplane speed differences, and cloud probe artifacts were likely causes of weaker MASE correlations. POST COT comparison was best for temporal differences under 20 min. POST data validate MODIS COT but it also implies a positive MODIS r e bias that propagates to LWP while still capturing variability.
Keywords: remote sensing validation, stratocumulus optical depth, stratocumulus effective radius, cloud liquid water path, northeastern Pacific stratocumulus, cloud microphysics
Key Points
MODIS COT is validated by POST vertical sounding within 20 min of satellite
MODIS effective radius overestimates mean cloud in situ effective radius
Effective radius errors propagate to calculations of LWP
1. Introduction
Clouds tend to dominate radiative fluxes and greatly influence regional and global climate [Cess et al., 1989]. Cloud depths and droplet number concentrations (N c) determine the efficiency of radiation reflection. N c depends on precloud aerosol—cloud condensation nuclei (CCN) concentrations (N CCN) [e.g., Hudson and Noble, 2009, 2014a, hereinafter HN14a; Hudson et al., 2009, 2010]. Higher N CCN leads to higher N c with smaller sizes [e.g., HN14a], i.e., the indirect aerosol effect (IAE) [Twomey, 1977]. This increase in N c leads to an increase in cloud reflection and a reduction in surface radiative forcing [Twomey, 1991], which reduces regional or global temperatures. Stratus clouds, which cover vast oceanic areas, are the most susceptible to IAE due to the large contrast between ocean and cloud albedo; and thus, they play the largest role in climate change.
In situ aircraft measurements of clouds during field campaigns provide high‐resolution measurements to study cloud microphysics involved with IAE [e.g., Hudson et al., 2009; Hudson and Noble, 2009; Hudson et al., 2010; Wood et al., 2011; Chen et al., 2012; HN14a]. However, this high‐resolution data require too much processing for use in global climate models (GCMs) where the spatial resolution is lower and individual clouds cannot be resolved. Also, these campaigns are selective in their study area and types of clouds. Thus, bulk parameterization [Hu and Stamnes, 1993; Dandin et al., 1997] of clouds is used to simulate cloud properties and microphysical processes.
Satellite remote sensing provides an observation platform of daily global data sets over long periods that can aide parameterizing and understanding cloud microphysics. MODIS (Moderate Resolution Imaging Spectroradiometer) is a whisk broom‐type sensor on board NASA (National Aeronautics and Space Administration) satellites Terra and Aqua that receive electromagnetic radiation spectra (36 channel; visible to thermal) reflected from the surface and atmosphere [GSFC/NASA, 2015]. Information retrieved from various MODIS spectral bands can then be used to calculate cloud radiative and microphysical properties such as cloud optical thickness (COT), cloud liquid water path (LWP), and cloud droplet effective radius (r e) [Platnick et al., 2003]. COT, LWP, and r e are used as bulk cloud microphysics in GCMs [Boucher, 1995], but they are also important for calculations of the radiation budget [Slingo, 1990; Hu and Stamnes, 1993] and are used for comparisons to GCM outputs [Rotstayn and Liu, 2003; Ban‐Weiss et al., 2014]. NASA processes these algorithms to provide the variables as part of the MODIS cloud product conveniently available for researchers [e.g., Wood and Hartmann, 2006; Chen et al., 2012].
Satellite Terra is scheduled to cross north to south at the equator in the morning while satellite Aqua is scheduled to cross south to north at the equator in the afternoon [GSFC/NASA, 2015], thus yielding differing solar angles and intensities. Differing diabatic effects from morning to afternoon could create cloud microphysical variations that produce inhomogeneities and cloud shadows (3‐D effects). Such inhomogeneities affect the accuracy of MODIS retrieval algorithms [Zhang and Platnick, 2011, hereinafter ZP11; Painemal et al., 2013]. Also, due to the whisk broom‐type sensor, the increased satellite angle away from nadir leads to reduced photons received by MODIS and thus pixel distortions near edges. However, in situ aircraft cloud measurements provide a platform on which MODIS algorithms can be compared [Platnick and Valero, 1995; Painemal and Zuidema, 2011 (hereinafter PZ11); Zheng et al., 2011; Min et al., 2012, hereinafter M12].
Extensive MODIS‐derived cloud product validations were carried out by PZ11 and M12 in stratus/stratocumulus in the southeast Pacific. Both concluded that MODIS‐derived r e and LWP are positively biased for these clouds. However, PZ11 determined that cloud inhomogeneities were not a large factor of the bias for their comparisons with 5 square km MODIS pixels. While M12 also used 5 square km, they added analysis using 25 square km that could lead to more cloud inhomogeneity bias. Time differences between in situ data and MODIS retrievals could lead to comparison differences due to cloud advection or changes in cloud dynamics. M12 used trajectory analysis to account for this advection, whereas PZ11 adjusted for advection by using mean vertical profiles of wind. Both PZ11 and M12 noted the best comparisons between MODIS‐derived N c with in situ N c, and PZ11 noted good COT comparisons. Overall, there were high LWP and r e correlations (R), but r e bias was approximately 15–20% [PZ11; M12].
Two aircraft stratus cloud field campaigns off the central California coast (northeast Pacific) are used here for validation of MODIS‐derived cloud variables, COT, LWP, and r e. The MArine Stratus/stratocumulus Experiment (MASE) [Wang et al., 2009; HN14a; Hudson et al., 2015] field campaign took place in July 2005 with flights to the west of Monterey and Point Reyes, northwest of San Francisco, California (Figure 1, red). Solid stratus was consistent during MASE with few cases of stratocumulus. Research flights were by the Department of Energy Gulfstream 1 (G1) airplane. The Physics of Stratocumulus Top (POST) [Hudson et al., 2010; Carman et al., 2012; Gerber et al., 2013; HN14a; Hudson and Noble, 2014b] field campaign took place in July and August 2008 with most flights farther to the west of Monterey, California (Figure 1, black) than MASE, but no flights near Point Reyes. Stratocumulus clouds dominated in POST where research flights were done by the Center for Interdisciplinary Remotely‐Piloted Aircraft Studies (CIRPAS) Twin Otter (TO) airplane. Both field campaigns had similar cloud, aerosol, and precipitation spectrometers (CAPS, Droplet Measurement Technologies, Boulder, Colorado). Vertical cloud penetrations are needed to calculate COT, LWP, and r e from cloud droplet spectra. This study aims to validate these MODIS cloud variables for stratus/stratocumulus of the northeast Pacific during these campaigns.
Figure 1.
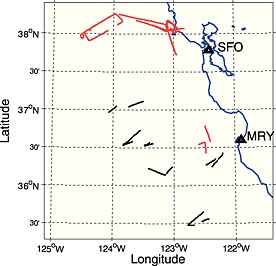
Map of vertical profiles for both POST (black) and MASE (red) in the East Pacific off the California coast. San Francisco (SFO) and Monterey (MRY) are labeled.
2. Measurements and Calculations
In situ measurements are from soundings of entire cloud depths. MASE had 20 such soundings during 10 midday G1 research flights of 15–27 July 2005. POST had more than 50 such soundings during eight TO midday flights between 16 July and 15 August 2008. However, some soundings could not be used because they occurred at far different times than the MODIS retrievals. Data were collected from Terra and Aqua MODIS instruments for retrieval swaths that occurred during these 10 MASE and 8 POST flights. Only MODIS data swaths containing the entire study area (flight track) for that day are used, and data swaths were discarded if the flight path was within the scan edge where pixels are distorted. Soundings with the smallest time differences were used for comparisons (Tables 1 and 2, column 12). Seven of the POST research flights had just one usable data swath while one flight, 4 August, had two usable swaths, one from each satellite. Two vertical soundings were within a few minutes of a swath on two POST flights (16 July and 4 August); thus, there are a total of 11 POST cases (three Terra and eight Aqua, Table 1). Three cloud penetrations were within a few minutes of the data swath from 19 July 2005, and there was one for every other flight, so there are 12 MASE cases (nine Terra and three Aqua, Table 2). Figure 1 shows the locations of these soundings for POST (black) and MASE (red).
Table 1.
POST Flight Dates and Corresponding Julian Day, Which Satellite, Swath Time of the Satellite (UTC; PDT = UTC‐7), Begin and End Times of the in Situ Vertical Cloud Penetrations, Durations of the Vertical Cloud Penetrations, Number of Pixels Used in MODIS Along Path Average, Mean in Situ Cloud Droplet Concentrations (cm−3), Mean Drizzle Concentrations (cm−3), and Time Differences (Minutes) Between MODIS Satellite Swath Times and Mean Vertical Cloud Penetration Timesa
| POST Data # | Date | Julian Day | Satellite | Swath Time | In Situ Begin | In Situ End | Duration (min) | Pixel # | N c | Drizzle × 10−3 | dMin |
|---|---|---|---|---|---|---|---|---|---|---|---|
| 1 | 16 Jul | 198 | Aqua | 21:25 | 21:17:00 | 21:24:00 | 7 | 11 | 215 | 1.48 | 4.5 |
| 2 | 16 Jul | 198 | Aqua | 21:25 | 21:24:00 | 21:29:00 | 5 | 4 | 202 | 9.58 | −1.5 |
| 3 | 17 Jul | 199 | Terra | 18:50 | 18:41:00 | 18:45:30 | 4.5 | 7 | 186 | 10.8 | 6.8 |
| 4 | 21 Jul | 203 | Aqua | 21:40 | 20:59:00 | 21:06:00 | 7 | 6 | 49 | 30.4 | 37.5 |
| 5 | 30 Jul | 212 | Aqua | 21:35 | 21:20:30 | 21:24:00 | 3.5 | 6 | 77 | 23.7 | 12.8 |
| 6 | 1 Aug | 214 | Aqua | 21:25 | 21:07:30 | 21:19:30 | 12 | 23 | 127 | 28.6 | 11.5 |
| 7 | 4 Aug | 217 | Terra | 18:35 | 18:11:00 | 18:26:30 | 15.5 | 8 | 221 | 28.4 | 16.3 |
| 8 | 4 Aug | 217 | Aqua | 21:55 | 21:54:00 | 21:58:30 | 4.5 | 5 | 271 | 0.546 | −1.3 |
| 9 | 4 Aug | 217 | Aqua | 21:55 | 21:58:30 | 22:03:00 | 4.5 | 4 | 292 | 1.85 | −5.8 |
| 10 | 14 Aug | 227 | Terra | 19:15 | 19:05:00 | 19:12:30 | 7.5 | 16 | 148 | 17.4 | 6.3 |
| 11 | 15 Aug | 228 | Aqua | 21:35 | 20:33:00 | 20:38:00 | 5 | 5 | 190 | 1.26 | 59.5 |
| Mean and standard deviation | 6.9 ± 3.7 | 8.6 ± 5.9 | 180 ± 74.8 | 14.0 ± 12.1 | 15.0 ± 17.9 | ||||||
Project mean and standard deviations on last row.
Table 2.
As in Table 1 but for MASE
| MASE Data # | Date | Julian Day | Satellite | Swath Time | In Situ Begin | In Situ End | Duration (min) | Pixel # | N c | Drizzle × 10−3 | dMin |
|---|---|---|---|---|---|---|---|---|---|---|---|
| 1 | 15 Jul | 196 | Aqua | 21:25 | 19:04:33 | 19:08:54 | 4.4 | 22 | 241 | 1.11 | 138.3 |
| 2 | 16 Jul | 197 | Terra | 18:55 | 19:41:30 | 19:45:25 | 3.9 | 15 | 225 | 1.20 | −48.5 |
| 3 | 17 Jul | 198 | Aqua | 21:15 | 19:40:03 | 19:53:20 | 13.3 | 9 | 230 | 1.79 | 88.3 |
| 4 | 18 Jul | 199 | Terra | 18:40 | 19:35:52 | 19:50:51 | 15.0 | 82 | 185 | 7.21 | −63.4 |
| 5 | 19 Jul | 200 | Terra | 19:25 | 19:00:10 | 19:15:30 | 15.3 | 40 | 151 | 10.4 | 17.2 |
| 6 | 19 Jul | 200 | Terra | 19:25 | 19:18:00 | 19:26:14 | 8.2 | 26 | 151 | 6.35 | 2.9 |
| 7 | 19 Jul | 200 | Terra | 19:25 | 19:26:14 | 19:29:42 | 3.5 | 17 | 156 | 10.1 | −3.0 |
| 8 | 20 Jul | 201 | Terra | 18:30 | 19:11:25 | 19:15:55 | 4.5 | 9 | 235 | 4.26 | −43.7 |
| 9 | 22 Jul | 203 | Aqua | 21:30 | 19:40:46 | 19:46:56 | 6.2 | 3 | 190 | 0.463 | 106.2 |
| 10 | 23 Jul | 204 | Terra | 19:00 | 16:59:16 | 17:10:58 | 11.7 | 34 | 306 | 0.610 | 114.9 |
| 11 | 25 Jul | 206 | Terra | 18:50 | 19:28:31 | 19:50:42 | 22.2 | 83 | 366 | 0.00 | −49.6 |
| 12 | 27 Jul | 208 | Terra | 18:35 | 16:52:07 | 17:19:53 | 27.8 | 121 | 289 | 1.38 | 89.0 |
| Mean and standard deviation | 11.3 ± 7.8 | 38 ± 37 | 227 ± 67.0 | 3.74 ± 3.83 | 63.8 ± 44.3 | ||||||
One Hertz data from similar CAPS probes were used on board the TO during POST and the G1 during MASE [HN14a]. Cloud droplets were measured by cloud and aerosol spectrometer (CAS) parts of CAPS, size range 0.58–51 µm diameter. Drizzle drops were measured by cloud imaging probes (CIP) of CAPS, range 50–1500 µm diameter. Since vertical cloud penetrations were more frequent in POST, time differences between penetrations and MODIS swaths were less than 20 min (Table 1, column 12; except 21 July and 15 August). The less frequent MASE vertical cloud penetrations pushed the majority of the time differences between the in situ and MODIS data to greater than 30 min (Table 2, column 12). The mean interval between swath and penetration was 15 min in POST compared to 64 min in MASE with medians of 7 and 57 min. Cloud r e, LWP, and COT for the in situ vertical penetrations were computed using combined cloud droplet (CAS) and drizzle drop (CIP) distributions. Cloud threshold was 0.01 g/m3 CAS spectra liquid water content (LWC). The vertical averaging step was 5 m. Examples of 5 m averaged vertical N c (#/cm3) are shown in Figure 2 (black), using both cloud probes (CAS and CIP). Since drizzle differences can alter in‐cloud radiative properties, Figure 2 depicts a high drizzle POST case (30 July, Figure 2a, mean latitude 35.54 N, longitude 122.49 W) and a weaker POST drizzle case (15 August, Figure 2b, mean latitude 36.31 N, longitude 122.39 W). Figure 2 also displays the 5 m averaged CAS vertical LWC in g/m3 scaled up by a factor of 100 (red). As expected, LWC increased with altitude; N c was mostly constant with altitude for the weak drizzle case (Figure 2b) but fluctuated for the high drizzle case (Figure 2a). Columns 10 and 11 of Tables 1 and 2 show mean N c and drizzle for the vertical cloud penetrations. Vertical distributions of 5 m averaged cloud r e for the same vertical cloud penetrations are shown in Figure 3. Figure 3a r e spikes indicate drizzle. In the weak drizzle case (Figure 3b), the maximum r e occurs near cloud top as expected for more adiabatic clouds. Tables 1 and 2, column 8, show durations of the vertical cloud penetrations. Longer durations occurred when brief horizontal legs were included in vertical penetrations. Mean durations indicate fewer such interruptions in POST. Also, the G1 apparently climbed or descended faster than 5 m/s so that some 5 m altitude bins did not contain a measurement; i.e., there were vertical distribution gaps in MASE but no such gaps in POST. While these gaps did not distort the calculations, the greater number of vertical samples in POST better represented the clouds. The greater G1 speed than the TO (100 m/s compared to 55 m/s) probably created the faster climbing and descending rates.
Figure 2.
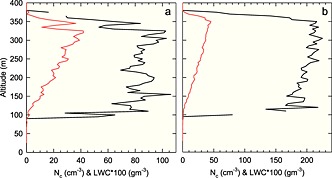
Sample vertical profiles of 5 m averaged cloud droplet concentrations (N c) (black) and liquid water content (LWC) scaled by 100 (red). (a) From the vertical cloud penetration used for POST research flight of 30 July 2008 21:20:30–21:24:00 UTC with mean latitude 35.54 N and longitude 122.49 W and (b) from the vertical cloud penetration used for POST research flight of 15 August 2008 20:33:00–20:38:00 UTC with mean latitude 36.31 N and longitude 122.39 W (local time, Pacific daylight time (PDT) = UTC 7). Figure 2a shows a drizzle case, while Figure 2b has little drizzle.
Figure 3.
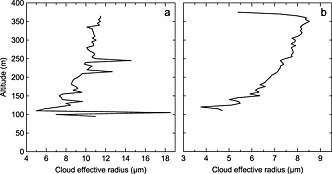
Sample vertical profiles of 5 m averaged cloud droplet effective radius (r e) (a) from the vertical cloud penetration used for POST research flight of 30 July 2008 21:20:30–21:24:00 UTC and (b) from the vertical cloud penetration used for POST research flight of 15 August 2008 20:33:00–20:38:00 UTC. Figure 3a is from a drizzle case, while Figure 3b has little drizzle.
The MODIS level 2 cloud product provided r e, LWP, and COT with 1 km resolution. Figure 4 shows an example of MODIS 2.1 µm derived r e for the MASE study area on 19 July 2005. The black line indicates the G1 flight path during the 19:26:14–19:29:42 UTC vertical cloud penetration. Latitudes and longitudes along the vertical soundings were used to select MODIS data. The MODIS pixel nearest the mean coordinates of each sounding (single midpoint pixel, SMP) was selected as an initial comparison to the calculated in situ values. However, one pixel does not describe the full set of cloud variations that the airplanes flew through as they ascended or descended; i.e., the airplanes traveled significant horizontal distances during each vertical penetration (Figures 1 and 4). Therefore, MODIS pixels along the horizontal path of the vertical penetrations were selected. Latitudes and longitudes of the 1 s aircraft data were averaged over 1 km distances, and cloud sections were used to select MODIS pixels closest to the flight paths of the vertical penetrations. These were then averaged (along path MODIS pixel average, PPA) for r e, LWP, and COT. These 1 km wide tracks best represented the cloud microphysical variations that the aircraft had encountered. Larger widths, 5 km [e.g., PZ11, M12], are more likely to introduce cloud field inhomogeneities. The full cloud depth that the airplane flew through is needed to accurately calculate in situ COT, LWP, and mean cloud r e, for comparisons with the full PPA accountings of the horizontal variability of the vertical soundings. Tables 1 and 2, column 9, show the numbers of pixels that were averaged for the PPA of each sounding. While these pixel counts are somewhat related to the sounding durations (column 8), they represent only the time that the aircraft was within cloud and not the spaces between clouds, above cloud, below cloud, or when the MODIS cloud product provided no data for those pixels (lack of cloud cover in MODIS). Large numbers of pixels in MASE represent longer in‐cloud durations that provided more opportunities for cloud inhomogeneities.
Figure 4.
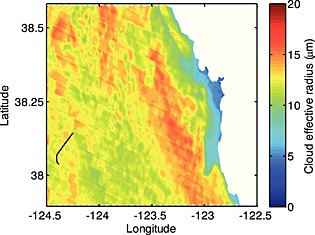
Sample of 1 km MODIS effective radius (r e) in the MASE study area for 19 July 2005 taken from the TERRA MODIS cloud product at 19:25 UTC. Black line represents the G1 flight path for the vertical cloud penetration at 19:26:14–19:29:42 UTC.
3. Cloud Optical Thickness
COT is important due to its strong relationship with cloud reflectivity [Twomey, 1991], implications for global radiative balance [Slingo, 1990], and thus climate. Figure 5 compares the COT MODIS measurements with COT calculated from in situ measurements; black is SMP, red is PPA. POST comparisons (Figure 5a) show strong correlations (R) for both SMP and PPA with both data sets near the 1:1 line (slope, k ~ 1.0). Averaging over many pixels (PPA, red) does not improve R or put k closer to 1.0. This could be partly due to time differences between the vertical penetrations and the MODIS swaths. If only data within 20 min (from Table 1, POST) of the MODIS swaths are considered (9 of the 11 PPA points), R improves to 0.95 and k decreases to 1.01, which is similar to the SMP values for all 11 data. For these corresponding nine SMP points, R is still 0.96 but k goes up to 1.06.
Figure 5.
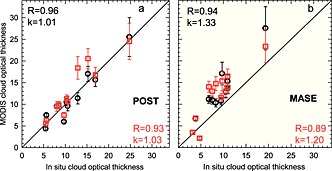
MODIS single midpoint pixel (SMP; black) and along path pixel average (PPA; red) cloud optical thickness (COT) compared with in situ COT from vertical cloud penetration measurements. (a) POST and (b) MASE. R is linear correlation coefficient; k is slope of linear regression. MODIS COT uncertainty product for SMP and PPA multiplied by corresponding COT is used for error bars.
Figure 5b also shows high R for both SMP and PPA in MASE and like POST higher R for SMP, but lower R than POST for both SMP and PPA. Most MASE SMP and PPA data lie noticeably above the 1:1 line with especially higher ks than POST. This MASE bias is partly due to large time separations between the in situ and satellite measurements. Table 2 (MASE) shows that unlike Table 1 (POST) most of the compared data were more than 30 min apart with only two such cases in POST. Thus, the mean separation time is a factor of 4 higher in MASE. Attempts to ameliorate large time separation errors in MASE used mean horizontal wind speeds from the soundings to advect the sounding path forward or backward within the MODIS cloud field (Table 2, column 12). This procedure is similar to PZ11 and M12. While the intention was to improve PPA comparisons, this produced weaker correlations and similar bias; thus, it is not presented. Typical dynamics of increased heating later in the day should lead to thicker clouds with larger cloud droplets (i.e., increased COT) that would provide the positive bias seen in MASE for MODIS times later than in situ times. However, only 5 of the 12 MASE vertical profiles have large positive time differences (Table 2, last column). Four of the 12 vertical profiles have large negative time differences from MODIS times, although these are not as large as the positive time differences (i.e., positive: 88.3 to 138.3 versus negative: −43.7 to −63.4, Table 2, last column). Although negative time differences should show bias toward the in situ measurements, they do not (Figure 5). However, low relative humidity and warm temperatures above cloud along with greater entrainment could reduce cloud water and COT [Ackerman et al., 2004; Hudson et al., 2015], which could create a MODIS bias. Greater time differences in MASE would facilitate dynamic or microphysical cloud modifications.
Table 3 shows MASE PPA regression characteristics for MODIS data comparisons for various numbers of vertical cloud penetrations. Since there were only 20 MASE vertical cloud penetrations whereas there were more than 50 POST penetrations, it was easier to select POST penetrations closer to MODIS retrievals. The first row includes weaker PPA comparisons that use all penetrations with all available retrievals where some penetrations are twice used (26) to compare to two swaths for this demonstration. The regression of the second row has no duplicate soundings, just each cloud penetration compared to the nearest MODIS swath; these regressions are better but not as good as subsequent rows. The PPA regressions improve by using the closest (row 3, Table 3, also shown in Figure 5b) vertical penetrations to each MODIS swath (12). By removing the two data points with the greatest separation times, 138 and 115 min (rows 1 and 10, Table 2; rows 4 and 5, Table 3), the regressions are nearly identical but there is improvement of the lower intercept (b) in row 5 (Table 3). Further removal of the next greatest time separation (106 min, row 9, Table 2; last row, Table 3) does not affect R but does improve k though b is increased, which indicates a predisposed overestimation. Two‐tailed significance levels for all R are high (last column), and adjusted R values [Hudson and Noble, 2014b] are only 1 or 2 points lower than R.
Table 3.
MASE Regressions for Along Path Pixel (PPA) Averaged Cloud Optical Thickness (COT) Versus in Situ COT for Various Collections of Vertical Cloud Penetration Data Points (#)a
| # | b | k | R | sl | |
|---|---|---|---|---|---|
| All | 26 | 3.20 | 0.93 | 0.73 | 99.998 |
| No duplicates | 20 | 2.38 | 1.03 | 0.78 | 99.995 |
| Closest | 12 | 1.74 | 1.20 | 0.89 | 99.989 |
| <120 min | 11 | 1.76 | 1.19 | 0.89 | 99.976 |
| <110 min | 10 | 1.58 | 1.20 | 0.88 | 99.922 |
| <100 min | 9 | 3.69 | 1.04 | 0.89 | 99.870 |
All is all data points for all vertical cloud penetrations most of which are not considered in Figure 5b. No duplicates is all vertical cloud penetrations compared with just the closest MODIS retrievals; Closest denotes only the closest vertical penetrations per swath except 19 July (Figure 5b); <120 min is also the closest and less than 120 min temporal differences and so on. b is intercept; k is slope; R is correlation coefficient; and sl is two‐tailed significance level.
Other sources of error include in situ measurement errors (more on this in section 4) and different durations of vertical cloud penetrations and different airplane climbing and descending rates. Tables 1 and 2 show mean cloud penetration durations almost a factor of 2 greater in MASE. As previously noted, MASE altitude changes were apparently sometimes greater than 5 m/s, which precluded samples within every 5 m bin. Although CAS can provide higher sampling rates, the CIP cannot, thus limiting complete sample rates to 1 Hz. TO slower climb rates, lower flight speed, and larger numbers of vertical cloud penetrations provided better COT comparisons in POST.
The good PPA comparisons in POST seemed to validate MODIS COT measurements because PPA accounts for horizontal differences over the flight paths of the vertical cloud penetrations. Also, the very strong R (0.95) of just those instances where the temporal differences of the measurements were less than 20 min further validates the PPA comparisons. While MASE had a strong R (0.89), validation is less significant due to the high k and large temporal difference between MODIS and in situ measurements.
4. Cloud Liquid Water Path
LWP from the MODIS cloud product is derived from the mathematical definition of r e [Han et al., 1997]. LWP can be calculated from MODIS‐derived r e and COT. However, this LWP is often positively biased [Han et al., 1994; Platnick, 2000, hereinafter P00] and has been suggested to describe only a vertically homogeneous cloud structure [Borg and Bennartz, 2007]. Better comparisons with in situ measurements of marine stratus clouds are obtained by shifting the coefficient of 2/3, as derived from the mathematical relationships, in the LWP calculation [Slingo, 1990; Han et al., 1997; P00] to 5/9 (a factor of 5/6), which has been suggested for cloud stratification (Figures 2 and 3); i.e., r e increasing vertically [Wood and Hartmann, 2006; Borg and Bennartz, 2007; Seethala and Horvath, 2010; PZ11]. Figure 6 shows MODIS‐derived vertically stratified LWP comparisons with in situ measurements.
Figure 6.
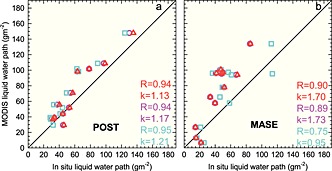
MODIS along path pixel average (PPA; red) liquid water path (LWP) using the stratified assumption (5/9) compared with in situ LWP calculated from the CAS + CIP probe (red), CAS probe (pink), and PVM probe (cyan). (a) POST and (b) MASE. R is linear correlation coefficient; k is slope of linear regression.
Apart from the time differences mentioned in section 3, another reason for COT and LWP differences between POST and MASE could be differences in the CAS and CIP probes. MASE COT bias could be due to probe calibration issues. A Particulate Volume Monitor (PVM; Gerber Scientific) probe operated throughout all flights of both projects. The PVM measures the volume of water droplets in the nominal size range 3–50 µm. LWP can be calculated by using the 5 m vertical average bands, multiplying by 5 m and summing the columns for the LWC of both probes. Again, CAS LWC threshold 0.01 g/m3 is applied. Once the LWP for each sounding is obtained, a comparison can be made with the MODIS PPA LWP.
The combined CAS and CIP LWP data for both POST and MASE are less than the MODIS PPA data (Figure 6, red). Comparing the two probes in POST (Figure 6a) shows that the CAS (pink) is similar yet in some cases slightly less than the CAS + CIP (red), and the PVM (cyan) is comparable but even lower. These comparisons show similar patterns with respect to MODIS LWP. The R for all three is high, and all have similar shapes and slopes. More confidence is created because of the agreement of the two probes in POST. MODIS contains a mean positive LWP bias for all three probes for both the vertically homogenous and stratified assumptions (Table 4, rows 1 and 2). The PVM has the highest ratio of MODIS to in situ measurements followed by the CAS and then CAS + CIP. While the stratified assumption is better, the mean positive bias is still 14% for the CAS + CIP.
Table 4.
Mean Liquid Water Path (LWP) Bias Ratios of MODIS‐Derived LWP to In Situ LWP Using CAS + CIP Probes, PVM Probe, and CAS Only Probe for POST and MASEa
| # | CAS + CIP | PVM | CAS | |
|---|---|---|---|---|
| POST (VH) | 11 | 1.37 ± 0.29 | 1.58 ± 0.28 | 1.41 ± 0.30 |
| POST (S) | 11 | 1.14 ± 0.24 | 1.32 ± 0.24 | 1.18 ± 0.25 |
| MASE (VH) | 12 | 1.91 ± 0.68 | 1.63 ± 0.76 | 1.93 ± 0.69 |
| MASE (S) | 12 | 1.59 ± 0.57 | 1.36 ± 0.63 | 1.61 ± 0.58 |
| POSTc (VH) | 11 | 1.13 ± 0.22 | ‐‐ | ‐‐ |
| POSTc (VH)* | 10 | 1.08 ± 0.17 | ‐‐ | ‐‐ |
| POSTc (S) | 11 | 0.94 ± 0.18 | ‐‐ | ‐‐ |
| POSTc (S)* | 10 | 0.90 ± 0.14 | ‐‐ | ‐‐ |
| POSTc (I) | 11 | 1.07 ± 0.20 | ‐‐ | ‐‐ |
| POSTc (I)* | 10 | 1.02 ± 0.15 | ‐‐ | ‐‐ |
VH is for a vertically homogenous assumption (2/3) while S is for a stratified assumption (5/9), and I is for an intermediate assumption (0.6); c is for POST MODIS LWP using MODIS r e corrected for mean cloud r e , and asterisk removes the data with the greatest time separation in Table 1.
Probe comparisons in MASE (Figure 6b) show that the PVM (cyan) usually measures an LWP larger than the CAS (pink) or even the combined CAS + CIP (red). This suggests that the CAS or PVM may be miscalibrated, especially for larger droplets that carry more LWC. Whatever the reason, the lack of agreement suggests that part of the MASE data set bias in COT and LWP may be due to probe inconsistencies. The LWP ratios show a positive MODIS bias with all probe data but less so for the PVM (Table 4, rows 3 and 4). However, the PVM comparison has a smaller R (0.75) than the CAS (0.89) or CAS + CIP (0.90), and the stratified MODIS to PVM ratio shows a bias of 36%. Similar to MASE COT, temporal differences probably explain part of this bias and lower correlations. Comparisons of stratified MODIS to PVM LWP ratios to the time difference between MODIS and the vertical penetrations (Table 2, last column) show a decreasing trend with an R of 0.61. Furthermore, corrections applied for advection did not improve the comparisons.
While differences in COT between POST and MASE may be explained by cloud probe artifacts or faulty MASE calibrations, the agreement between cloud probes in POST indicates MODIS LWP bias. Because COT and r e are combined to calculate MODIS LWP, any bias would be passed on to LWP [PZ11]. Positive bias is lessened by reducing the coefficient from 2/3 to 5/9 but it still remains. PZ11 suggests that overestimation of MODIS r e is likely the cause of MODIS LWP bias. While MODIS captures similar variability of the cloud LWP from the POST probes, as denoted by the high R, the MODIS LWP bias is likely from MODIS‐derived r e, similar to PZ11, because POST COT comparisons showed no bias (Figure 5a, k ~ 1).
5. Cloud Effective Radius
MODIS overestimation of r e is likely the cause of MODIS LWP overestimation [PZ11]. Thus, validation of r e is important because errors could lead to inaccurate climate models or improper climate estimates. Since satellites look at the tops of clouds, calculated r e tends to characterize cloud tops [P00]. However, mean cloud r e is important for understanding true mean cloud characteristics and for calculation of LWP throughout entire cloud depths. Figure 7 shows comparisons of MODIS retrievals of 2.1 µm derived r e for both SMP and PPA in POST and MASE with mean cloud in situ r e from CAPS probes. Figure 7a shows strong R for both SMP and PPA in POST. However, MODIS r e estimates are significantly higher than mean in situ r e, i.e., the preponderance of data above the 1:1 line in both Figures 7a and 7b. POST shows even higher k than MASE. The lower R for MASE PPA again is likely due to greater temporal differences between MODIS and in situ measurements, and CAS calibration problems. The good variability agreement (high R) for POST suggests that MODIS is merely overestimating r e compared to the in situ measurements, this is consistent with PZ11 and M12. This could be due to the differences in measurement methods or sampling and processing techniques such as MODIS algorithm calculations.
Figure 7.
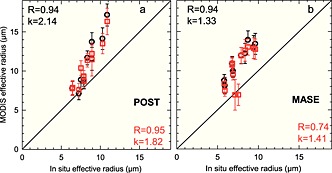
As in Figure 5 but for MODIS SMP (black) and PPA (red) effective radius (r e) compared with in situ r e. Error bars are similar to Figure 5 but from MODIS r e uncertainty.
Better agreement should be expected by using maxima in situ r e near cloud tops (i.e., within 50–70 m of cloud top, Figure 3) because the largest cloud droplets near cloud top exhibit the largest extinction coefficients where MODIS detects most of the scattering (Figure 8). This approach is similar to PZ11. In POST (Figure 8a), this reduces the high R for both SMP and PPA but puts the data closer to the 1:1 line; i.e., considerably reduced k. In MASE (Figure 8b), data are also closer to the 1:1 line (reduced ks) and R is also higher for both SMP and PPA. Improvements of the comparisons toward the 1:1 line by using the maximum in situ r e near cloud tops are expected [P00; PZ11], and this shows that MODIS r e does not correctly represent mean cloud properties but only properties near cloud top. Therefore, use of MODIS r e for calculation of LWP [P00; PZ11; M12] would as shown here produce overestimates. Clouds containing drizzle, where larger droplet cross‐sectional areas increase albedo [Twomey, 1977], can further influence mean cloud r e. Fortunately, drizzle is infrequently found near cloud tops. In some POST flights, drizzle was found below cloud, at the bottom of cloud, or near midcloud and was thus not detected by MODIS r e. Any indications of cloud microphysical processes, i.e., activation, evaporation, or coalescence, near cloud base are obscured by the cloud tops and lack of r e measurements down into the depths of the clouds.
Figure 8.
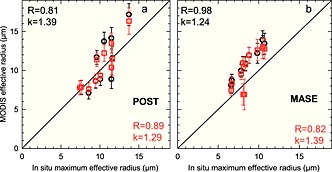
As in Figure 7 but using the 5 m averaged maximum in situ effective radius near cloud top from the vertical cloud penetrations.
P00 and PZ11 suggested that differences in cloud sensing depth can be obtained by using r e derived from other near infrared bands, i.e., the 3.7 µm band has a shallower sensing depth than the 2.1 µm band whereas the 1.6 µm band senses deeper. Figure 9a shows comparisons from POST of PPA r e retrievals from the 2.1 µm band from Figure 7a (red) and these two additional bands (3.7 µm, blue; 1.6 µm, green). The 3.7 µm band has the same R but higher k, while R for the 1.6 µm band is lower with k considerably closer to 1.0. However, it might be significant that the MODIS 1.6 µm r e is missing the highest r e data point. Figure 9b shows the relationship of the three PPA r e bands with maxima in situ r e near cloud tops as in Figure 8a. Here R for 1.6 µm r e is higher than Rs for 2.1 µm and 3.7 µm r e. This 0.95 R indicates an excellent representation of data variability. The k for all r e bands in Figure 9b is considerably closer to 1.0 than the corresponding ks of Figure 9a. This demonstrates that MODIS r e senses closer to cloud tops and thus does not represent mean cloud r e because higher k of Figure 9a displays greater bias. Variations in R for both mean cloud r e and r e near cloud top do not provide much information about the cloud vertical structure, although POST did contain more drizzle than MASE (Tables 1 and 2). However, these variations may be more of an indication of the broken cloud structure and inhomogeneities [ZP11] present in the stratocumuli of POST [HN14a].
Figure 9.
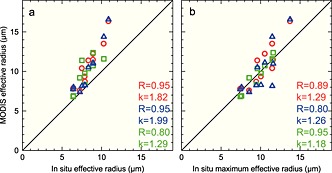
POST MODIS PPA r e at various channels (2.1 µm, red from Figure 7a; 3.7 µm, blue; 1.6 µm, green) compared to (a) in situ r e and (b) maximum r e near cloud top.
Figure 10 for MASE shows the same multiple band comparisons as Figure 9. Here both the 3.7 µm (blue) and 1.6 µm (green) bands for the mean cloud r e (Figure 10a) have lower R and k than the 2.1 µm r e (red) with 3.7 µm k even below 1.0. Here again the MODIS 3.7 µm band is missing one data point. R for the near cloud top in situ MASE r e (Figure 10b) shows the 3.7 µm band R higher than the 2.1 µm band, while R for 1.6 µm is lowest. The 3.7 µm band also has k closest to 1.0, although it is even less than 1.0 though it is not as low as the corresponding k of Figure 10a. Again, these R values provide little information about vertical cloud structure. However, the highest R value of the 3.7 µm r e for the near cloud top in situ r e is consistent with expectations for nondrizzling near homogeneous solid stratus clouds [P00; ZP11]. Differences are likely small due to the smaller r e [ZP11].
Figure 10.
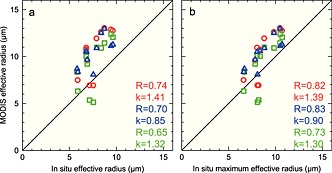
As in Figure 9 but for MASE.
In situ r e near cloud top maxima (ctm) show closer comparisons than mean in situ r e for POST and MASE (Table 5); mean ratios of MODIS r e to in situ ctm r e are closer to 1 (rows 2 and 4) than MODIS is to in situ mean r e (rows 1 and 2). Row 1 ratios are 20–30% (POST). For nondrizzling adiabatic clouds, the band ratio order should follow that displayed by MASE (3.7 µm > 2.1 µm > 1.6 µm) where the greatest penetrating wavelength (1.6 µm) shows the best (in these cases lowest ratio) agreement with in situ for mean and ctm, while the least cloud penetrating wavelength (3.7 µm) shows the worst (highest ratio) agreement with both in situ [PZ11]. The MASE results are consistent with the smaller drizzle amounts in MASE (HN14 and Tables 1 and 2, columns 11) that therefore do not reduce cloud adiabaticity. The violation of this band order ratio in POST (rows 1 and 2, Table 5), where the ratios for the least (3.7 µm) and most (1.6 µm) cloud penetrating wavelengths are the same while the intermediate wavelength (2.1 µm) shows the highest ratios, indicates cloud inhomogeneity, i.e., nonadiabaticity [ZP11]. This is consistent with the greater POST drizzle (Table 1) bringing LWC to lower altitudes and thus reducing cloud adiabaticity. The MASE mean and ctm r e ratios are higher than POST; again, this is likely due to the temporal differences of the measurements and CAS calibration issues. Nevertheless, POST differences are consistent with the 15–20% bias for mean MODIS r e observed by PZ11.
Table 5.
Mean Ratios of MODIS Effective Radius (r e) Derived From Various Bands to In Situ r e or In Situ r e Maxima Near Cloud Top (ctm) From POST and MASE
| # | r e at 3.7/r e i | r e at 2.1/r e i | r e at 1.6/r e i | |
|---|---|---|---|---|
| POST | 11 | 1.21 ± 0.16 | 1.27 ± 0.13 | 1.22 ± 0.15a |
| POSTctm | 11 | 0.99 ± 0.17 | 1.04 ± 0.12 | 0.99 ± 0.07a |
| MASE | 12 | 1.38 ± 0.17b | 1.36 ± 0.22 | 1.23 ± 0.27 |
| MASEctm | 12 | 1.20 ± 0.11b | 1.19 ± 0.17 | 1.07 ± 0.22 |
One point missing for 1.6 µm r e, making only 10.
One point missing for 3.7 µm r e, making only 11.
6. Discussion
Satellite retrievals of clouds are limited by spatial resolution, which tends to miss details of cloud variations on scales finer than pixel sizes. Contrary to satellite measurements, aircraft measurements through and around clouds are obtained over smaller time and distance scales. Satellites provide integrated vertical column data, whereas aircraft measurements cannot be confined to vertical columns due to large horizontal distances required for a vertical cloud penetration. Airplanes often fly only through clouds of interest, while satellites measure over larger areas and depths. To mitigate these differences, satellite pixels here were averaged along the horizontal paths of the soundings whereas PZ11 and M12 used 5 square km pixels. In following PZ11, it was discovered that since some MASE and POST vertical cloud penetrations covered more than 5 horizontal km some data were missing. Furthermore, 5 square km data introduced inhomogeneous pixels that were not representative of the flight paths, thus leading to more errors.
Because MODIS Aqua and Terra satellite measurements occur only at specific times, the nearest vertical cloud penetrations were often more than 20 min away, just a few from POST but most from MASE. M12 attempted to compensate for temporal differences by using back trajectory analysis to remove cloud field advection. Here attempts to improve MASE comparisons by advecting soundings at the mean horizontal wind speed (i.e., PZ11) showed no improvements. But, besides cloud advection shifts, these temporal differences could also provide time for cloud microphysical changes to alter cloud radiative properties. Therefore, the best comparisons are from POST when temporal differences were less than 20 min.
POST‐MASE differences might be explained by instrumentation differences. Tables 1 and 2 show differences in satellite usage between the two projects: POST: eight Aqua versus three Terra; MASE: nine Terra versus three Aqua. However, in POST, two of the Terra COT retrievals were almost on the 1:1 line while the other was above. In MASE, two Aqua COT retrievals contained similar bias to the Terra retrievals while one was biased low. Therefore, satellite differences do not seem to explain the MASE‐POST differences. In MASE, there were differences between the CAS and PVM probes. In most of the MASE cloud penetrations, the PVM probe measured more LWC than the CAS and thus greater LWP (Figure 6b). This and greater temporal differences are likely the reason for weaker relationships in MASE (Table 6). Better CAS‐PVM probe agreement in POST provided a better data set for the MODIS in situ comparisons. While the number of vertical penetrations was limited, the strong correlations provided high significance levels (Table 6). For POST, all two‐tailed significance levels were above 99% with most above 99.9%; and for MASE, all were above 97.5% with most above 99%. This suggests that MODIS is capturing the variability of these limited penetrations and that these results are statistically significant, especially those for POST.
Table 6.
Number of Cases (#), Correlation Coefficient (R), and Two‐Tailed Significance Levels (sl2) for All MODIS In Situ Comparisons in POST and MASEa
| POST | MASE | |||||
|---|---|---|---|---|---|---|
| # | R | sl2 | # | R | sl2 | |
| COTs | 11 | 0.96 | 99.9997 | 10 | 0.94 | 99.9947 |
| COTp | 11 | 0.93 | 99.9966 | 12 | 0.89 | 99.9895 |
| LWPp CAS + CIP | 11 | 0.94 | 99.9950 | 12 | 0.90 | 99.9934 |
| LWPp CAS | 11 | 0.94 | 99.9950 | 12 | 0.89 | 99.9895 |
| LWPp PVM | 11 | 0.95 | 99.9992 | 12 | 0.75 | 99.5035 |
| res 2.1 µm | 11 | 0.94 | 99.9950 | 10 | 0.94 | 99.9947 |
| rep 2.1 µm | 11 | 0.95 | 99.9992 | 12 | 0.74 | 99.4070 |
| res 2.1 µm max | 11 | 0.81 | 99.7492 | 10 | 0.98 | 99.9999 |
| rep 2.1 µm max | 11 | 0.89 | 99.9758 | 12 | 0.82 | 99.8909 |
| rep 1.6 µm | 10 | 0.80 | 99.4544 | 12 | 0.65 | 97.7870 |
| rep 3.7 µm | 11 | 0.95 | 99.9992 | 11 | 0.70 | 98.3529 |
| rep 1.6 µm max | 10 | 0.95 | 99.9974 | 12 | 0.73 | 99.2970 |
| rep 3.7 µm max | 11 | 0.80 | 99.6890 | 11 | 0.83 | 99.8432 |
s is for single midpoint pixel, and p is for pixels averaged along the flight path of the vertical penetration. Max is when the maximum near cloud top in situ r e is used.
While MODIS LWP correctly depicted the variability (high R) of in situ LWP, MODIS LWP produced higher LWP than in situ in both projects. LWP MODIS calculations depend on MODIS r e and COT [Han et al., 1997; P00; PZ11]. Thus, r e and COT errors are propagated to LWP calculations [PZ11]. Since MODIS r e better represents r e closer to cloud top (Figure 8), MODIS‐derived LWP does not accurately depict true cloud LWP. The vertically homogenous and stratified MODIS assumptions have mean biases of 37% and 14% (Table 4, rows 1 and 2) in POST. In POST, MODIS COT does not appear to be the cause of MODIS LWP error. However, for POST, the excellent correlation between MODIS 2.1 µm r e and in situ mean r e (Figure 7a) indicates that MODIS is capable of depicting the variability of mean cloud r e. A correction factor applied to POST MODIS re,
produces a corrected LWP for both the vertically homogenous and stratified assumptions. Table 4 shows the bias ratios of MODIS‐corrected LWP to in situ measurements improve to 13% and −6% (rows 5 and 7), and k also improves over previous LWP comparisons. When the vertical penetration with the largest time difference is removed, the bias is 8% and −10% (rows 6 and 8). The difference between vertically homogenous and stratified is the coefficient by which they are multiplied, 2/3 or 5/9. For an intermediate coefficient (0.6), the bias is 7% (row 9) and the data are centered on the 1:1 line. By removing the vertical penetration with the largest time difference, this bias shrinks to 2% (row 10) and R is 0.97 with k of 1.00. This adjustment applies for POST and may not be applicable to other data sets due to environmental differences.
Cloud microphysics is inherently determined by N CCN put into the clouds to form N c. MODIS COT and r e are also used to calculate N c (CDNC in PZ11 and M12). Both PZ11 and M12 showed better MODIS comparisons with in situ N c than with other in situ variables. However, errors in this calculation due to propagation of r e uncertainty could be a problem. Therefore, bulk cloud microphysical properties based on MODIS r e are problematic for use with GCMs. However, adjustments to estimate mean cloud r e from MODIS r e can improve MODIS‐derived LWP for stratus clouds, as shown for POST.
7. Conclusions
MODIS cloud optical thickness (COT) comparisons with COT calculated from in situ measurements from two stratocumulus field campaigns show strong correlations that capture COT variability, and, for one project (POST), these were close to the 1:1 line with slopes near one. However, in MASE, slopes were larger and the data were not as near the 1:1 line. This is largely due to the larger temporal differences between the MODIS and in situ measurements and instrument bias. Two cloud probes in POST (CAS and PVM) show good LWP agreement in MODIS comparisons, which gives confidence to the POST data set. However, those same probe models in MASE showed different comparisons with MODIS LWP. Furthermore, MODIS LWP provided higher estimates than the probes in both projects. These were determined to result from inherent bias in MODIS r e. On the other hand, MODIS 2.1 µm r e had strong correlations with mean in situ r e, but in both projects MODIS exceeded in situ r e by 20–40%. MODIS r e compared much better with maxima in situ r e near cloud top, but for POST these correlations were lower (Figures 7a and 8a).
Other MODIS r e wavelength bands (3.7 µm and 1.6 µm) also exceeded mean cloud r e comparisons. The various wavelength bands confirmed the nature of the broken stratocumulus in POST and more consistent stratus in MASE. Mean biases of these bands in MASE are consistent with suggested sensing depths for stratus clouds with little drizzle as found in MASE while greater drizzle in POST resulted in random mean biases with respect to wavelengths. Temporal differences between MODIS and in situ measurements are crucial, as for POST the best COT fit used data within 20 min and with MASE the best improvement in combined slope and correlation was from data within 100 min although the intercept increased. Attempts to improve MASE comparisons by advecting the soundings were fruitless. Because MODIS only detects r e from the tops of clouds, errors propagate to calculations of LWP that should be calculated using mean cloud r e. While MODIS COT here is validated by comparisons with in situ data, other values for bulk cloud microphysics are not based on mean cloud values. Adjusting MODIS r e to better estimate mean cloud r e allowed for improved MODIS LWP calculations in POST and perhaps could aide in improving calculations of N c. This correction was not applied to MASE due to probe measurement problems and the large time differences. Further studies of MODIS r e relationships with in situ measurements are needed to improve MODIS r e and LWP.
Acknowledgments
MASE measurements on the DOE G1 were supported by DOE grant DE‐FG02‐05ED63999. POST measurements made on board the CIRPAS TO airplane were supported by the National Science Foundation under grant ATM‐0734441. Analysis was supported by DOE DE‐SC0009162 and NSF AGS‐1035230. For POST, Haflidi Jonsson of CIRPAS, Naval Postgraduate School provided the cloud probe data. Gunnar Senum of Brookhaven National Laboratory provided the cloud probe data for MASE. Data are available from the corresponding author (stephen.noble@dri.edu).
Noble, S. R. , and Hudson J. G. (2015), MODIS comparisons with northeastern Pacific in situ stratocumulus microphysics, J. Geophys. Res. Atmos., 120, 8332–8344, doi:10.1002/2014JD022785.
References
- Ackerman, S. A. , Kirkpatrick M. P., Stevens D. E., and Toon O. B. (2004), The impact of humidity above stratiform clouds on indirect aerosol climate forcing, Nature, 432, 1014–1017. [DOI] [PubMed] [Google Scholar]
- Ban‐Weiss, G. A. , Jin L., Bauer S. E., Bennartz R., Liu X., Zhang K., Ming Y., Guo H., and Jiang J. H. (2014), Evaluating clouds, aerosols, and their interactions in three global climate models using satellite simulators and observations, J. Geophys. Res Atmos., 119, 10,876–10,901, doi:10.1002/2014JD021722. [Google Scholar]
- Borg, L. A. , and Bennartz R. (2007), Vertical structure of stratiform marine boundary layer clouds and its impact on cloud albedo, Geophys. Res. Lett., 34, L05807, doi:10.1029/2006GL028713. [Google Scholar]
- Boucher, O. (1995), GCM estimate of the indirect aerosol forcing using satellite‐retrieved cloud droplet effective radii, J. Clim., 8, 1403–1409. [Google Scholar]
- Carman, J. K. , Rossiter D. L., Khelif D., Jonsson H. H., Faloona I. C., and Chuang P. Y. (2012), Observational constraints on entrainment and the entrainment interface layer in stratocumulus, Atmos. Chem. Phys., 12, 11,135–11,152. [Google Scholar]
- Cess, R. D. , et al. (1989), Interpretation of cloud‐climate feedback as produced by 14 atmospheric general circulation models, Science, 245(4917), 513–516. [DOI] [PubMed] [Google Scholar]
- Chen, Y.‐C. , Christensen M. W., Xue L., Sorooshian A., Stephens G. L., Rasmussen R. M., and Seinfeld J. H. (2012), Occurrence of lower cloud albedo in ship tracks, Atmos. Chem. Phys., 12, 8223–8235, doi:10.5194/acp-12-8223-2012. [Google Scholar]
- Dandin, P. , Pontikis C., and Hicks E. (1997), Sensitivity of a GCM to changes in the droplet effective radius parameterization, Geophys. Res. Lett., 22(4), 437–440, doi:10.1029/97GL00214. [Google Scholar]
- Gerber, H. , Frick G., Malinowski S. P., Jonsson H., Khelif D., and Krueger S. K. (2013), Entrainment rates and microphysics in POST stratocumulus, J. Geophys. Res. Atmos., 118, 12,094–12,109, doi:10.1002/jgrd.50878. [Google Scholar]
- GSFC/NASA (2015), MODIS specifications. [Available at http://modis.gsfc.nasa.gov/about/specifications.php.]
- Han, Q. , Rossow W. B., and Lacis A. A. (1994), Near‐global survey of effective droplet radii in liquid water clouds using ISCCP data, J. Clim., 7, 465–497. [Google Scholar]
- Han, Q. , Rossow W. B., Chou J., and Welch R. M. (1997), Global survey of relationships of cloud albedo and liquid water path with cloud droplet size using ISCCP, J. Clim., 11, 1516–1528. [Google Scholar]
- Hu, Y. X. , and Stamnes K. (1993), An accurate parameterization of the radiative properties of water clouds suitable for use in climate models, J. Clim., 6, 728–742. [Google Scholar]
- Hudson, J. G. , and Noble S. (2009), CCN and cloud droplet concentrations at a remote ocean site, Geophys. Res. Lett., 36, L13812, doi:10.1029/2009GL038465. [Google Scholar]
- Hudson, J. G. , and Noble S. (2014a), CCN and vertical velocity influences on droplet concentrations and supersaturations in clean and polluted stratus clouds, J. Atmos. Sci., 71, 312–331. [Google Scholar]
- Hudson, J. G. , and Noble S. (2014b), Low‐altitude summer/winter microphysics, dynamics, and CCN spectra of northeastern Caribbean small cumuli, and comparisons with stratus, J. Geophys. Res. Atmos., 119, 5445–5463, doi:10.1002/2013JD021442. [Google Scholar]
- Hudson, J. G. , Noble S., Jha V., and Mishra S. (2009), Correlations of small cumuli droplet and drizzle drop concentrations with cloud condensation nuclei concentrations, J. Geophys. Res., 114, D05201 doi:10.1029/2008JD010581. [Google Scholar]
- Hudson, J. G. , Noble S., and Jha V. (2010), Stratus cloud supersaturations, Geophys. Res. Lett., 37, L21813, doi:10.1029/2010GL045197. [Google Scholar]
- Hudson, J. G. , Noble S., and Tabor S. (2015), Cloud supersaturations from CCN spectra Hoppel minima, J. Geophys. Res. Atmos., 120, 3436–3452, doi:10.1002/2014JD022669. [Google Scholar]
- Min, Q. , Joseph E., Lin Y., Min L., Yin B., Daum P. H., Kleinman L. I., Wang J., and Lee Y.‐N. (2012), Comparison of MODIS cloud microphysical properties with in‐situ measurements over the southeast Pacific, Atmos. Chem. Phys., 12, 11,261–11,273, doi:10.5194/acp-12-11261-2012. [Google Scholar]
- Painemal, D. , and Zuidema P. (2011), Assessment of MODIS cloud effective radius and optical thickness retrievals over the southeast Pacific with VOCALS‐REx in situ measurements, J. Geophys. Res., 116, D24206, doi:10.1029/2011JD016155. [Google Scholar]
- Painemal, D. , Minnis P., and Sun‐Mack S. (2013), The impact of horizontal heterogeneities, cloud fraction, and liquid water path on warm cloud effective radii from CERES‐like Aqua MODIS retrievals, Atmos. Chem. Phys., 13, 9997–10,003, doi:10.5194/acp-13-9997-2013. [Google Scholar]
- Platnick, S. (2000), Vertical photon transport in cloud remote sensing problems, J. Geophys. Res., 105(D18), 22,919–22,935, doi:10.1029/2000JD900333. [Google Scholar]
- Platnick, S. , and Valero F. P. J. (1995), A validation of a satellite cloud retrieval during ASTEX, J. Atmos. Sci., 52, 2985–3001, doi:10.1175/1520-0469(1995)052<2985:AVOASC>2.0.CO;2. [Google Scholar]
- Platnick, S. , King M. D., Ackerman S. A., Menzel W. P., Baum B. A., Riedi J. C., and Frey R. A. (2003), The MODIS cloud products: Algorithms and examples from Terra, IEEE Trans. Geosci. Remote Sens., 41(2), 459–473. [Google Scholar]
- Rotstayn, L. D. , and Liu Y. (2003), Sensitivity of the first indirect aerosol effect to an increase of cloud droplet spectral dispersion with droplet number concentration, J. Clim., 16, 3476–3481. [Google Scholar]
- Seethala, C. , and Horvath A. (2010), Global assessment of AMSR‐E and MODIS cloud liquid water path retrievals in warm oceanic clouds, J. Geophys. Res., 115, D13202, doi:10.1029/2009JD012662. [DOI] [PMC free article] [PubMed] [Google Scholar]
- Slingo, A. (1990), Sensitivity of the Earth's radiation budget to changes in low clouds, Nature, 343, 49–51. [Google Scholar]
- Twomey, S. (1977), The influence of pollution on the shortwave albedo of clouds, J. Atmos. Sci., 34, 1149–1152. [Google Scholar]
- Twomey, S. (1991), Aerosols, clouds and radiation, Atmos. Environ., 25A, 2435–2442. [Google Scholar]
- Wang, J. , Daum P. H., Yum S. S., Liu Y., Senum G. I., Lu M.‐L., Seinfeld J. H., and Jonsson H. (2009), Observations of marine stratocumulus microphysics and implications for processes controlling droplet spectra: Results from the Marine Stratus/Stratocumulus Experiment, J. Geophys. Res., 114, D18210, doi:10.1029/2008JD011035. [Google Scholar]
- Wood, R. , and Hartmann D. L. (2006), Spatial variability of liquid water path in marine low cloud: The importance of mesoscale cellular convection, J. Clim., 19, 1748–1764. [Google Scholar]
- Wood, R. , et al. (2011), The VAMOS Ocean‐Cloud‐Atmosphere‐Land Study Regional Experiment (VOCALS‐REx): Goals, platforms, and field operations, Atmos. Chem. Phys., 11, 627–654, doi:10.5194/acp-11-627-2011. [Google Scholar]
- Zhang, Z. , and Platnick S. (2011), An assessment of differences between cloud effective particle radius retrievals for marine water clouds from three MODIS spectral bands, J. Geophys. Res., 116, D20215, doi:10.1029/2011JD016216. [Google Scholar]
- Zheng, X. , et al. (2011), Observations of the boundary layer, cloud, and aerosol variability in the southeast Pacific near‐coastal marine stratocumulus during VOCALS‐REx, Atmos. Chem. Phys., 11, 9943–9959, doi:10.5194/acp-11-9943-2011. [Google Scholar]


