Abstract
We investigated the effect of ATP binding to GroEL and elucidated a role of ATP in the conformational change of GroEL. GroEL is a tetradecamer chaperonin that helps protein folding by undergoing a conformational change from a closed state to an open state. This conformational change requires ATP, but does not require the hydrolysis of the ATP. The following three types of conformations are crystalized and the atomic coordinates are available; closed state without ATP, closed state with ATP and open state with ADP. We conducted simulations of the conformational change using Elastic Network Model from the closed state without ATP targeting at the open state, and from the closed state with ATP targeting at the open state. The simulations emphasizing the lowest normal mode showed that the one started with the closed state with ATP, rather than the one without ATP, reached a conformation closer to the open state. This difference was mainly caused by the changes in the positions of residues in the initial structure rather than the changes in “connectivity” of residues within the subunit. Our results suggest that ATP should behave as an insulator to induce conformation population shift in the closed state to the conformation that has a pathway leading to the open state.
Keywords: adenosine triphosphate, elastic network model, insulator, population shift, protein conformational change
Adenosine triphosphate (ATP) binds to a protein and provides energy for chemical reactions by the hydrolysis of the terminal phosphate [1]. The mechanisms of energy transfer from ATP to the chemical reactions have been studied extensively [1–3]. On the other hand, numerous cases have been found where the role of ATP molecule seems to be completed before the hydrolysis reaction. The role of ATP in these cases seems to reside in the binding itself, but the mechanistic detail of ATP binding to the conformation of protein remains to be elucidated [4–6].
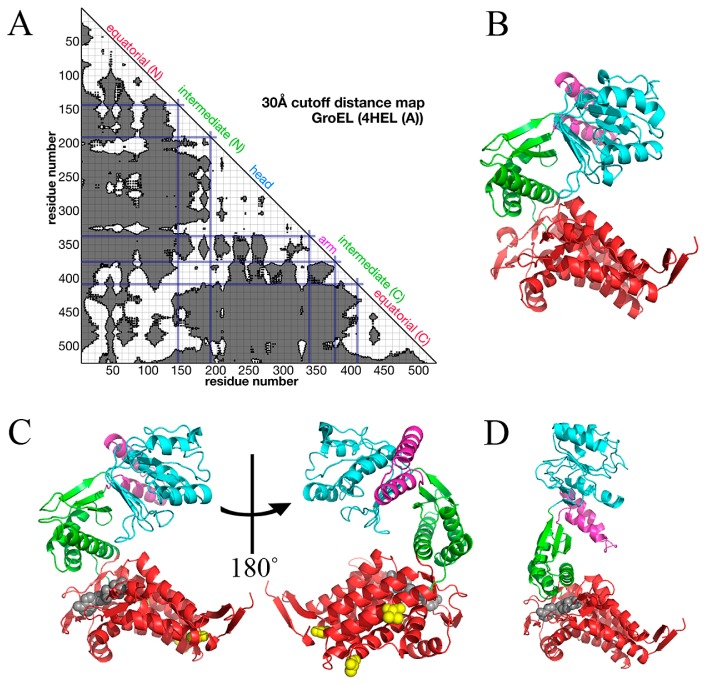
GroEL is a tetradecamer protein found in eubacteria and it mediates folding of unfolded proteins together with a heptamer protein GroES and seven ATP molecules. The single subunit of GroEL was initially identified as a two-domain protein [7] and later as three, i.e. equatorial, intermediate and apical domains [8]. We scrutinized the architecture of the subunit using a distance map and found that the subunit is seemingly divided into four parts (Fig. 1A). We named each part, equatorial (N terminus-Leu134 and Glu409-C terminus), intermediate (Ser135-Glu191 and Val376-Glu408), head (Gly192-Gly337), and arm (Glu338-Gly375) domains. The equatorial and intermediate domains here are equivalent to the ones in ref. 8, and the combination of head and arm domains corresponds to the apical domain in ref. 8.
Figure 1.
The structures of GroEL single subunit in P, M and open states. A. The distance map of GroEL single subunit (4HEL_A). The cutoff distance is 30 Å. B–D. The conformations of M (B), P (C) and open (D) states. These structures are retrieved from Protein Data Bank (PDB) [16]. PDB IDs of M, P and open states are 4HEL_A, 1KP8_A and 1AON_A, respectively. Equatorial domain is colored in red, intermediate domain in green, arm domain in magenta, and head domain in cyan. The grey molecule in P state is an ATP analogue. The grey molecule in D is ADP. In P state, three residues mutated for crystallization are shown in yellow space-filling model. Images of the structures were drawn with PyMOL [26].
GroEL subunit takes two different conformations, namely closed (Fig. 1B, C) and open (Fig. 1D). The transition from closed to open conformations is thought to be essential for chaperonin function of GroEL [9–11]. The closed conformation has been observed without an unfolded protein and GroES, and the conformation can be realized without ATP (Fig. 1B) or with ATP (Fig. 1C). The two states in the closed conformation, namely the closed state with ATP (P state) and the closed state without ATP (M state), have a minor structural difference compared with the difference between closed and open conformations. The root mean square deviation (RMSD) of heavy atoms (all except hydrogen atoms) between P and M states of GroEL from Escherichia coli is about 1.6 Å, whereas the RMSD between P and open states is about 12 Å.
The role of ATP in chaperonin function of GroEL has been extensively studied. Taguchi et al. demonstrated protein-folding experiments using GroEL-GroES complex with ADP and BeFx, and proved that the chaperonin function was not dependent on ATP hydrolysis [5]. Hartl and Hayer-Hartl summarized that GroEL in the closed state bound to an ATP molecule, and without hydrolysis of the ATP, GroEL with GroES transformed to the open state [12]. Hence, ATP hydrolysis is not required for the change from the closed to the open conformations in GroEL and the role of ATP molecules in conformational change is obscure.
Conformational change from the closed state to the open state of GroEL has been a research target for computational biology. Ma et al. performed a targeted molecular dynamic simulation from closed to open conformations of GroEL and found highly complicated displacement of the subunits in a tetradecamer [13]. Tehver et al. applied their original elastic network model method on GroEL complex and found the critical residues within and between the subunits for positive cooperativity that drove the transition from the closed to open conformations. They also found that the lowest normal mode dominated in the conformation change form the closed to the open states [14]. Yang et al. developed an adaptive anisotropic network model and described the collective dynamics of GroEL system. They found formations of critical interactions within the subunit for the transition [15]. All these computational studies focused on the pathway toward the open state via P state of GroEL, and none of these studies addressed the role of ATP molecule in the conformational change.
The previous experiments showed that the hydrolysis of ATP is not required for the transition of GroEL from the closed state to the open state [5], hence the energy barrier of this transition is likely to be low, but this low energy barrier should be high enough to be overcome only by ATP binding. To elucidate the role of ATP binding, we here conducted computer simulations of closed to open state transition, starting with P state and with M state, targeting at the open state. We found that M state could not reach the open state, whereas P state could reach the open state. Based on the simulation results, we suggest that ATP binding should cause population change of GroEL in the closed conformation from M state to P state by preventing P state from transferring to other presumably dead-end conformations, and that the role of ATP molecule should be an insulator that effectively shifts the conformation rather than be an energy supplier.
Materials and Methods
Protein coordinate data
Protein structure data were retrieved from PDB [16]. For structures of P state, M state and open state, we used the coordinates of Cα atoms (from Ala2 to Pro525) in A chains of 1KP8 [17], 4HEL and 1AON [18], respectively, all derived from Escherichia coli. These three structures are shown in Figure 1. The data in P state contain γ-Thio-ATP, an analogue of ATP molecule. The open state binds to ADP. The sequence of the P state contains three mutated residues, namely Arg13Gly, Ala126Val and Glu434Ala. In the present simulations, the type of these three residues was replaced with the native amino acid.
Simulations of conformational change
We conducted six types of simulations using two different models, namely Targeted Network Model (TNM) and Constant Connectivity Model (CCM). A brief summary of the six simulations is shown in Table 1. The six simulations are named TNM-P, TNM-M, CCM-PP, CCM-PM, CCM-MP, CCM-MM. P and M after the dash are short for P and M states, respectively.
Table 1.
Summary of simulations with two types of model
| initial structure | connectivity | ||
|---|---|---|---|
|
| |||
| updated | P state | M state | |
| P state | TNM-P | CCM-PP | CCM-PM |
| M state | TNM-M | CCM-MP | CCM-MM |
Targeted network model (TNM)
For TNM, we conducted two types of simulations of conformational change from the closed states to the open state with P and M states as an initial structure (Table 1). All heteroatoms, including ATP molecules, and all atoms except Cα atoms were removed. The simulation was executed through computing normal modes of one subunit based on the Elastic Network Model (ENM) [19], which has been applied in the previous studies by others to simulate the conformational change of various proteins [13,15,20]. In ENM, potential energy was calculated by applying Tirion potential V [19,21],
where Rij is a distance vector between the i-th and the j-th Cα atoms. The fluctuation in the distance vector Rij is ΔRij = Rij – R0, where R0 is the distance vector in the equilibrium. N is the total number of residues. Γij is the Kirchhoff or connectivity matrix that shows whether two Cα atoms are within a cutoff distance (rc). Conformational changes were computed by repeating the following four operations (Fig. 2).
Figure 2.
Schematic explanation for simulations of conformational change. First, the set of displacements {Δqi}i=1,2,…,3N for all Cα atoms in the (n–1)-th structure are calculated (N is the number of Cα atoms). {ΔQi}i=1,2,…,N are three dimensional vectors whose x, y and z components are Δq3i-2, Δq3i-1 and Δq3i. As candidates for the n-th structure, two structures are built, by deforming the (n–1)-th structure to positive and negative directions of {Δqi}. Then one of them with the smaller heavy-atom RMSD against the open state is selected. If the structural consistency is preserved, this structure is chosen as the n-th structure.
Normal modes were computed on a structure using the Tirion potential,
-
After obtaining 3N–6 modes, five modes with the five smallest non-zero eigenvalues were selected [14,21]. The displacements were calculated by
where Δqi is the amount of displacement on the i-th generalized coordinate. Li(α) is an eigenvector of the i-th component of the α-th normal mode, and ω(α) is an eigenvalue corresponding to the eigenvector L(α). C, t and δ are constant values. Two structures were obtained by changing the structure toward positive and negative directions of Δqi. Incorporating the five lowest modes in the straightforward manner may seem insufficient for searching for the next conformation and all possible combinations of modes may be examined for the next conformation. According to the previous work on GroEL by Tehver et al. however, the lowest mode dominated in the transition from the open to the closed states and all other modes played insignificant roles in the conformational change [14]. In our calculation therefore, we took advantage of this result and considered only the lowest mode. Remaining four low modes were included as perturbation terms about the lowest mode,
Full atom structures except hydrogen atoms of the two conformations were reconstructed on PULCHRA [22], and
Heavy-atom RMSDs between each of these reconstructed structures and the open state were calculated. Out of the reconstructed two structures, the one with the smaller RMSD was chosen as a new structure.
At each cycle of (1)–(4), we assigned the secondary structure with DSSP [23], and calculated the ratio of the number of Cα atoms that assumed helices in a computed structure to that in the initial structure. If the ratio was less than 0.65, the structure was regarded as broken. In addition, if the distances between the adjacent Cα atoms on the primary structure were out of the range between 3.6 and 3.9 Å, the structure was also regarded as broken. When a structure was broken, the other structure that had not been selected previously due to its larger heavy-atom RMSD would be selected. If there is a relatively high-energy barrier on the way, the structure should break, so that the simulation halts (dead-end) or starts to find another path. Each simulation was continued until the maximum of the gradient over the latest 1,500 cycles in the value of heavy-atom RMSD against the open state became less than 10−6. Among all computed structures, one that had the smallest heavy-atom RMSD against the open state was selected as the final structure.
Constant connectivity model (CCM)
We conducted four types of simulations with CCM (Table 1). The difference between TNM and CCM lies in the connectivities employed. In TNM, connectivity or Kirchhoff matrix was updated at each cycle, whereas in CCM the connectivity was constant throughout the simulation. We applied the connectivity of either P state or M state at every cycle. The other operations are the same as those of TNM (Fig. 2).
Determination of the parameters rc and γ
The parameter to determine the maximum length of connectivity rc, was determined in such a way that more than two but no more than six eigenvalues in the first step of the simulation were effectively zero (|eigenvalue| < 10−10). The parameter to determine the strength of connectivity (Hooke’s constant) in the Tirion potential, γ, was determined as a maximum value in the range where non-negative eigenvalues for all the calculations were found.
Results and Discussion
Of the six types of simulations, the simulations over the models of TNM-M, CCM-MM, CCM-MP, CCM-PM and CCM-PP converged by 5,000th cycle, and the simulation over the model of TNM-P converged at 7,317th cycle. In the following discussion, only the converged trajectories are used and dead-end trajectories (with broken covalent bonds or broken helices) were discarded.
TNM-P reaches the open state whereas TNM-M does not
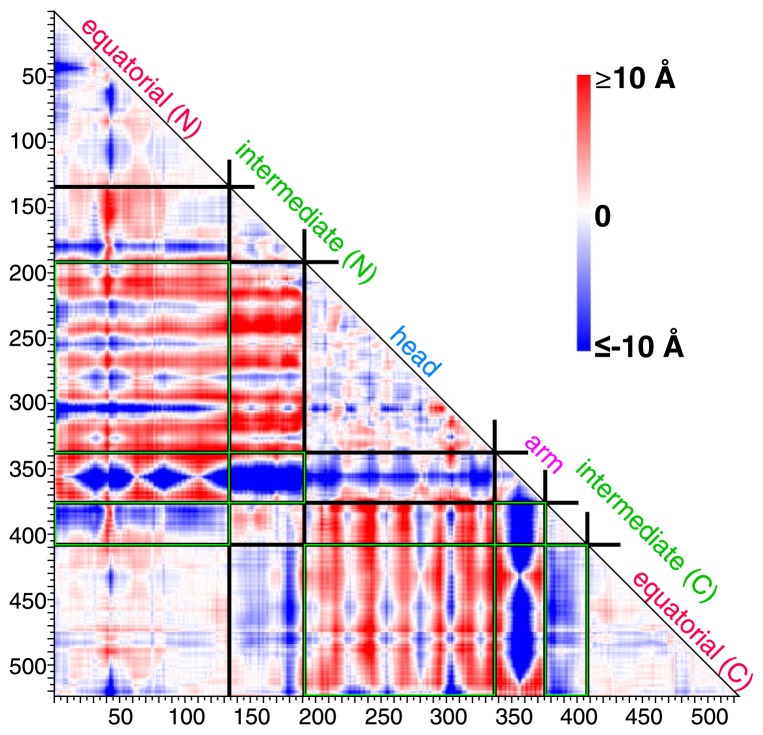
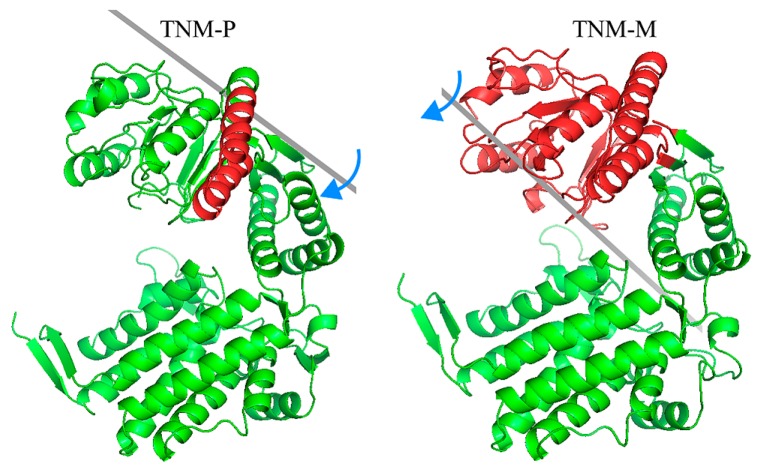
The final structures obtained from the simulations of TNM-P (simulation from P state to the open state) and TNM-M (simulation from M state to the open state) are shown in Figure 3. The heavy-atom RMSD between the final structure in TNM-P and the open state was about 6.4 Å, and that in TNM-M was about 8.1 Å. TNM-P evidently approached the open state better than TNM-M. To identify the differences in the final structures of TNM-P and TNM-M, we compared the two structures using a difference map, a map that shows the subtraction of a distance map of TNM-M from that of TNM-P (Fig. 4). One of the most outstanding features in the difference map was found in the arm domain. The arm domain was the only domain that has negative (blue) distances with all other domains (Fig. 4). This result indicated that the direction of the movement of the arm domain in TNM-P and TNM-M was opposite from each other. This difference in the direction of the movement seems to depend on the difference in the initial structures of P and M states, as shown in the structural comparison on the initial several steps of each simulation by DynDom [24] (Fig. 5). The arm domain and the head domain in TNM-M rotated together against the upper part of the intermediate domain. In TNM-P, however, the arm domain, by making the region connecting the arm and head domains as a pivot, shifted toward the head domain. The difference in the rotation movement in TNM-M and TNM-P that appeared in the early stage of the simulations was apparently exaggerated in the remaining stages of the simulations and ended in a noticeable difference in the difference map.
Figure 3.
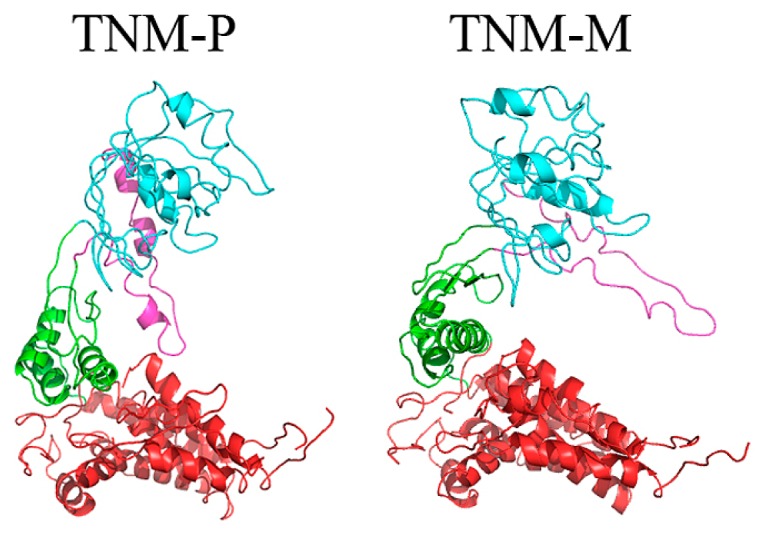
The final structures in TNM-P (left) and TNM-M (right). The coloring is the same as Figure 1. The figures were drawn with PyMOL [26].
Figure 4.
Difference map between TNM-P and TNM-M. The map shows the subtraction of the distance maps of the final structure in TNM-M from that in TNM-P. Boundaries between domains are shown in black. Difference in the relative location of domains emphasized by the green box is further discussed in Figure 7.
Figure 5.
The domain movement in the first several steps in TNM-P and TNM-M. The two figures show the domain movement in the first several steps in TNM-P and in TNM-M analyzed by DynDom [24]. Red domains are the ones that move mostly. Green domains are the ones fixed in the analysis. Grey bars are the axis of the rotation. Blue arrows indicate the direction to which red domain rotates. These figures were drawn with PyMOL [26].
Other noticeable differences in the distance map were marked with a green box in Figure 4. The intersections between equatorial(N) and head domains and between head and equatorial(C) domains were colored in dark red. These differences indicated that the distances between these domains of the final structure in TNM-P were further than those in TNM-M. The intersections between equatorial(N) and intermediate( C) domains, between intermediate(N) and arm domains, and between intermediate(C) and equatorial(C) domains were colored in dark blue. It was shown that the distances between these domains of the final structure in TNM-P were closer than those in TNM-M. We found that these differences can be quantified by three variables as depicted in Figure 6, namely the angle (θ) formed by two lines drawn between the geometrical centers of the head and intermediate domains, and between those of the intermediate and equatorial domains, the distance (R1) of the geometrical centers between the equatorial and intermediate domains, and that (R2) between the intermediate and arm domains. These variables characterize the distances between the equatorial and head domains, between the intermediate and equatorial domains, and between the arm and intermediate domains, respectively.
Figure 6.
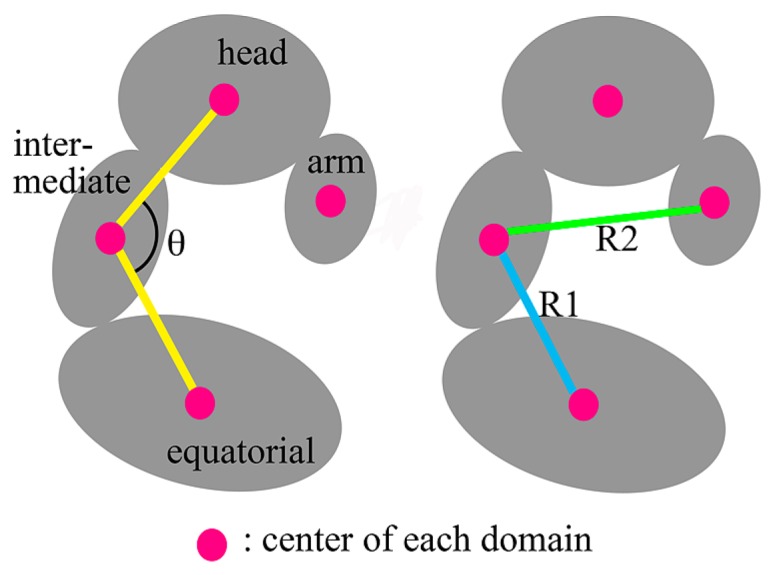
Diagrams of the quantities for measurement. Magenta circles indicate the positions of the geometrical center of the atoms in each domain. θ is the angle between two yellow lines. R1 and R2 are the lengths (distances) shown by blue and green lines, respectively.
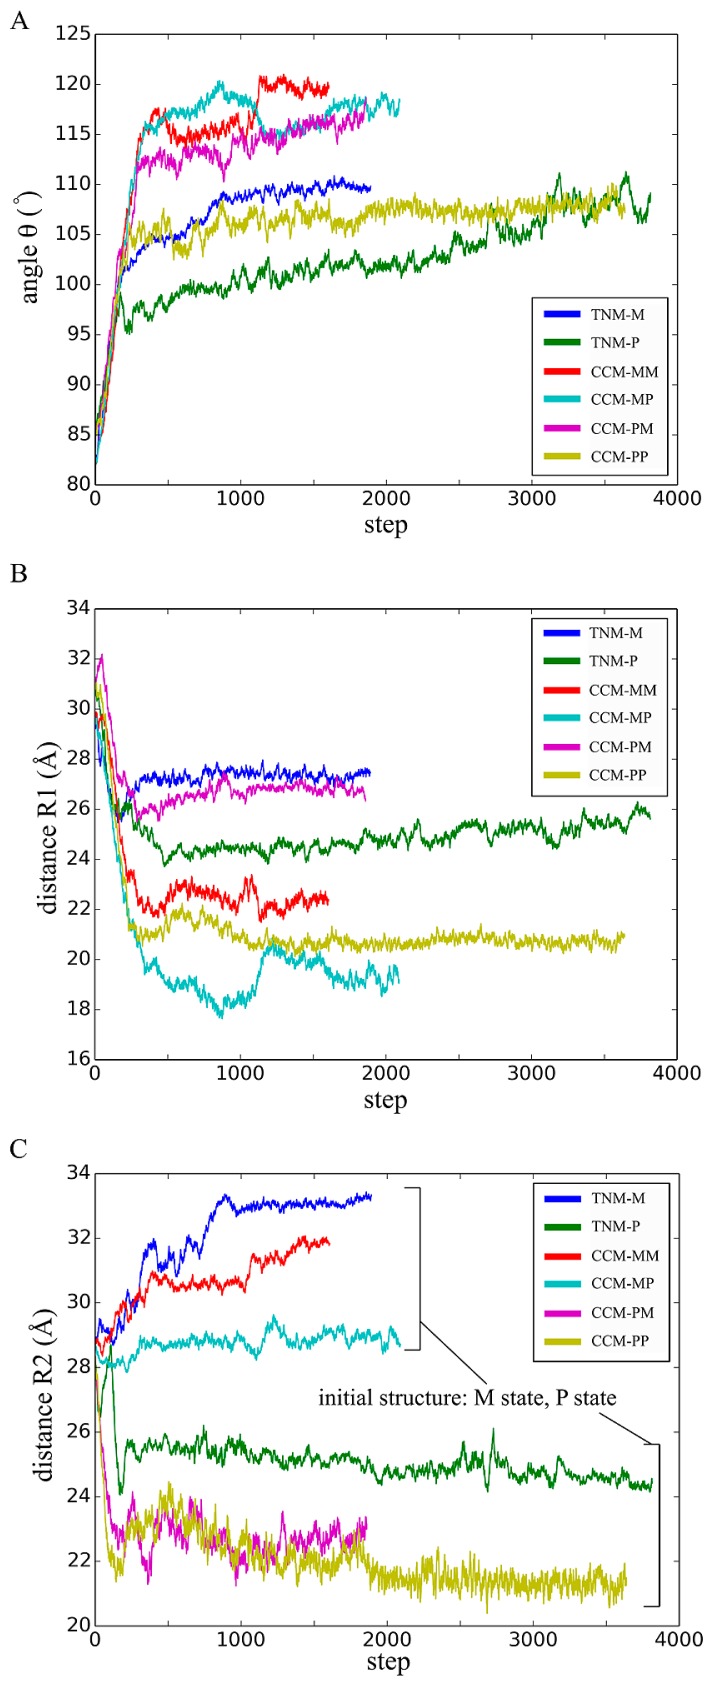
The time evolution of θ during the simulations is shown in Figure 7A. In the trajectories of TNM-P and TNM-M, the increase in the angle indicated that the GroEL in closed state stood up. This movement was also noted in a cryo-electron microscopy measurement [25]. The change in distance R1 during the simulations is shown in Figure 7B. In the trajectories of TNM-P and TNM-M, the distance decreased, indicating that the intermediate and equatorial domains approached each other. This movement was also noted in the molecular dynamics simulation by Ma et al [13]. The trajectory of the distance between the geometrical centers of the domains shown in Figure 7C indicates that the changes in the distance of TNM-P and TNM-M were completely different throughout the simulations. The trajectory of TNM-P went down and reached the value close to the distance found in the open state (about 22 Å), whereas the trajectory of TNM-M steadily went up.
Figure 7.
The time evolution of the characteristic quantities in structures computed on TNM and CCM. Line graphs show the changes in the angle θ (A), the distance R1 (B), and the distance R2 (C) in Figure 6 from initial to the final structures.
Qualitatively speaking, the current simulations showed that TNM-P was capable of reaching the open state, whereas TNM-M was incapable of it. Therefore, the function of the ATP molecule is either to induce the conformational change from M state to P state or to shift the conformational population from M state to P state. The small RMSD between the two closed states suggests that the two states are reachable with each other without imposing high energy. A normal mode analysis between the two closed states showed that M state exhibited a strong tendency to approach P state [15]. These results are consistent with the fact that ATP plays a physical role that affects the deformation of GroEL by its existence, rather than a chemical role that provides high energy for conformational change. If this is the case, M and P states are reachable from each other and there could be a path between the two states. In reality, though, ATP binding is required for GroEL deformation and deformation from M state to the open state through P state without ATP has not been observed. The possible explanation of this behavior, based on the results of our calculations, is that M state has at least two major paths for the conformational change, and one is directed close to the ‘open state’ and the other to P state. Without ATP, the path directed close to the ‘open state’ should be wide-open and this is the path we found in the simulation as dead end. With ATP, the path to the dead-end ‘open state’ as well as other possible states are blocked and the path to the P state remains. The path is a detour to the open state, but reachable to the open state. M and P states are likely in equilibrium, where the population of P state is much smaller than that of M state before ATP binding but the population of P state increases after ATP binding. The role of bound ATP molecule is, hence, likely to be an insulator to shift the population from M state to P state.
Potential of forming a multimer during the conformational transition
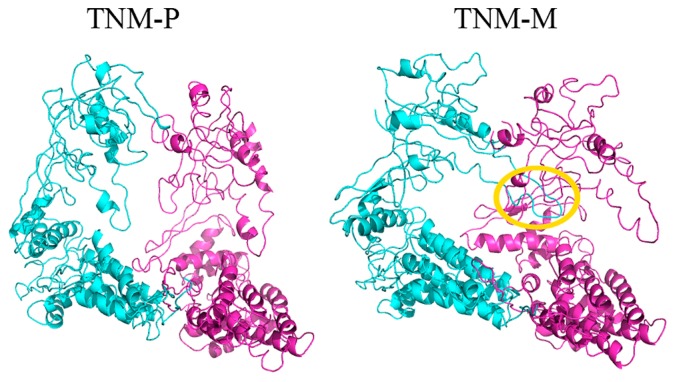
For the transition from the closed to the open states, the multimer configuration is maintained so that the conformational transition of the single subunit should not interrupt the subunit interactions. Conceptual multimers of GroEL based on the final structures of the simulations are shown in Figure 8. The figure shows a dimer in the tetradecamer structure generated by superimposing the final structures onto the structure of GroEL open state. Evidently, the dimer structure derived from the result of TNM-M simulation had a clash between the two subunits, namely the arm domain of one of the subunits overlapped the other subunit. On the contrary, no serious clash was observed in the dimer structure of TNM-P. Note that the dislocation of the arm domain in TNM-M was suggested by the difference map and DynDom analyses on TNM-P and TNM-M. The direction of the rotation of the arm domain in TNM-M is the cause of the clash and these hypothetical models suggest that TNM-M is not capable of forming a multimer while TNM-P is. The final structure found in TNM-M is, therefore, likely a hypothetical structure achievable only in the simulation.
Figure 8.
A possible dimer structure in the tetradecamer built on the final structure of TNM-P (left) and TNM-M (right). Each complex consists of the same computed subunits. Each final structure was aligned to a subunit of the 14-mer structure of the open state. The yellow circle in TNM-M shows clash between the subunits. Docked structures were built with PyMOL [26].
Possible steric effect of ATP on the conformation change in GroEL
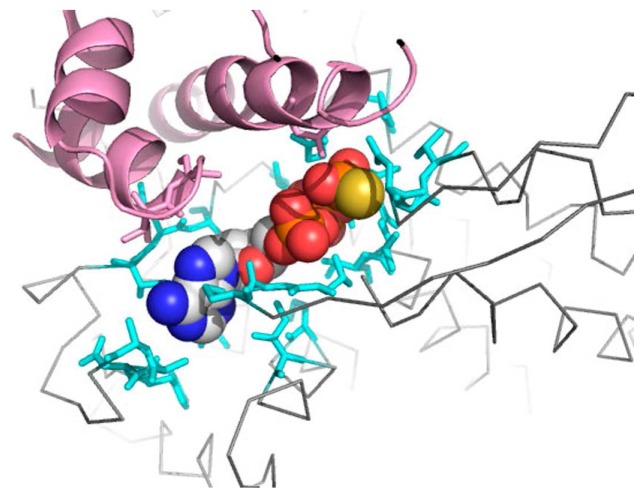
In our simulations, ATP molecule was removed. In the structure of P state, an ATP molecule bound to the cleft formed between the intermediate and equatorial domains of GroEL (Fig. 1). Simulation over the model after removing the ATP molecule on the P state may have resulted in the collapse of the space in the cleft and relocated the domains to the positions that were close-by. Considering this effect, there was a possibility that the movement of the intermediate domain in TNM-P had been an artifact. In order to reject the possibility of the artifact, we tested whether the final structure was capable of binding an ATP molecule. We superimposed the equatorial domain of the initial and the final structures of TNM-P and transferred the coordinates of the ATP analogue bound to the initial structure to the final structure (Fig. 9). In the final structure, ATP analogue was located in a pocket (cyan) that corresponds to the pocket of ATP analogue in the initial structure. The intermediate domain (pink) in the final structure did not overlap the ATP molecule. Hence the domain relocations we found in the simulation without ATP molecule was less likely to be the effect of the artificial removal of ATP.
Figure 9.
ATP-binding site in the final structure of TNM-P. The molecule in the center is an ATP analogue. The grey line is the backbone of the final structure. The pink region is a part close to the ATP analogue in the intermediate domain. Residues in cyan are ones in the equatorial domain around the ATP analogue. This figure was drawn with PyMOL [26].
Analyses of the effect of ATP on intra-subunit interaction
So far, the simulations suggested that a direct path from M state to the open state should be a dead-end and that P state should have a path to the open state. In these simulation systems, the differences between the M and P states are the location of Cα atoms and the connectivities (interactions) of Cα atoms. Hence either of them or both of them should be the factors to cause the difference in the final structures. These factors cannot be separated in the real world experiments, but can be separated in a computer simulation. By employing connectivity of M state to P state and conduct a simulation, one can test whether the initial locations of atoms or the initial intra-subunit interactions is the main factor for paving the path to the open state. We, therefore, conducted four types of simulations with CCM. The simulations are summarized in Table 1.
In order to compare the features of the computed conformational changes, we measured the same angles and distances as we did on the results with TNM (Fig. 6). The trajectories of angle θ and distance R1 in CCM simulations had a reasonable similarity to the ones in TNM simulations in the time evolution (Fig. 7A, B). However, the trajectories of distance R2 were divided into two groups (Fig. 7C). The computed structures in CCM-MM and CCM-MP had the similar features to the result of TNM-M, while the computed structures in CCM-PM and CCM-PP had features similar to the result of TNM-P. The simulations in the former group all started with the conformation in M state, whereas those in the latter group started with the conformation in P state. These results strongly suggest that the time evolution of conformational change should depend on the types of initial structures. This result indicated that the difference of connectivity between M state and P state had a minor effect on the conformational change and that the initial location of atoms dominates the time evolution of the conformation.
Role of ATP in GroEL conformational change
In the present simulations, we obtained the following results. (1) M state hardly reaches the open state, (2) P state likely reaches the open state, (3) M state with connectivity of P state hardly reaches the open state, and (4) P state with connectivity of M state likely reaches the open state. These results clearly demonstrates that the structural changes in the closed state are the major factors for the transition of GroEL from the closed to the open state, and that the changes in the interacting residues through the transition from the closed to the open states are non-essential.
The two conformations of GroEL in the closed state are likely to be reachable with each other without poring energy into its conformational change, because the difference is subtle and a normal mode analysis suggested the path between the two [15]. An ATP molecule is known to keep its γ-phosphate during the transition from the closed to the open states [5]. Hence the essence of ATP-binding is the shift in the populations of two closed conformations toward the one that is in a path leading to the open state. The ATP molecule is suggested to regulate the conformational change from closed to open states by shifting GroEL closed state to another stable state rather than by changing interactions within or outside of GroEL. This role of ATP is likely implemented by blocking paths of the conformation change of GroEL to M state and other possible states.
The role of ATP molecules is generally discussed over the hydrolysis of the γ-phosphate and the release of the high energy. In the binding of ATP to GroEL, hydrolysis of the molecules has long been known to have no direct relation to the conformational transition from the closed to open state [5], but without ATP, the transition will not be realized [7]. Based on the present simulation, the role of the ATP molecule is suggested as an insulator that prevents GroEL from shifting to the conformational pathway that does not reach to the open state. The current results further suggest that other molecules that resemble ATP in their structure but not in their chemical property can function as insulators for GroEL conformational change.
Significance.
GroEL is a chaperonin that undergoes a conformational change from a closed state to an open state. This change requires ATP, but does not require ATP hydrolysis. To investigate the role of ATP in the conformational change, we conducted computer simulations using Elastic Network Model. We found that an ATP molecule behaves as a blockage that induces a population shift and increases the population of conformation that can lead to the open state conformation and decreases the population of conformation that cannot reach the open state conformation.
Acknowledgement
This work was supported by the Platform Project for Supporting in Drug Discovery and Life Science Research (Platform for Drug Discovery, Informatics, and Structural Life Science) from Japan Agency for Medical Research and Development (AMED).
Footnotes
Conflicts of Interest
Y. S. and K. Y. declare that they have no conflict of interest.
Author Contribution
Y. S. and K. Y. directed the entire project and co-wrote the manuscript. Y. S. performed all the simulations and analyses. K. Y. analyzed the computed structures.
References
- 1.Westheimer FH. Why nature chose phosphates. Science. 1987;235:1173–1178. doi: 10.1126/science.2434996. [DOI] [PubMed] [Google Scholar]
- 2.Miller DL, Westheimer FH. The hydrolysis of γ-phenylpropyl di- and triphosphates. J Am Chem Soc. 1966;88:1507–1511. doi: 10.1021/ja00959a034. [DOI] [PubMed] [Google Scholar]
- 3.Kobayashi E, Yura K, Nagai Y. Distinct conformation of ATP molecule in solution and on protein. Biophysics. 2013;9:1–12. doi: 10.2142/biophysics.9.1. [DOI] [PMC free article] [PubMed] [Google Scholar]
- 4.Wellhauser L, Luna-Chavez C, D’Antonio C, Tainer J, Bear CE. ATP induces conformational changes in the carboxyl-terminal region of ClC-5. J Biol Chem. 2011;286:6733–6741. doi: 10.1074/jbc.M110.175877. [DOI] [PMC free article] [PubMed] [Google Scholar]
- 5.Taguchi H, Tsukuda K, Motojima F, Koike-Takeshita A, Yoshida M. BeFx stops the chaperonin cycle of GroEL-GroES and generates a complex with double folding chambers. J Biol Chem. 2004;279:45737–45743. doi: 10.1074/jbc.M406795200. [DOI] [PubMed] [Google Scholar]
- 6.Gunderson KL, Kopito RR. Conformational states of CFTR associated with channel gating: the role of ATP binding and hydrolysis. Cell. 1995;82:231–239. doi: 10.1016/0092-8674(95)90310-0. [DOI] [PubMed] [Google Scholar]
- 7.Saibil HR, Zheng D, Roseman AM, Hunter AS, Watson GM, Chen S, et al. ATP induces large quaternary rearrangements in a cage-like chaperonin structure. Curr Biol. 1993;3:265–273. doi: 10.1016/0960-9822(93)90176-o. [DOI] [PubMed] [Google Scholar]
- 8.Braig K, Otwinowski Z, Hegde R, Boisvert DC, Joachimiak A, Horwich AL, et al. The crystal structure of the bacterial chaperonin GroEL at 2.8 Å. Nature. 1994;371:578–586. doi: 10.1038/371578a0. [DOI] [PubMed] [Google Scholar]
- 9.Goloubinoff P, Christeller JT, Gatenby AA, Lorimer GH. Reconstitution of active dimeric ribulose bisphosphate carboxylase from an unfolded state depends on two chaperonin proteins and Mg-ATP. Nature. 1989;342:884–889. doi: 10.1038/342884a0. [DOI] [PubMed] [Google Scholar]
- 10.Martin J, Langer T, Boteva R, Schramel A, Horwich AL, Hartl FU. Chaperonin-mediated protein folding at the surface of groEL through a “molten globule”-like intermediate. Nature. 1991;352:36–42. doi: 10.1038/352036a0. [DOI] [PubMed] [Google Scholar]
- 11.Jackson GS, Staniforth RA, Halsall DJ, Atkinson T, Holbrook JJ, Clarke AR, et al. Binding and hydrolysis of nucleotides in the chaperonin catalytic cycle: implications for the mechanism of assisted protein folding. Biochemistry. 1993;32:2554–2563. doi: 10.1021/bi00061a013. [DOI] [PubMed] [Google Scholar]
- 12.Hartl FU, Hayer-Hartl M. Molecular chaperones in the cytosol: from nascent chain to folded protein. Science. 2002;295:1852–1858. doi: 10.1126/science.1068408. [DOI] [PubMed] [Google Scholar]
- 13.Ma J, Sigler PB, Xu Z, Karplus M. A dynamic model for the allosteric mechanism of GroEL. J Mol Biol. 2000;302:303–313. doi: 10.1006/jmbi.2000.4014. [DOI] [PubMed] [Google Scholar]
- 14.Tehver R, Chen J, Thirumalai D. Allostery wiring diagrams in the transitions that drive the GroEL reaction cycle. J Mol Biol. 2009;387:390–406. doi: 10.1016/j.jmb.2008.12.032. [DOI] [PubMed] [Google Scholar]
- 15.Yang Z, Májek P, Bahar I. Allosteric transitions of supramolecular systems explored by network models: application to chaperonin GroEL. PLoS Comput Biol. 2009;4:e1000360. doi: 10.1371/journal.pcbi.1000360. [DOI] [PMC free article] [PubMed] [Google Scholar]
- 16.Berman HM, Westbrook J, Feng Z, Gilliand G, Bhat TN, Weissig H, et al. The protein data bank. Nucleic Acids Res. 2000;28:235–242. doi: 10.1093/nar/28.1.235. [DOI] [PMC free article] [PubMed] [Google Scholar]
- 17.Wang J, Boisvert DC. Structural basis for GroEL-assisted protein folding from the crystal structure of (GroEL-KMgATP)14 at 2.0 Å resolution. J Mol Biol. 2003;327:843–855. doi: 10.1016/s0022-2836(03)00184-0. [DOI] [PubMed] [Google Scholar]
- 18.Xu Z, Horwich AL, Sigler PB. The crystal structure of the asymmetric GroEL-GroES-(ADP)7 chaperonin complex. Nature. 1997;388:741–750. doi: 10.1038/41944. [DOI] [PubMed] [Google Scholar]
- 19.Tirion MM. Large amplitude elastic motions in proteins from a single-parameter, atomic analysis. Phys Rev Lett. 1996;77:1905–1908. doi: 10.1103/PhysRevLett.77.1905. [DOI] [PubMed] [Google Scholar]
- 20.Matsumoto A, Kamata T, Takagi J, Iwasaki K, Yura K. Key interactions in integrin ectodomain responsible for global conformational change detected by elastic network normal-mode analysis. Biophys J. 2008;95:2895–2908. doi: 10.1529/biophysj.108.131045. [DOI] [PMC free article] [PubMed] [Google Scholar]
- 21.Rader AJ, Chennubhotla C, Yang LW, Bahar I. The Gaussian network model: Theory and applications. In: Cui Q, Bahar I, editors. Normal mode analysis: theory and applications to biological and chemical systems. Chapman & Hall CRC Press; Chicago, IL: 2006. pp. 41–64. [Google Scholar]
- 22.Rotkiewicz P, Skolnick J. Fast procedure for reconstruction of full-atom protein models from reduced representations. J Comput Chem. 2008;29:1460–1465. doi: 10.1002/jcc.20906. [DOI] [PMC free article] [PubMed] [Google Scholar]
- 23.Kabsch W, Sander C. Dictionary of protein secondary structure: pattern recognition of hydrogen-bonded and geometrical features. Biopolymers. 1983;22:2577–2637. doi: 10.1002/bip.360221211. [DOI] [PubMed] [Google Scholar]
- 24.Hayward S, Berendsen HJ. Systematic analysis of domain motions in proteins from conformational change: new results on citrate synthase and T4 lysozyme. Proteins. 1998;30:144–154. [PubMed] [Google Scholar]
- 25.Ranson NA, Farr GW, Roseman AM, Gowen B, Fenton WA, Horwich AL, et al. ATP-bound states of GroEL captured by cryo-electron microscopy. Cell. 2001;107:869–879. doi: 10.1016/s0092-8674(01)00617-1. [DOI] [PubMed] [Google Scholar]
- 26.The PyMOL molecular graphics system, version 1.2r.pre. Schrödinger, LLC; [Google Scholar]


