Abstract
The interactions of small molecules with proteins (protein–ligand interactions) mediate various biological phenomena including signal transduction and protein transcription and translation. Synthetic compounds such as drugs can also bind to target proteins, leading to the inhibition of protein–ligand interactions. These interactions typically accompany association–dissociation equilibrium according to the free energy difference between free and bound states; therefore, the quantitative biophysical analysis of the interactions, which uncovers the stoichiometry and dissociation constant, is important for understanding biological reactions as well as for rational drug development. Mass spectrometry (MS) has been used to determine the precise molecular masses of molecules. Recent advancements in MS enable us to determine the molecular masses of protein–ligand complexes without disrupting the non-covalent interactions through the gentle desolvation of the complexes by increasing the vacuum pressure of a chamber in a mass spectrometer. This method is called MS under non-denaturing conditions or native MS and allows the unambiguous determination of protein–ligand interactions. Under a few assumptions, MS has also been applied to determine the dissociation constants for protein–ligand interactions. The structural information of a protein–ligand interaction, such as the location of the interaction and conformational change in a protein, can also be analyzed using hydrogen/deuterium exchange MS. In this paper, we briefly describe the history, principle, and recent applications of MS for the study of protein–ligand interactions.
Keywords: Mass spectrometry, dissociation constant (KD), affinity, hydrogen/deuterium exchange mass spectrometry, drug screening
The analysis of protein–ligand interactions is important for understanding various biological phenomena and drug development. The physico-chemical parameters that characterize protein–ligand interactions are stoichiometry and dissociation constant (KD), from which the free energy difference of the interaction is estimated. Several biophysical methods for the assessment of protein–ligand interactions exist, including surface plasmon resonance (SPR), capillary electrophoresis, isothermal titration calorimetry (ITC), and mass spectrometry (MS). Each method has both advantages and disadvantages; thus, one must select the appropriate method based on the purpose of the measurement. In the past two decades, MS has been used widely in the field of biological research to identify and quantify metabolites and proteins; however, under the conditions of conventional MS, biological substances dissociate into individual molecules during ionization or/and desolvation; therefore, protein–ligand interactions are rarely observed. Meanwhile, recent progress in MS under non-denaturing conditions, mainly led by Robinson’s group, has enabled the measurement of total masses of protein–ligand complexes, even for non-covalent interactions [1]. Furthermore, recent hydrogen/deuterium exchange MS (HDX-MS) has realized the identification of the interaction site and conformation change of a protein upon ligand binding, providing structural information on protein–ligand interactions [2]. Similarly, hydroxyl radical footprinting provides information on interaction sites and conformational changes [3]. Chemical crosslinking followed by MS analysis has been used to identify the binding site [4]. Thus, we can now assess protein–ligand interactions using MS, as summarized in Figure 1. In this paper, we focus on the MS analyses of protein–ligand interactions, especially for MS under non-denaturing conditions and HDX-MS. We also discuss the possibility of drug screenings and analyses of interactions between membrane proteins and drugs using MS analysis.
Figure 1.
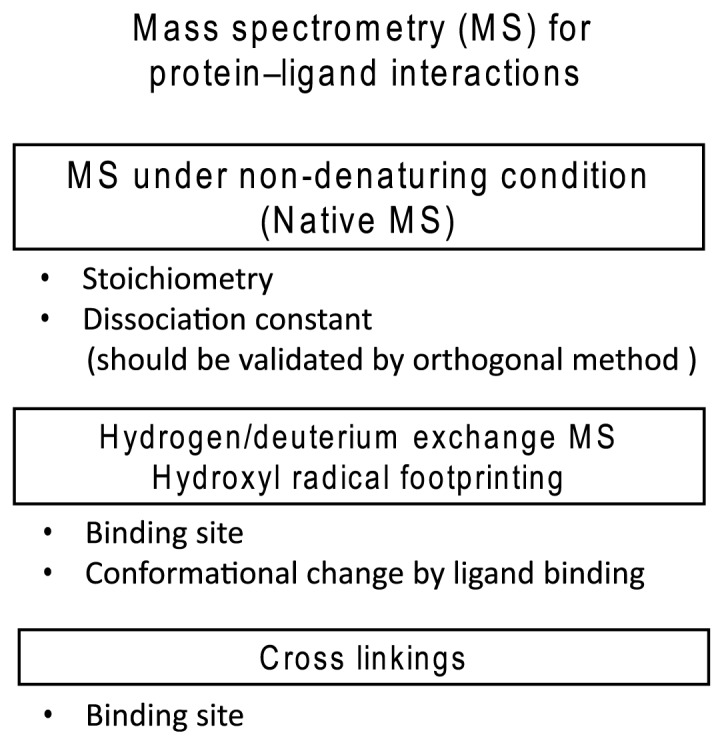
Summary of mass spectrometry (MS) studies of protein–ligand interactions.
I. Early MS studies of protein–ligand interactions
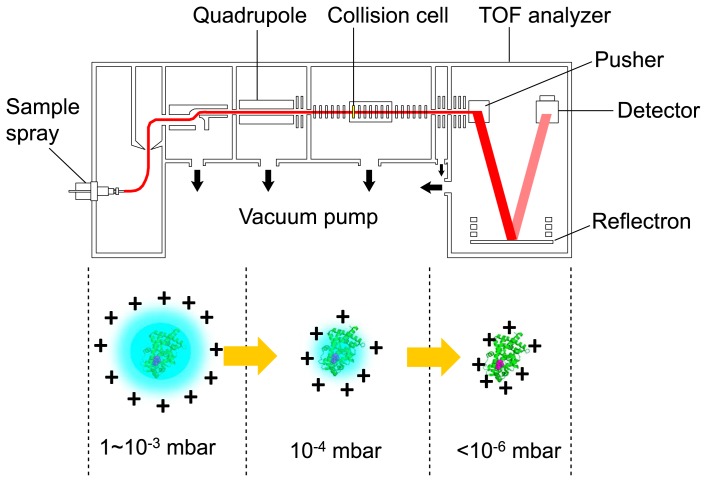
The earliest MS study of protein–ligand interactions focused on the interaction between cytoplasmic receptor FK506 binding protein (FKBP; 11,812 Da) and immunosuppressant FK506 (804 Da) (Table 1) [5]. The 1:1 complex of FKBP:FK506 was observed in 10 mM ammonium acetate at pH 7.5. The authors observed the protein–ligand interactions by electrospray ionization (ESI) MS. Katta and Chait reported the observation of the hemoglobin complex [6], and we recently reported three cases of protein–ligand interactions: nuclear receptor peroxisome proliferator-activated receptor γ (PPARγ)–endocrine disruptors [7], protein tyrosine phosphatase PTPRZ–inhibitor [8], and HIV-1 reverse transcriptase–drugs [9]. Typically, the MS study of protein–ligand complexes requires the modification of various components and conditions within a mass spectrometer. Higher pressures in the front end of the instrument are required to focus and decelerate the high-m/z ions of protein–ligand complexes. In addition, low-frequency quadrupoles might be required for the selection and/or transmission of the ions. MS is performed in vacuum (Fig. 2), and the hydrogen bonds, electrostatic interactions, and van der Waals forces are strengthened or unchanged by the transfer from the solution to the gas phase, while hydrophobic interactions are weakened [10]. Thus, protein–ligand complexes formed mainly through the former forces are retained, while those formed primarily through the latter forces are prone to be disrupted during MS.
Table 1.
Protein–ligand interactions measured by MS under non-denaturing conditions
| Proteins (peptides) | Ligands | KD (μM) | References | |
|---|---|---|---|---|
|
| ||||
| MS | Othersa | |||
| FK506 binding protein | FK506 (drug) | 0.0004 | [5] | |
| Globin | Heme | [6] | ||
| Vancomycinb | Peptide | 1–90 | 1–170 | [13] |
| OppA | Peptide | 56–2,900 | [22] | |
| Replication terminator protein | DNA | ≤0.002 | 0.0005 | [23] |
| Chorismate mutase | Inhibitor | 1.7 | 1.0 | [24] |
| RNase A | 2′CMPc | 2.0 | 1.0 | [25] |
| hGHbpd | Compounde | 0.76 | 0.7 | [14] |
| Beta-peptide | Zinc | 20 | [26] | |
| Antigen binding fragment | Hexasaccharide ligand | 6.3 | 5.9 | [27] |
| Norovirus P domain | HBGA oligosaccharide | 333–2,778 | [28] | |
| ABC transporterf | Drug and lipid | [21] | ||
methods except for MS,
glycopeptide,
cytidine 2′monophosphate,
the soluble domain of human growth hormone receptor,
neutral nonpolar compounds from the compound collection at Biovitrum AB,
ATPbinding cassette transporter P-glycoprotein.
Figure 2.
Electrospray ionization mass spectrometry (ESI-MS). A diagram of the mass spectrometer and a schematic of the electrospray-ionization process are shown. A protein–ligand complex is ionized by electrospray ionization followed by injection into a spectrometer. Under proper vacuum conditions, the solvent molecules gradually dissociate from the complex without the disruption of non-covalent interactions when the protein molecule passes through the low-vacuum chambers. Finally, the mass of the complex is measured under high vacuum by a time-of-flight (TOF) mass spectrometer (modified from [29]; https://www.jstage.jst.go.jp/article/biophys/55/5/55_270/_article/-char/ja/).
II. Parameters obtained from MS studies of protein–ligand interactions
Stoichiometry
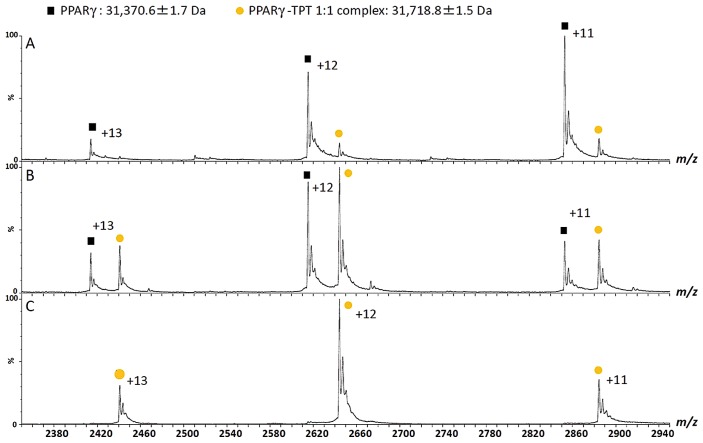
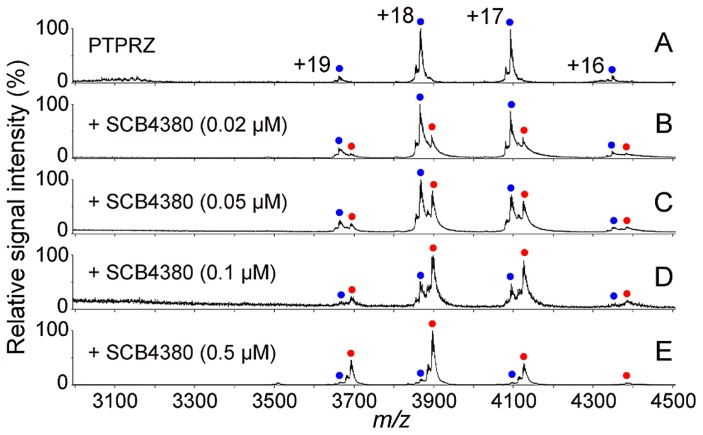
We can determine the stoichiometry of a protein–ligand complex from the mass shift. Figure 3 shows the ESI mass spectra of a nuclear receptor, PPARγ, with triphenyltin of endocrine disruptors [7]. Under denatured conditions obtained by, for example, adding formic acid to the sample solution, a 31,370.6 Da molecule corresponding to PPARγ is observed (Fig. 3A and B); under non-denaturing conditions, a 31,718.8 Da molecule corresponding to the PPARγ–triphenyltin complex is observed (Fig. 3C). This mass shift corresponds to the mass of triphenyltin. As another example, Figure 4 shows the ESI mass spectra of protein tyrosine phosphatase PTPRZ in the absence or presence of inhibitor SCB4380. In the absence of the inhibitor, the molecule with a mass of 70985.3 Da corresponding to PTPRZ is observed (Fig. 4A). After the addition of the inhibitor, a molecule with a mass of 70451.2 Da corresponding to the mass of the 1:1 complex is observed, and the relative amount of the complex increases dose-dependently (Fig. 4B–E).
Figure 3.
Mass spectra of the PPARγ–ligand binding domain complex with triphenyltin (TPT) under non-denaturing conditions. The PPARγ–ligand binding domain forms a complex with TPT in a 1:1 molar ratio (A–C). The mass patterns after the addition of aliquots of formic acid (A, 3%; B, 1%; C, 0%) to the complex indicate that the dissociation of the interaction is caused by the unfolding of the PPARγ–ligand binding domain (refer to [7]).
Figure 4.
One-to-one binding of the inhibitor SCB4380 to protein tyrosine phosphatase PTPRZ. MS spectra of PTPRZ in the presence of the inhibitor (A–E). PTPRZ was mixed with the inhibitor at the indicated concentrations, and inhibitor binding to PTPRZ was monitored by MS under non-denaturing conditions. Peaks corresponding to PTPRZ and the 1:1 PTPRZ-inhibitor complex are indicated by blue and red dots (with charge states), respectively (modified from [8]).
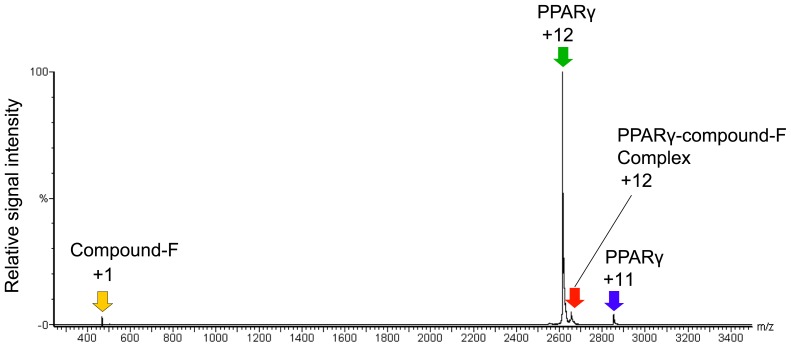
Furthermore, we can directly identify the composition of the complex by using MS/MS when a stable and strong MS signal is acquired. As shown in Figure 5, the complex molecule is selectively dissociated into its components, the protein and ligand, by MS/MS using collision-induced dissociation (CID) within the mass spectrometer, and their masses can then be precisely determined.
Figure 5.
Detection of components of a protein–ligand complex using MS/MS. The complex of the PPARγ–ligand binding domain and compound F (m/z 2,650; red arrow) were dissociated into the compound F (yellow arrow) and the PPARγ–ligand binding domain (green and blue arrows) by MS/MS.
Dissociation constant
The KD of a protein–ligand interaction can be estimated based on a dose-response or competition experiment. KD values ranging from 0.002 to 2,778 μM have been reported based on MS experiments (Table 1). The dose-response experiment can be performed by fixing the protein concentration while varying the ligand concentration, or vice versa [11]. The signal responses of the protein–ligand complex and the free protein in the mass spectra are not always the same, because the ion emission efficiency, transmission efficiency, and detector efficiency may be different between the complex and the free protein. To overcome this problem, Gabelica et al. introduced the response factor R, which is defined as [12]
| (Eq. 1) |
where P and PL indicate the signal intensities of a ligand-free protein and a protein–ligand complex, respectively, and [P]eq and [PL]eq indicate the concentrations of the ligand-free protein and protein–ligand complex, respectively, at equilibrium. The two variables, KD and R, are estimated based on the nonlinear fitting of an experimentally observed dose-response curve using the following equation (Eq. 2):
| (Eq. 2) |
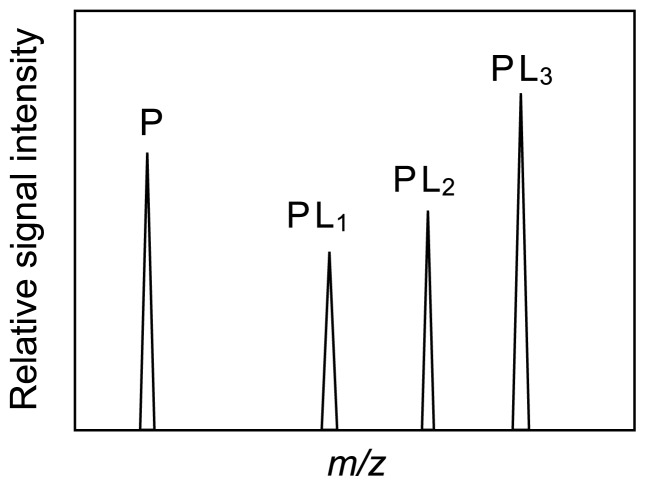
where [P]0 and [L]0 indicate the initial concentrations of protein and ligand, respectively. An alternative method to determine KD is via a competition experiment in which an equimolar mixture of several ligands is added to a protein in solution [13,14]. In this analysis, the KD values for the interactions between a protein and several different molecules can be determined simultaneously, assuming that the ion emission efficiencies of the different protein–ligand complexes and the free protein are all identical. An ESI mass spectrum for an equimolar mixture of a protein and three ligands is shown in Figure 6. The peaks for the free protein and the three complexes are observed simultaneously. In this case, the concentrations of the protein and the protein–ligand complex are expressed by the following equation:
Figure 6.
Mass spectrum for a competition experiment. P, PL1, PL2, and PL3 are the peaks corresponding to the ligand-free protein, protein–ligand1 complex, protein–ligand2 complex, and protein–ligand3 complex, respectively.
| (Eq. 3) |
where [Pi] refers to the concentration of the protein in different forms, [Pi]0 is the initial concentration of protein–ligand complexes, and P, PL1, PL2, and PL3 are the signal intensities of the free protein and those of the three complexes, respectively.
The KD values are expressed by the following equation:
| (Eq. 4) |
Thus, the KD values are estimated by substituting the protein and protein–ligand complex concentrations into Eq. 4. Good agreements were confirmed between the KD values derived from MS data and the published values that were determined by other methods [13].
Binding site
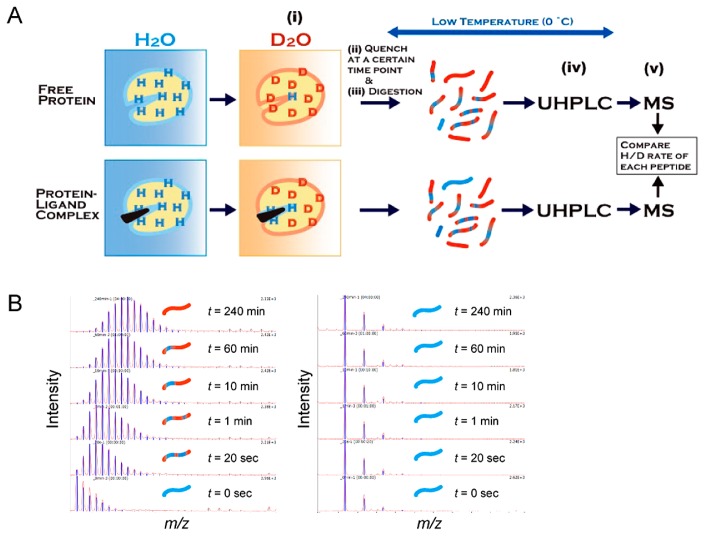
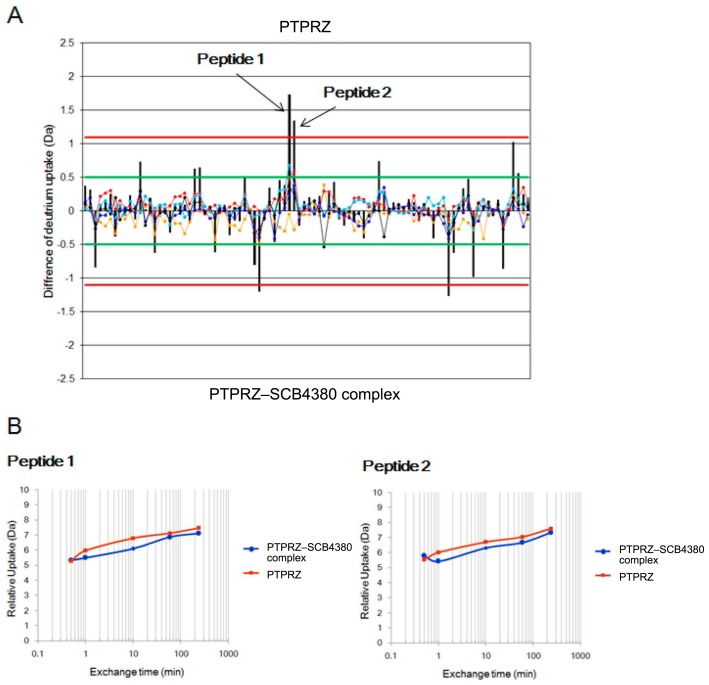
We can determine the binding sites of protein–ligand interactions from HDX-MS. HDX-MS reveals the structural changes and interaction sites between proteins and ligands by monitoring the exchange reaction from hydrogen to deuterium of the amide proton in a protein in D2O [15]. As shown in Figure 7, the amide hydrogen atoms in the peptides that are exposed on the protein’s surface but not involved in the secondary structure formation or the protein–ligand interactions exchange to deuterium rapidly (high H/D exchange rate), while those located inside the protein or at the sites of protein–ligand interaction are slowly exchanged (low H/D exchange rate). An HDX-MS experiment is carried out as follows: (i) a protein or protein–ligand complex is placed into deuterium buffer to start the exchange reaction, (ii) the exchange reaction is quenched by lowering the pH and temperature, (iii) the protein is digested into peptides through a pepsin-immobilized column, (iv) the peptide fragments are separated by reverse-phase liquid chromatography, and (v) the separated peptides are analyzed by MS and MS/MS. In order to minimize the back exchange reaction of amide deuterium, chromatographic separations are carried out at temperatures close to freezing temperature. In the recent HDX-MS studies of protein–ligand interactions, the exchange rates of the digested peptides were compared to those of the free protein and protein–ligand complex because this method is less influenced by the changes in experimental conditions between the free protein and protein–ligand complex; thus, this method can quickly provide reliable information on the interaction, although the absolute exchange rate of each peptide is difficult to estimate. In HDX-MS, there is essentially no limitation on the molecular weight of the target protein, and elaborate procedures such as crystallization or isotope labeling are not necessary. Furthermore, it is usually possible to clarify the interaction site within a short period compared to X-ray crystallography or NMR spectroscopy. Here, we introduce examples of protein–ligand interactions studied by HDX-MS. Griffin and colleagues used HDX-MS to study the interactions between PPARγ and various ligands; they revealed not only the region of ligand binding (helix 3) but also the ligand-induced change in the dynamics of helix 12 of the ligand-binding domain [16]. In this case, HDX-MS was complementary to X-ray crystallography because the ligand-induced changes in the dynamics of helix 12 of PPARγ captured by HDX-MS were not observed in the crystal structural analyses of free PPARγ and PPARγ–ligand complexes. Another example of a change in protein dynamics upon ligand biding was reported for the interaction of protein kinase A with cAMP by Hamuro et al. [17]. We reported an HDX-MS study to reveal the site of interaction between PTPRZ and the inhibitor SCB4380 (Fig. 8). The use of MS under non-denaturing conditions clarified that the inhibitor SCB4380 binds to PTPRZ in 1:1 stoichiometry. Ninety peptides commonly identified in PTPRZ and the PTPRZ-inhibitor complex were analyzed for the assessment of the H/D exchange rate. By incubating PP-A with the inhibitor, the HDX rate of PTPRZ was significantly decreased in two peptide fragments. When compared to the control without ligand incubation, the incubated peptides contained the catalytic residues of PTPRZ. On the other hand, no changes were observed in the HDX rates of the peptides from other regions. These results strongly suggest that the inhibitor specifically binds to the catalytic site of PTPRZ, thereby inhibiting its catalytic activity. Note that the interaction sites discussed above were determined at resolutions of 5–20 amino acids; determination at higher resolution is difficult using typical MS/MS fragmentation methods such as CID because of the scrambling of amide hydrogen and deuterium during fragmentation. On the other hand, it is now possible to identify binding sites at a resolution of one amino acid residue using electron transfer dissociation as the MS/MS fragmentation method alternative to CID. For example, Landgraf et al. reported that two Gln residues located at the helix 3 of PPARγ are directly involved in its interaction with rosiglitazone [18].
Figure 7.
Schematic presentation of hydrogen/deuterium exchange mass spectrometry (HDX-MS). (A) An experimental flowchart of HDX-MS for protein–ligand interactions. (i) A free protein or protein–ligand complex is placed into deuterium buffer to start the exchange reaction, (ii) the exchange reaction is quenched by lowering the pH and temperature, (iii) the protein is digested into peptides through the pepsin-immobilized column, (iv) the peptide fragments are separated by ultra-high performance reverse-phase liquid chromatography (UHPLC), and (v) the separated peptides are analyzed by MS and MS/MS. (B) Amide hydrogen in a peptide that is exposed to solvent and not involved in the secondary formation is rapidly exchanged with deuterium, leading to a mass increase by the H/D exchange reaction (left), while peptides located at the site of protein–ligand interaction show slow or no exchange during the observation period (right).
Figure 8.
HDX-MS analysis for determining the binding site between protein tyrosine phosphatase PTPRZ and the inhibitor SCB4380. (A) Differential plot of the average HDX data for the phosphatase peptides without the inhibitor versus with the inhibitor. The orange, red, cyan, blue, and black lines correspond to the average mass difference values calculated for HDX-MS data acquired at different time points. The black vertical bar for each peptide is the sum of the mass differences observed for each peptide. The green lines at ±0.5 Da from the Y axis represent the theoretical 98% confidence limit for each mass difference data time point, whereas the black lines ±1.1 Da from the Y axis values represent the 98% confidence limit for the sum of the mass difference data for each peptide [30]. (B) The hydrogen uptake ratios of two peptide-containing binding sites at different time points (modified from [8]).
III. Drug screening using MS
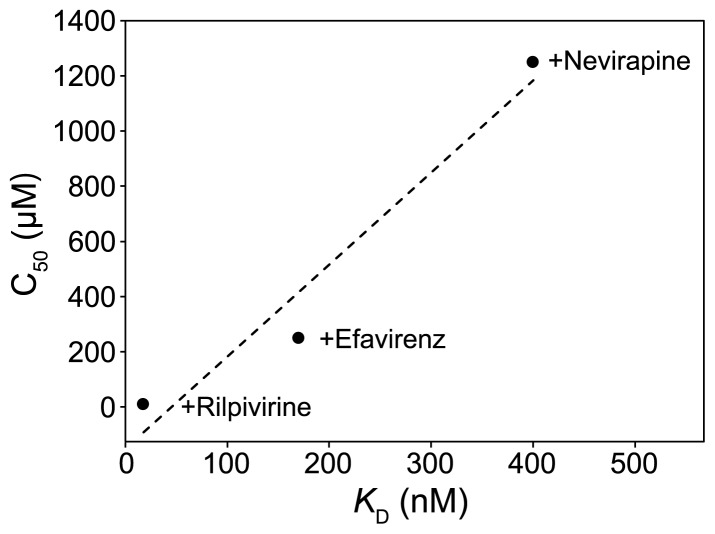
Although no report on high-throughput drug screening using MS under non-denaturing conditions has been published to date, MS shows potential for this application. Bovet el al. reported the interactions of an estrogen receptor with low-molecular-weight compounds [19]. They compared the affinities of estrogen, the compounds, an endocrine disrupter, and a phyto-hormone for the estrogen receptor using MS competition experiments and showed that the rank order of the estimated affinities are consistent with their reported KD values. We recently examined the interaction of the human immunodeficiency virus-1 reverse transcriptase (HIV-1 RT) with drugs in different generations by MS under non-denaturing conditions [9]. The half-concentrations of the drugs where the peak intensities of the HIV-1 RT-drug complexes were equal to those of free HIV-1 RT were well-correlated with the KD values reported in the literature (Fig. 9). These results suggest that this MS method under non-denaturing conditions can be utilized for affinity-based drug screenings.
Figure 9.
Correlation between the KD values and the relative affinities estimated from MS titration data for an inhibitor binding to human immunodeficiency virus-1 reverse transcriptase (HIV-1 RT). The C50 value indicates the inhibitor concentration (μM) at which 50% of total HIV-1 RT is complexed with each inhibitor. The KD values of rilpivirine, efavirenz, and nevirapine have been reported in the literature [31,32] (modified from [9]).
MS under non-denaturing conditions requires the isotope incorporation, modification, or immobilization of neither the drugs nor the target proteins. Since this technique directly provides the total masses of drug–protein complexes, we can determine the stoichiometry of the protein–drug interaction, and in some cases, even derive the value of KD. One of the most important areas of progress related to the MS study of protein–drug interactions is the measurement of membrane proteins [20]; for example, Robinson’s group recently reported the interaction of a drug with a membrane protein [21].
Conclusion
MS is now one of the most powerful and efficient methods for studying protein–ligand interactions. In particular, interaction stoichiometry can be precisely and quickly determined by MS under non-denaturing conditions. Several studies have shown that the KD of a protein–ligand interaction can also be estimated under a few assumptions. However, while the relative affinity of a protein–ligand interaction can be accurately estimated by MS under non-denaturing conditions, the absolute KD should be validated using orthogonal methods such as SPR and ITC. When the interaction site is determined using HDX-MS, validation of the identified site is highly recommended using different methods. Interaction analysis using proteins with the replacement of amino acids located at the identified sites and/or docking simulation analysis are methods usable for such a validation.
Significance.
Recent advancement in mass spectrometry (MS) enables us to know the molecular masses of protein ligand complexes without a disruption of non-covalent interactions. This method is called as MS under non-denaturing condition or native MS. Thus, one can know the stoichiometry of a protein–ligand interaction unambiguously. Also attempts to determine the dissociation constant of a protein–ligand interaction have been made by MS under a few assumptions. The location of the interaction and conformational change in a protein can be analyzed by hydrogen/deuterium exchange MS. This article describes how MS is effective in the study on protein–ligand interactions.
Acknowledgements
This work was supported by the Okazaki ORION project and by the Joint Studies Program (2014–2015) in the Okazaki BIO-NEXT project of the Okazaki Institute for Integrative Bioscience. The authors would like to thank Enago (www.enago.jp) for the English language review.
Footnotes
Conflicts of interest
K. I., M. N., and S. U. declare that they have no conflict of interest.
Author contributions
All authors wrote and reviewed the manuscript.
References
- 1.Hernandez H, Robinson CV. Determining the stoichiometry and interactions of macromolecular assemblies from mass spectrometry. Nat Protoc. 2007;2:715–726. doi: 10.1038/nprot.2007.73. [DOI] [PubMed] [Google Scholar]
- 2.Zhang J, Chalmers MJ, Stayrook KR, Burris LL, Wang Y, Busby SA, et al. DNA binding alters coactivator interaction surfaces of the intact VDR-RXR complex. Nat Struct Mol Biol. 2011;18:556–563. doi: 10.1038/nsmb.2046. [DOI] [PMC free article] [PubMed] [Google Scholar]
- 3.Stocks BB, Konermann L. Time-dependent changes in side-chain solvent accessibility during cytochrome c folding probed by pulsed oxidative labeling and mass spectrometry. J Mol Biol. 2010;398:362–373. doi: 10.1016/j.jmb.2010.03.015. [DOI] [PubMed] [Google Scholar]
- 4.Herzog F, Kahraman A, Boehringer D, Mak R, Bracher A, Walzthoeni T, et al. Structural probing of a protein phosphatase 2A network by chemical cross-linking and mass spectrometry. Science. 2012;337:1348–1352. doi: 10.1126/science.1221483. [DOI] [PubMed] [Google Scholar]
- 5.Ganem B, Li Y, Henion J. Detection of noncovalent receptor ligand complexes by mass-spectrometry. J Am Chem Soc. 1991;113:6294–6296. [Google Scholar]
- 6.Katta V, Chait B. Observation of the heme globin complex in native myoglobin by electrospray-ionization mass-spectrometry. J Am Chem Soc. 1991;113:8534–8535. [Google Scholar]
- 7.Harada S, Hiromori Y, Nakamura S, Kawahara K, Fukakusa S, Maruno T, et al. Structural basis for PPARγ transactivation by endocrine-disrupting organotin compounds. Sci Rep. 2015;5:8520. doi: 10.1038/srep08520. [DOI] [PMC free article] [PubMed] [Google Scholar]
- 8.Fujikawa A, Nagahira A, Sugawara H, Ishii K, Imajo S, Matsumoto M, et al. Small-molecule inhibition of PTPRZ reduces tumor growth in a rat model of glioblastoma. Sci Rep. 2016;6:20473. doi: 10.1038/srep20473. [DOI] [PMC free article] [PubMed] [Google Scholar]
- 9.Thammaporn R, Ishii K, Yagi-Utsumi M, Uchiyama S, Hannongbua S, Kato K. Mass spectrometric characterization of HIV-1 reverse transcriptase interactions with non-nucleoside reverse transcriptase inhibitors. Bio Pharm Bull. doi: 10.1248/bpb.b15-00880. in press. [DOI] [PubMed] [Google Scholar]
- 10.Daniel J, Friess S, Rajagopalan S, Wendt S, Zenobi R. Quantitative determination of noncovalent binding interactions using soft ionization mass spectrometry. Int J Mass Spectrom. 2002;216:1–27. [Google Scholar]
- 11.Sannes-Lowery K, Griffey R, Hofstadler S. Measuring dissociation constants of RNA and aminoglycoside antibiotics by electrospray ionization mass spectrometry. Anal Biochem. 2000;280:264–271. doi: 10.1006/abio.2000.4550. [DOI] [PubMed] [Google Scholar]
- 12.Gabelica V, Galic N, Rosu F, Houssier C, De Pauw E. Influence of response factors on determining equilibrium association constants of non-covalent complexes by electrospray ionization mass spectrometry. J Mass Spectrom. 2003;38:491–501. doi: 10.1002/jms.459. [DOI] [PubMed] [Google Scholar]
- 13.Jorgensen T, Roepstorff P, Heck A. Direct determination of solution binding constants for noncovalent complexes between bacterial cell wall peptide analogues and vancomycin group antibiotics by electrospray ionization mass spectrometry. Anal Chem. 1998;70:4427–4432. [Google Scholar]
- 14.Tjernberg A, Carnö S, Oliv F, Benkestock K, Edlund PO, Griffiths WJ, et al. Determination of dissociation constants for protein-ligand complexes by electrospray ionization mass spectrometry. Anal Chem. 2004;76:4325–4331. doi: 10.1021/ac0497914. [DOI] [PubMed] [Google Scholar]
- 15.Zhang J, Chalmers M, Stayrook K, Burris L, Garcia-Ordonez R, Pascal B, et al. Hydrogen/deuterium exchange reveals distinct agonist/partial agonist receptor dynamics within vitamin D receptor/retinoid X receptor heterodimer. Structure. 2010;18:1332–1341. doi: 10.1016/j.str.2010.07.007. [DOI] [PMC free article] [PubMed] [Google Scholar]
- 16.Bruning JB, Chalmers MJ, Prasad S, Busby SA, Kamenecka TM, He Y, et al. Partial agonists activate PPARgamma using a helix 12 independent mechanism. Structure. 2007;15:1258–1271. doi: 10.1016/j.str.2007.07.014. [DOI] [PubMed] [Google Scholar]
- 17.Hamuro Y, Anand GS, Kim JS, Juliano C, Stranz DD, Taylor SS, et al. Mapping intersubunit interactions of the regulatory subunit (RIalpha) in the type I holoenzyme of protein kinase A by amide hydrogen/deuterium exchange mass spectrometry (DXMS) J Mol Biol. 2004;340:1185–1196. doi: 10.1016/j.jmb.2004.05.042. [DOI] [PubMed] [Google Scholar]
- 18.Landgraf R, Chalmers M, Griffin P. Automated hydrogen/deuterium exchange electron transfer dissociation high resolution mass spectrometry measured at single-amide resolution. J Am Soc Mass Spectrom. 2012;23:301–309. doi: 10.1007/s13361-011-0298-2. [DOI] [PMC free article] [PubMed] [Google Scholar]
- 19.Bovet C, Wortmann A, Eiler S, Granger F, Ruff M, Gerrits B, et al. Estrogen receptor-ligand complexes mea sured by chip-based nanoelectrospray mass spectrometry: an approach for the screening of endocrine disruptors. Protein Sci. 2007;16:938–946. doi: 10.1110/ps.062664107. [DOI] [PMC free article] [PubMed] [Google Scholar]
- 20.Zhou M, Morgner N, Barrera NP, Politis A, Isaacson SC, Matak-Vinković D, et al. Mass spectrometry of intact V-type ATPases reveals bound lipids and the effects of nucleotide binding. Science. 2011;334:380–385. doi: 10.1126/science.1210148. [DOI] [PMC free article] [PubMed] [Google Scholar]
- 21.Marcoux J, Wang SC, Politis A, Reading E, Ma J, Biggin PC, et al. Mass spectrometry reveals synergistic effects of nucleotides, lipids, and drugs binding to a multidrug resistance efflux pump. Proc Natl Acad Sci USA. 2013;110:9704–9709. doi: 10.1073/pnas.1303888110. [DOI] [PMC free article] [PubMed] [Google Scholar]
- 22.Rostom A, Tame J, Ladbury J, Robinson C. Specificity and interactions of the protein OppA: partitioning solvent binding effects using mass spectrometry. J Mol Biol. 2000;296:269–279. doi: 10.1006/jmbi.1999.3431. [DOI] [PubMed] [Google Scholar]
- 23.Kapur A, Beck J, Brown S, Dixon N, Sheil M. Use of electrospray ionization mass spectrometry to study binding interactions between a replication terminator protein and DNA. Protein Sci. 2002;11:147–157. doi: 10.1110/ps.27702. [DOI] [PMC free article] [PubMed] [Google Scholar]
- 24.Wendt S, Mccombie G, Daniel J, Kienhofer A, Hilvert D, Zenobi R. Quantitative evaluation of noncovalent chorismate mutase-inhibitor binding by ESI-MS. J Am Soc Mass Spectrom. 2003;14:1470–1476. doi: 10.1016/j.jasms.2003.08.003. [DOI] [PubMed] [Google Scholar]
- 25.Zhang S, Van Pelt CK, Wilson DB. Quantitative determination of noncovalent binding interactions using automated nanoelectrospray mass spectrometry. Anal Chem. 2003;75:3010–3018. doi: 10.1021/ac034089d. [DOI] [PubMed] [Google Scholar]
- 26.Wortmann A, Rossi F, Lelais G, Zenobi R. Determination of zinc to beta-peptide binding constants with electrospray ionization mass spectrometry. J Mass Spectrom. 2005;40:777–784. doi: 10.1002/jms.852. [DOI] [PubMed] [Google Scholar]
- 27.Kitova E, El-Hawiet A, Schnier P, Klassen J. Reliable determinations of protein-ligand interactions by direct ESI-MS measurements. Are we there yet? J Am Soc Mass Spectrom. 2012;23:431–441. doi: 10.1007/s13361-011-0311-9. [DOI] [PubMed] [Google Scholar]
- 28.Han L, Kitov P, Kitova E, Tan M, Wang L, Xia M, et al. Affinities of recombinant norovirus P dimers for human blood group antigens. Glycobiology. 2013;23:276–285. doi: 10.1093/glycob/cws141. [DOI] [PMC free article] [PubMed] [Google Scholar]
- 29.Uchiyama S, Noda M, Ishii K. Analysis of higher order structures of proteins by mss spectrometry. Seibutsu Butsuri. 2015;55:270–273. [Google Scholar]
- 30.Houde D, Berkowitz SA, Engen JR. The utility of hydrogen/deuterium exchange mass spectrometry in biopharmaceutical comparability studies. J Pharm Sci. 2011;100:2071–2086. doi: 10.1002/jps.22432. [DOI] [PMC free article] [PubMed] [Google Scholar]
- 31.Silprasit K, Thammaporn R, Hannongbua S, Choowongkomon K. Cloning, expression, purification, determining activity of recombinant HIV-1 reverse transcriptase. Kasetsart J (Nat Sci) 2008;42:231–239. [Google Scholar]
- 32.Singh K, Marchand B, Rai D, Sharma B, Michailidis E, Ryan E, et al. Biochemical mechanism of HIV-1 resistance to rilpivirine. J Biol Chem. 2012;287:38110–38123. doi: 10.1074/jbc.M112.398180. [DOI] [PMC free article] [PubMed] [Google Scholar]


