Abstract
Information of paddy rice distribution is essential for food production and methane emission calculation. Phenology-based algorithms have been utilized in the mapping of paddy rice fields by identifying the unique flooding and seedling transplanting phases using multi-temporal moderate resolution (500 m to 1 km) images. In this study, we developed simple algorithms to identify paddy rice at a fine resolution at the regional scale using multi-temporal Landsat imagery. Sixteen Landsat images from 2010–2012 were used to generate the 30 m paddy rice map in the Sanjiang Plain, northeast China—one of the major paddy rice cultivation regions in China. Three vegetation indices, Normalized Difference Vegetation Index (NDVI), Enhanced Vegetation Index (EVI), and Land Surface Water Index (LSWI), were used to identify rice fields during the flooding/transplanting and ripening phases. The user and producer accuracies of paddy rice on the resultant Landsat-based paddy rice map were 90% and 94%, respectively. The Landsat-based paddy rice map was an improvement over the paddy rice layer on the National Land Cover Dataset, which was generated through visual interpretation and digitalization on the fine-resolution images. The agricultural census data substantially underreported paddy rice area, raising serious concern about its use for studies on food security.
Keywords: phenology, flooding, transplanting, ripening, land use
1 Introduction
Rice is the world’s second-largest crop and is a major food staple, feeding more than half of the world’s population (Van Nguyen and Ferrero, 2006). It plays an important role in ensuring global food security. Global rice consumption has been predicted to exceed rice production (Kuenzer and Knauer, 2013). Approximately 95% of global rice is cultivated on flooded soil (Belder et al., 2004). Irrigation for rice cultivation requires large amounts of water and has an important impact on water quality. In addition, rice fields are one of the main sources of greenhouse gas emissions (Li et al., 2004). Therefore, accurate high-resolution maps of paddy rice distribution are critical for food production, water management, agriculture migration, and agriculture adaption under global climate change (Döll, 2002).
Remote sensing is an efficient tool for generating paddy rice maps. The potentials of fine-resolution satellite imagery, such as 20 m SPOT and 30/79 m Landsat, for classifying paddy rice fields have been explored (McCloy et al., 1987; Panigrahy and Parihar, 1992; Okamoto and Fukuhara, 1996; Laba et al., 1997; Okamoto et al., 1998; Turner and Congalton, 1998). Single images were typically used in earlier studies due to the limited availability of satellite imagery. Rice fields were visually interpreted from color composite images, and their boundaries were then artificially digitalized onscreen (Rao and Rao, 1987; Qiu et al., 2003; Liu et al., 2005). Other studies used the supervised or unsupervised classification algorithms to identify the spectral cluster of paddy rice (Panigrahy and Parihar, 1992; Laba et al., 1997; Okamoto et al., 1998; Turner and Congalton, 1998). However, the application of these two approaches at regional or national scales is often labor-intensive and time-consuming. Changes in research personnel and methods over time make it particularly difficult to obtain consistent classification results in the projects that analyze multiple-year images.
The Moderate Resolution Imaging Spectroradiometer (MODIS) provides global coverage of imagery every 1–2 days at 250 m, 500 m, and 1 km, and is free to the public. The phenology-based algorithm developed on the multi-temporal MODIS data has shown a great potential for tracking the dynamics of the vegetation-to-water ratio during the rice growth, and can consistently map the annual paddy rice distribution at regional scales (Xiao et al., 2005; Sakamoto et al., 2006; Xiao et al., 2006; Sakamoto et al., 2009a, b; Biradar and Xiao, 2011). However, the accuracy of the MODIS phenology-based paddy rice maps was still questionable due to the mixed pixels caused by the coarse spatial resolution; a problem especially relevant in Asia, with over 200 million smallholding farms, typically under 1 hectare (Xiao et al., 2006; Sun et al., 2009). One solution is the use of multi-temporal high-resolution imagery (Xiao et al., 2006).
The United States Geological Survey (USGS) Earth Resources Observation and Science (EROS) Center has offered free historical and new Landsat imagery to the public since 2008. This provided a great opportunity for regional-scale land cover classification. One significant accomplishment was the capability to track forest cover dynamics by using multi-temporal Landsat imagery (Hansen et al., 2013). Some studies tracked the continuous dynamics of spectral features derived from all available Landsat imagery across multi-years to identify forest and forest disturbance (Masek et al., 2008; Huang et al., 2010a; Zhu et al., 2012). Several others extracted the annual trajectory of image features from yearly Landsat imagery, such as using one image within the peak of the annual growing season (Cohen et al., 2010; Kennedy et al., 2010). Another study evaluated the spectral features of the forest during different phenological phases, then screened the specific phases when the forest showed spectral features that were distinguishable from other land types (Dong et al., 2013).
The potential of multi-temporal Landsat imagery to monitor crops has been underestimated due to their spectral and phenological variability features (Zhong et al., 2014). Recent studies have highlighted the capability of intra-annual Landsat to identify corn and soybean (Zhong et al., 2014; Müller et al., 2015). Therefore, we hypothesize that paddy rice distribution mapping will benefit from the phenological features captured by multi-temporal Landsat imagery. We examined if single dates of phenological or spectral characteristics from the Landsat imagery with low-observation frequency could be extracted for paddy rice. For example, could multi-temporal Landsat imagery track the dynamics of the vegetation-to-water ratio for rice fields similarly to the use of MODIS data?
The objective of this study is to: (i) develop the Landsat phenology-based scheme to identify paddy rice fields during two phenological (flooding/transplanting and ripening) phases at regional scales, and (ii) systematically evaluate the accuracy and uncertainties of the resultant Landsat-based paddy rice map.
2 Materials and methods
2.1 Study area
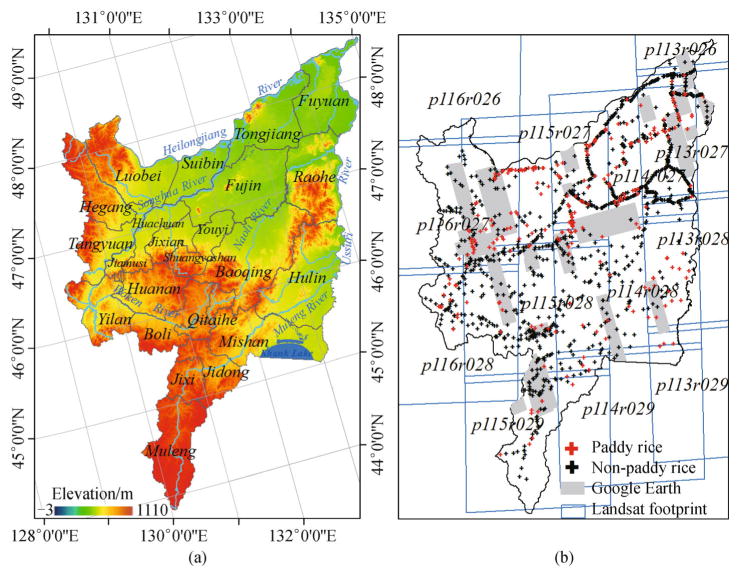
The Sanjiang Plain is located in the northeast region of Heilongjiang Province, China (129.19°E–135.08°E, 43.83°N–48.45°N). It covers 23 counties with a total area of 10.88 × 10⁴ km2. Approximately 80% of the Sanjiang Plain is relatively flat with an elevation < 200 m (Fig. 1(a)). The plain is characterized by a temperate and sub-humid continental monsoon climate, with a mean annual precipitation of 500–650 mm, the majority of which falls between July and September. The mean monthly temperature varies from −18°C in January to 22 °C in July. The typical land cover types were cropland, woodland, and natural wetland, accounting for 55.2%, 30.3%, and 7.4% of the entire area, respectively (Huang et al., 2010b).
Fig. 1.
(a) Geographic location of the Sanjiang Plain, northeast China; (b) location of all Landsat footprints, high-resolution images available on Google Earth, and ground truth pointes collected in 2011.
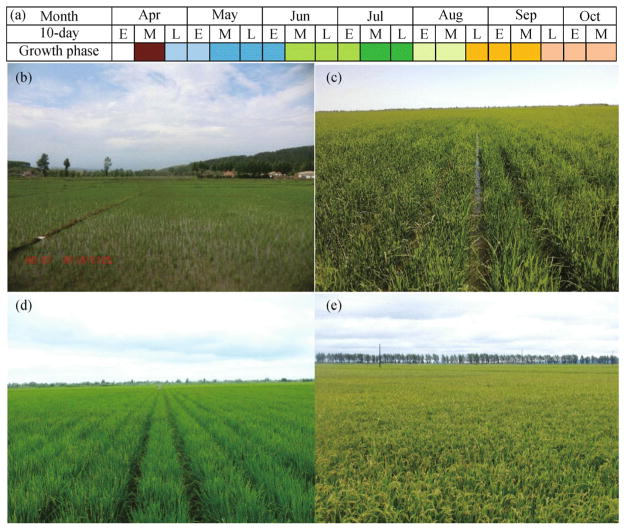
The abundant water resources and fertile soils, along with the flat topography, make the Sanjiang Plain favorable for paddy rice cultivation. Rice cultivation is relatively identical across the entire Sanjiang Plain (Zhang et al., 2011). One rice crop per year is cultivated in this region with a rice growth cycle duration of approximately 140–150 days (Fig. 2(a)). From mid-April to early May, rice fields are prepared by plowing, overturning, flooding, and leveling. In mid- to late May, rice seedlings are transplanted to flooded fields. During these two phases, rice fields are mostly dominated by water (Fig. 2(b)). Rice canopy starts to rise rapidly during the vegetative growing phase (tillering and stem elongation) from mid-June to early July (Fig. 2(c)), resulting in changes of the vegetation-to-water ratio. The reproductive phase starts in mid-July (panicle initiation, Fig. 2(d)), the vegetation-to-water ratio reaches its maximum value in late July, and then remains stable or slightly decreases during the ripening phase from late August to September (Fig. 2(e)). Rice is harvested from late September to early October.
Fig. 2.
(a) Rice cropping calendar in the Sanjiang Plain; (b) rice transplanting stage (06/18/2013); (c) stem elongation stage (07/10/2013); (d) panicle initiation stage (07/21/2013); (e) mature stage (08/24/2011).
2.2 Landsat images and preprocessing
The Sanjiang Plain is covered by 13 Landsat footprints (Fig. 1(b)). 119 L1T Landsat images from 2010–2012 were collected from http://landsat.usgs.gov/ and were used to extract the multi-temporal curves of the Landsat vegetation indices for typical land cover types. Sixteen images were eventually used to generate the paddy rice map after examining three criteria (Table 1): 1) image acquisition date was during the peak of the transplanting/flooding and ripening phases when paddy rice showed the distinguishably phenological or spectral features from other land types; 2) cloud coverage was less than 5%; and 3) the gap-filling strategy (see Section 2.5).
Table 1.
A list of Landsat images collected for mapping the paddy rice distribution in the Sanjiang Plain, northeast China
| Path/Row | Sensor | Date | Year | Cloud/% | Rice growing phase |
|---|---|---|---|---|---|
| 113/026 | TM | September-19 | 2011 | 0 | Ripening |
| 113/027 | TM | September-19 | 2011 | 0 | Ripening |
| 114/027 | TM | June-25 | 2011 | 1 | Transplanting |
| TM | June-06 | 2010 | 0 | Transplanting | |
| TM | June-25 | 2011 | 0 | Transplanting | |
| 114/028 | ETM + | September-21 | 2011 | 0 | Ripening |
| ETM + | September-07 | 2012 | 0 | Ripening | |
| 114/029 | TM | June-25 | 2011 | 0 | Transplanting |
| 115/027 | ETM + | August-27 | 2011 | 0 | Ripening |
| ETM + | June-26 | 2012 | 0 | Transplanting | |
| 115/028 | ETM + | September-12 | 2011 | 0 | Ripening |
| ETM + | September-09 | 2010 | 1 | Ripening | |
| 115/029 | ETM + | August-27 | 2011 | 3 | Ripening |
| ETM + | June-26 | 2012 | 0 | Transplanting | |
| 116/027 | TM | September-11 | 2011 | 0 | Ripening |
| 116/028 | TM | September-11 | 2011 | 0 | Ripening |
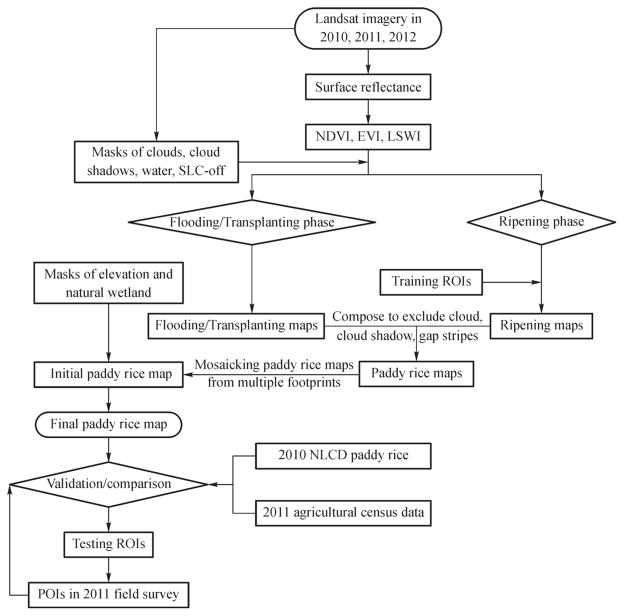
All images were first processed for atmospheric correction and converted to surface reflectance using the Landsat Ecosystem Disturbance Adaptive Processing System (LEDAPS) (Fig. 3) (Vermote et al., 1997; Masek et al., 2008). Masks for clouds, cloud shadows, clear water, and data gaps due to Landsat 7 ETM + SLC-off (Scan Line Corrector failed) were created for each Landsat scene using the object-based cloud and cloud shadow algorithm, Fmask (Zhu and Woodcock, 2012).
Fig. 3.
Workflow for mapping paddy rice distribution using the multi-temporal Landsat images.
Three vegetation indices were calculated using surface reflectance (ρ) from the blue (B1), red (B3), NIR (B4), and SWIR (B5) bands: 1) Normalized Difference Vegetation Index (NDVI) (Tucker, 1979), 2) Enhanced Vegetation Index (EVI) (Huete et al., 1997, 2002), and 3) Land Surface Water Index (LSWI) (Xiao et al., 2004).
| (1) |
| (2) |
| (3) |
2.3 Algorithm for mapping paddy rice during the flooding/transplanting phase
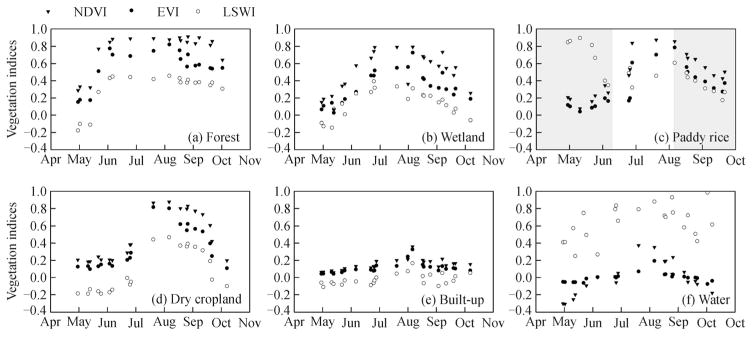
We first chose one ground truth point for each land type, which was collected during the 2011 field investigation. Three vegetation indices were then extracted from multi-temporal Landsat imagery from 2010–2012 for the pixel where the ground truth point was located (Fig. 4). Paddy rice showed a unique inversion between LSWI and EVI (NDVI) during the flooding/transplanting period: LSWI was substantially higher than EVI (NDVI) during early May and late June. Thus, a pixel was paddy rice when the condition LSWI + 0.05 > EVI (NDVI) was met in the flooding/transplanting phase. This was consistent with the MODIS phenology-based algorithm (Xiao et al., 2005, 2006).
Fig. 4.
Seasonal dynamics of Landsat-based vegetation indices (NDVI, EVI, and LSWI) for typical land types.
2.4 Algorithm for mapping paddy rice during the ripening phase
Paddy rice also showed unique features during the ripening phase (Fig. 4). From late August to late September, forest NDVI remained high (around 0.8). However, paddy rice NDVI fell below 0.8 (Fig. 4(a) vs. 4(c)). Built-up had much lower LSWI (around 0) than did paddy rice (> 0.2) (Fig. 4(c) vs. 4(e)). Paddy rice had smaller differences between EVI (NDVI) and LSWI. Thus, the rule-based decision trees were deployed on LSWI, NDVI, and (NDVI + EVI)/2-LSWI to map the ripening paddy rice. Here the image on the 254th day in 2011 for path/row = 116/027 (116/027-254/2011) was used as an example to illustrate the procedures to build the decision rules and determine the optimal threshold values.
Step 1 Selection of training regions of interest (ROIs): homogenous ROIs were visually interpreted and digitalized on the Landsat false color composite (FCC) image of LSWI, NDVI, and (NDVI + EVI)/2-LSWI for paddy rice (22 ROIs with 1,077 pixels), dry cropland (22 ROIs with 1,077 pixels), forest (44 ROIs with 974 pixels), and built-up and bare land (21 ROIs with 989 pixels).
Step 2 Evaluation of ROI separability: the Jeffries-Matusita (J-M) distances of the ROI pairs between paddy rice and other land types were calculated (Richards, 1999). All J-M distances were above 1.9, which suggested that paddy rice had great separability from other land types using the training ROIs collected from the Landsat FCC image.
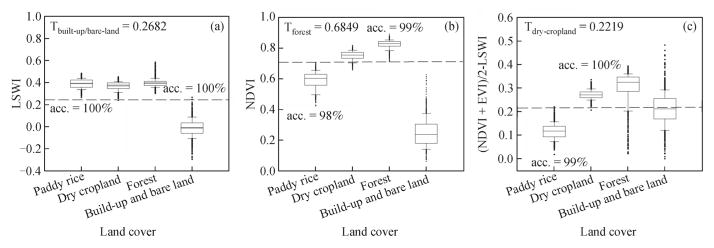
Step 3 Statistical distribution of ROIs: paddy rice showed distinguishable statistical distributions (Fig. 5). The built-up and bare land LSWI ranged from −0.2 to 0.2 and was significantly lower than paddy rice (Fig. 5(a)). The forest NDVI was above 0.7, much higher than paddy rice (Fig. 5(b)). The paddy rice (NDVI + EVI)/2-LSWI ranged below 0.2 and was lower than dry cropland (Fig. 5(c)).
Fig. 5.
Statistic distribution of LSWI, NDVI, and (NDVI + EVI)/2-LSWI for paddy rice, dry cropland, forest, and built-up area on the 116/027-254/2011 (acc. represents accuracy).
Step 4 Determination of the optimal thresholds: the optimal thresholds were calculated using regression trees from the training ROIs: Tbuilt-up/bare-land= 0.2682 for LSWI, Tforest= 0.6849 for NDVI, and Tdry-cropland= 0.2219 for (NDVI + EVI)/2-LSWI.
Step 5 Implementation of the decision rules: the decision rules and threshold values were deployed on LSWI, NDVI, and (NDVI + EVI)/2-LSWI.
The steps above were implemented on the Landsat images during the ripening phase. The threshold values were calculated using regression trees in R Project, Version 3.0.1 with a prediction accuracy above 95% (Table 2).
Table 2.
The threshold values as the inputs of rule-bases decision trees for the Landsat images during the rice ripening phase
| Landsat Image | Path/Row | Date | Image Features | Threshold |
|---|---|---|---|---|
| 113/027-262/2010 113/026-262/2010 |
113/027 113/026 |
09/19/2010 | LSWI | 0.1158 |
| NDVI | 0.7057 | |||
| (NDVI + EVI)/2-LSWI | 0.2541 | |||
| 114/028-264/2011 | 114/028 | 09/21/2011 | LSWI | 0.2035 |
| NDVI | 0.6692 | |||
| (NDVI + EVI)/2-LSWI | 0.2081 | |||
| 114/028-251/2012 | 114/028 | 09/07/2012 | LSWI | 0.2702 |
| NDVI | 0.7639 | |||
| (NDVI + EVI)/2-LSWI | 0.2918 | |||
| 115/027-239/2011 | 115/027 | 08/27/2011 | LSWI | 0.3422 |
| NDVI | 0.8137 | |||
| (NDVI + EVI)/2-LSWI | 0.2327 | |||
| 115/028-255/2011 | 115/028 | 09/12/2011 | LSWI | 0.1984 |
| NDVI | 0.7518 | |||
| (NDVI + EVI)/2-LSWI | 0.2368 | |||
| 115/028-252/2010 | 115/028 | 09/09/2010 | LSWI | 0. 2010 |
| NDVI | 0.7090 | |||
| (NDVI + EVI)/2-LSWI | 0.2566 | |||
| 115/029-239/2011 | 115/029 | 08/27/2011 | LSWI | 0.3371 |
| NDVI | 0.8339 | |||
| (NDVI + EVI)/2-LSWI | 0.2721 | |||
| 116/027-254/2011 116/028-254/2011 |
116/027 116/028 |
09/11/2011 | LSWI | 0.2682 |
| NDVI | 0.6849 | |||
| (NDVI + EVI)/2-LSWI | 0.2219 |
The algorithm robustness was evaluated by the accuracy assessment for three Landsat scenes (116/027-254/2011, 114/028-264/2011, and 114/028-251/2012), which covered the main paddy rice cultivation region. For 116/027-264/2011, a total number of 1,541 testing ROIs (24,656 pixels) was randomly generated within the subset region covered by the WorldView-2. As for 114/028-251/2012, 2,915 ROIs were randomly generated. 285 ROIs (167 for non-paddy rice and 118 for paddy rice) and 2,630 ROIs (2,068 for non-paddy rice and 567 for paddy rice) were visually interpreted and digitalized onscreen from the high resolution images on Google Earth and the Landsat FCC image of 114/028-155/2012 (R/G/B = SWIR/NIR/Red), respectively. We used the same-year flooding/transplanting rice map (114/028-176/2011) as the ground truth reference to evaluate the accuracy of the ripening rice map on 114/028-264/2011. The accuracy assessment was summarized by the error matrixes along with user accuracy, producer accuracy, overall accuracy, and KAPPA coefficient for the ripening rice maps (Congalton, 1991).
2.5 Implementation of algorithms
The field surveys were carried out in 2011, thus it was used as the baseline year. Images in 2010 and 2012 were used to fill the gaps caused by clouds, cloud shadows, or Landsat 7 ETM + SLC-off in the 2011 images. For each Landsat footprint, we assembled the flooding/transplanting and ripening paddy rice maps into one paddy rice map using the following rule: the 2011 flooding/transplanting map was the initial input. If the 2011 flooding/transplanting map wasn’t available or if it contained data gaps, the gaps were filled using the first available rice map in the order of: 1) the 2011 ripening rice map, 2) the 2010 flooding/transplanting map, 3) the 2010 ripening rice map, 4) the 2012 flooding/transplanting map, and 5) the 2012 ripening rice map. Finally, the paddy rice maps for 13 Landsat footprints were mosaicked into one preliminary paddy rice map for the Sanjiang Plain.
The final Landsat rice map was generated by excluding the natural wetland and unsuitable terrain regions for rice cultivation. The 30 m Landsat-based natural wetland dataset, provided by the Northeast Institute of Geography and Agricultural Ecology, Chinese Academy of Sciences, includes six natural wetland types: river, lake, flooding wetland, forested wetland, shrub wetland, and grassland wetland. The overall accuracy of natural wetland was above 90% (Xie, 2013). As paddy rice in the Sanjiang Plain is generally cultivated in the low-elevation region, a terrain mask was generated to exclude regions with an elevation > 150 m for the low-latitude region and > 500 m for the high-latitude region using the 30 m ASTER Global Digital Elevation Model (DEM) (http://earthexplorer.usgs.gov/).
2.6 Validation of the Landsat-based paddy rice map of the Sanjiang Plain
Extensive field surveys were carried out to collect the ground truth points (points of interest, referred as POIs) across the Sanjiang Plain in 2011. The geo-locations of POIs were recorded using a GPS device with a position precision of 3–5 m. There were 240 POIs for paddy rice and 993 POIs for the other land cover types collected (487 POIs for dry cropland, 32 POIs for grassland, 90 POIs for natural wetland, 264 POIs for forest, 89 POIs for built-up, 29 POIs for water, and 2 POIs for other land cover types) (Fig. 1(b)).
In this study, the resultant 30 m Landsat-based paddy rice map (RICELandsat) was evaluated using three approaches. The first approach used a point (POI) to one pixel comparison. We overlaid the 1,233 POIs on the RICELandsat and counted the number of pixels that were classified as paddy rice and other land cover types, respectively. Note that some POIs were collected along the edges of the fields or on the roads; these pixels were typically mixed with multiple land types. Thus, there could be classification errors for the POIs on the RICELandsat. To overcome the issue, the second approach was to generate four buffering windows (15 m × 15 m, 30 m × 30 m, 45 m × 45 m, and 60 m × 60 m) with the POI as the centers. 60 m was defined as the maximum buffering distance considering the farthest observation range during the field survey and the maximum distance among the rice field plots. We overlaid the buffering windows on the RICELandsat, and counted the numbers of POIs of both paddy and non-paddy rice that had been correctly identified from the RICELandsat under the two standards. In the first, a paddy rice POI was correctly identified as long as a RICELandsat paddy rice pixel occurred within the buffering window. In the second, a non-paddy rice POI was correctly identified once all the RICELandsat pixels within the buffering window were identified as non-paddy rice. The third approach was to digitalize ROIs with the POIs as references. For each POI, we generated a ROI with an average area of 120 m × 120 m from the high-resolution imagery of Google Earth (Fig. 1(b)) or Landsat FCC images (R/G/B = SWIR/NIR/Red) in late June as ground truth reference maps, on which paddy rice had either distinguishable spatial patterns or spectral features from other land types. 65 ROIs (1,052 pixels) of paddy rice and 227 ROIs (3,684 pixels) of other land cover types were collected from Google Earth from 2010–2012. 175 ROIs (2,730 pixels) of paddy rice and 766 ROIs (12,216 pixels) of other land cover types were interpreted from Landsat FCC images. The error matrix was calculated by over-laying ROIs on the RICELandsat.
2.7 Comparison with other paddy rice datasets
The National Land Cover Dataset (NLCD) is a 30 m vector database using a hierarchical classification scheme of 25 land-cover types. The NLCD was developed by visual interpretation and artificial digitalization from Landsat imagery (the primary base maps) at a scale of 1:100,000. Since the NLCD is only available to the public as areal fraction at 1 km resolution for each land type, we aggregated our RICELandsat to a 1 km grid and compared it with the 2010 NLCD paddy rice (RICENLCD).
In addition, we collected the agriculture census records of rice cultivation area for 17 counties from the agricultural statistical yearbooks of Shuangyashan City, Qitaihe City, Jixi City, and Jiamusi City in 2011 (RICECensus). We compared the county-level rice area between the RICELandsat and the RICECensus.
3 Results
3.1 Maps of the flooding/transplanting phase of paddy rice
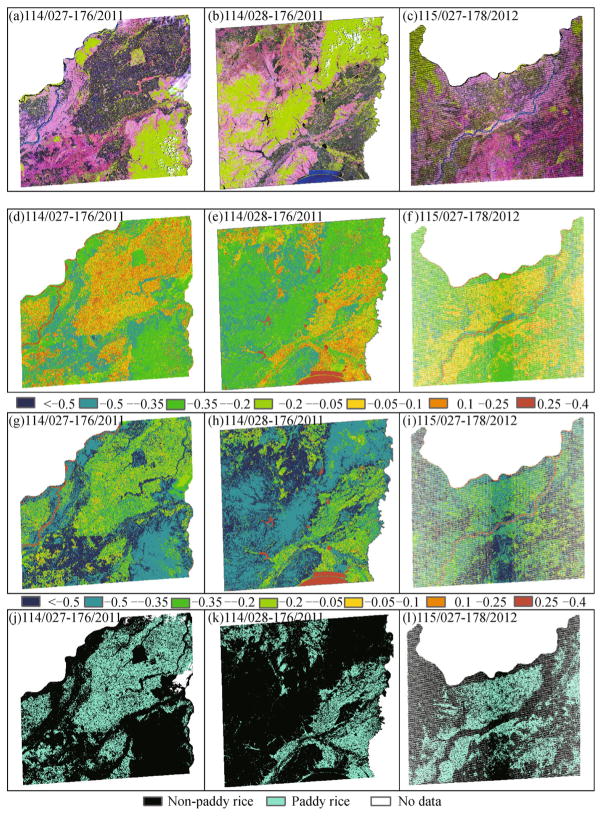
Paddy rice showed as dark green across the Landsat FCC images (R/G/B = SWIR/NIR/Red) after two weeks of seedling transplanting in late June of 2011 and 2012, and was easily identified from other land types (Figs. 6(a)–6 (c)). The LSWI-EVI maps highlighted the spatial distribution of the rice fields under the flooding/transplanting phase (Figs. 6(d)–6(f)). The pixels with LSWI-EVI > −0.05 primarily represented the spatial pattern of paddy rice. However, the LSWI-NDVI was not as sensitive as LSWI-EVI; LSWI-NDVI of paddy rice was close to that of non-paddy rice (Figs. 6(g)–6(i)). The spatial distribution of paddy rice on the resultant maps (Figs. 6(j)–6(l)) corresponded well with the spatial pattern of paddy rice on the Landsat FCC images (Figs. 6(a)–6(c)).
Fig. 6.
(a)–(c), Landsat FCC images (R/G/B = SWIR/NIR/Red); (d)–(f), LSWI-EVI maps; (g)–(i), LSWI-NDVI maps; (j)–(l), flooding/transplanting rice maps for 114/027-176/2011, 114/028-176/2011, and 115/027-178/2012.
3.2 Maps of the ripening phase of paddy rice
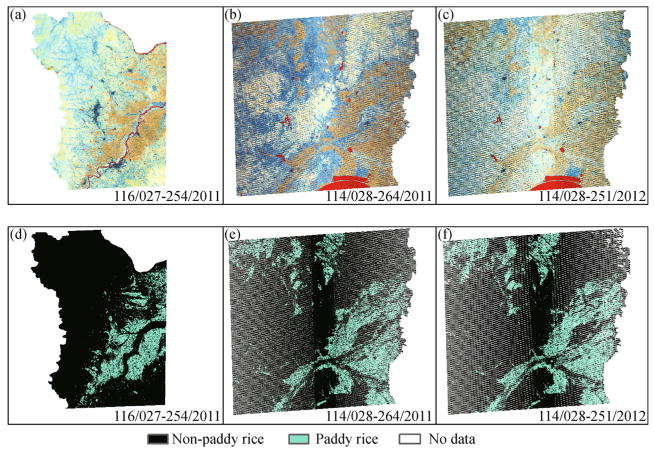
The paddy rice distribution on the resultant maps (Figs. 7(d)–7(f)) were spatially consistent with the pattern of paddy rice on the Landsat FCC images (Figs. 7(a)–7(c)) on which paddy rice showed as orange tone, and was distinguishable from other land types. The ripening rice maps for 116/028-254/2011 and 114/028-251/2012 had high classification accuracies. The overall accuracies and KAPPA coefficients were 95% and 92% for 116/028-254/2011, and 96% and 91% for 114/028-251/2012. The user and producer accuracies were mostly above 90% for paddy rice and 95% for non-paddy rice on both maps.
Fig. 7.
(a)–(c), Landsat FCC images (R/G/B = LSWI/NDVI/(NDVI + EVI)/2-LSWI); (d)–(f), ripening rice maps for 116/027-254/2011, 114/028-264/2011, and 114/028-251/2012.
The ripening rice map of 114/028-264/2011 had high spatial consistency with the flooding/transplanting rice map of 114/028-176/2011 with a correlation coefficient of 0.8. The differences between the two rice maps were subtle and mainly distributed along the boundaries of rice fields. The overall accuracy and KAPPA coefficient of the ripening rice map of 114/028-264/2011 was 94% and 84% with a user and producer accuracy of 89% and 87% for paddy rice, and 95% and 96% for non-paddy rice.
3.3 Paddy rice map of the Sanjiang Plain and accuracy assessment
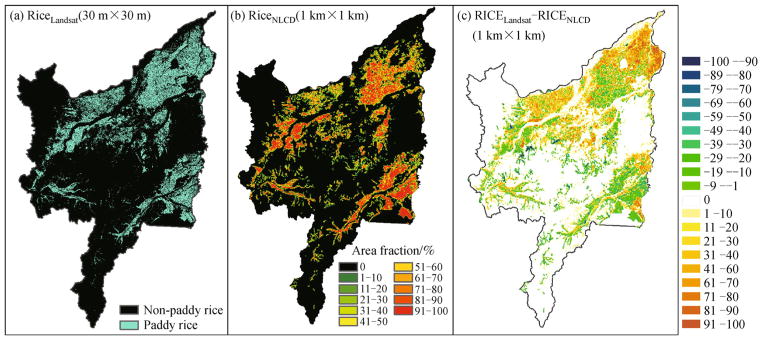
The paddy rice area was 20,294 km2 in 2011, accounting for 19% of the total area of the Sanjiang Plain. Rice fields were mainly distributed at the alluvial plain of Heilongjiang, Songhua, and Ussuri Rivers in the northern region, the plains of Muleng River and Khank Lake in the southeast region, and the Woken River plain in the southwest region (Fig. 8(a)).
Fig. 8.
(a) 30 m Landsat-based paddy rice map (RICELandsat); (b) 1 km area fraction of paddy rice on the 2010 NLCD (RICENLCD); (c) 1 km area fraction difference map between the RICELandsat and the RICENLCD.
The accuracy of the RICELandsat paddy rice increased from 61% for the POIs to 95% for the 60 m buffering distance (Fig. 9). The paddy rice accuracy increased by 11% as the buffering distance increased from 15–30 m and from 30–45 m. The accuracy for the RICELandsat non-paddy rice decreased from 97% for the POIs to 89% for the 60 m buffering distance.
Fig. 9.
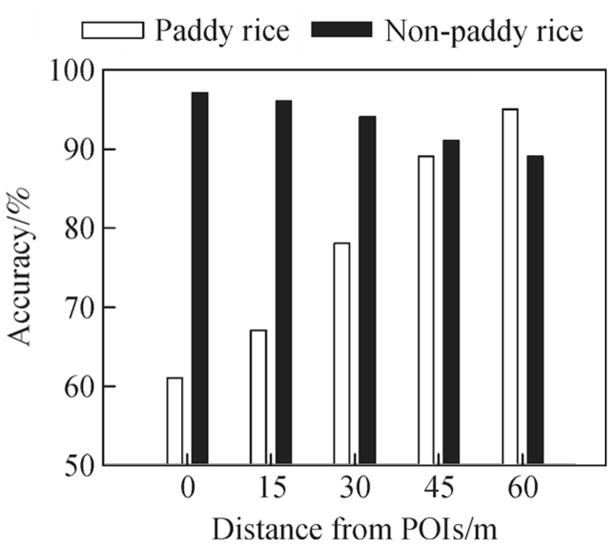
Classification accuracy based on POIs.
The RICELandsat had a reasonably high overall accuracy of 97% and a KAPPA coefficient of 90% according to the error matrix calculated with the ROIs (Table 3). The user and producer accuracies were 90% and 94% for paddy rice and 98% and 97% for non-paddy rice.
Table 3.
Accuracy assessment of the 30 m Landsat paddy rice map in the Sanjiang Plain, northeast China
| Paddy rice | Non-paddy rice | Total | Producer accuracy/% | ||
|---|---|---|---|---|---|
| Ground Truth Points | Paddy rice | 3535 | 247 | 3782 | 94 |
| Non-paddy rice | 399 | 15501 | 15900 | 97 | |
| Total | 3934 | 15748 | |||
| User accuracy/% | 90 | 98 |
3.4 A comparison of the Landsat paddy rice map with the other paddy rice area estimate datasets
In general, the spatial pattern on the RICELandsat was similar to that on the RICENLCD (Figs. 8(a) and 8(b)). However, there were still some significant differences between the RICELandsat and the RICENLCD. The total rice area from the RICELandsat was 31% higher than that derived from the RICENLCD (15,465 km2). The northern region showed a significant discrepancy between the RICELandsat and the RICENLCD (Fig. 8(c)).
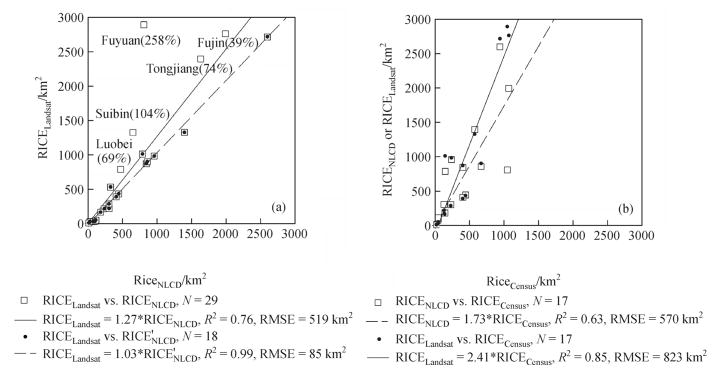
The RICELandsat had higher area estimates than the RICENLCD for Fujin (39%), Tongjiang (74%), Luobei (69%), Suibin (104%), and Fuyuan (258%) in the north region (Fig. 10(a)). For the other counties, the RICELandsat rice area matched well with the RICENLCD estimates (the solid regression line in Fig. 10(a)). The RICELandsat rice area correlated well with the estimates from the RICECensus with R2= 0.85 (the solid regression line in Fig. 10(b)). However, the RICELandsat rice area was about 128% higher than the RICECensus. The RICENLCD also estimated the rice area around 66% higher than the RICECensus with R2= 0.63 (the dot regression line in Fig. 10(b)). This result was consistent with the previous conclusions of underreporting cropland area by the agricultural census report (Qiu et al., 2003; Liu et al., 2005).
Fig. 10.
(a) County-level comparison of paddy rice area estimates between the RICELandsat and the RICENLCD; (b) county-level comparison of paddy rice area estimates between the RICELandsat and the RICECensus.
4 Discussion
The integration of the Landsat flooding/transplanting-based and ripening-based algorithms introduced in this paper contributes to the efforts to improve the resolution and accuracy of paddy rice maps at the regional scale. The Landsat flooding/transplanting-based algorithm follows the MODIS phenology-based algorithm by identifying the temporary inversion between LSWI and EVI (NDVI) during the field flooding and seedling transplanting stages. Using the simple decision rules and training samples on LSWI, NDVI, and (NDVI + EVI)/2-LSWI, the Landsat ripening-based algorithm has shown the spatial and temporal robustness to extract the high-accuracy ripening rice maps.
The minimum classification unit plays an important role in determining the precision of the RICELandsat and RICENLCD. The RICELandsat was generated by pixel-based classification, with a classification unit of 30 m × 30 m. The RICENLCD was generated by onscreen digitalization primarily from the 30 m Landsat at a scale of 1:100,000, with the minimum classification unit equivalent to 3×3 Landsat pixels. Thus, rice fields smaller than 3×3 Landsat pixels cannot be identified by the NLCD (Liu et al., 2005). In other words, the RICELandsat can show the spatial pattern of paddy rice in far more detail than the NLCD.
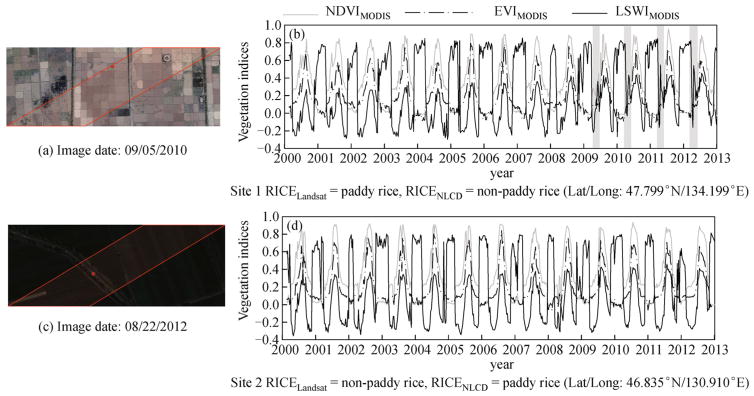
Two sites were selected to evaluate the discrepancies between the RICELandsat and RICENLCD. Site 1 represents the case of RICELandsat = paddy rice and RICENLCD = non-paddy rice. The high resolution image on 09/05/2010 shows that Site 1 was paddy rice in 2010 (Fig. 11(a)). The temporal profiles of MODIS vegetation indices during 2000–2012 show the presence of the flooding/transplanting phases (LSWIMODIS+ 0.05 > EVIMODIS (NDVIMO-DIS)) in May and June from 2009–2012 (highlighted in gray, Fig. 11(b)). This proves that Site 1 was paddy rice starting in 2009, which matches with the RICELandsat. Site 2 represents the case of RICELandsat = non-paddy rice and RICENLCD = paddy rice. The high resolution image on 08/22/2012 verifies that Site 2 was non-paddy rice in 2012 (Fig. 11(c)). The temporal profiles of MODIS vegetation indices don’t show the presence of the flooding/transplanting phases in May and June of 2000–2012 (Fig. 11(d)). This verifies that Site 2 was non-paddy rice from 2009–2012, which also matches with the RICELandsat. In summary, the RICELandsat for Sites 1 and 2 agrees with the interpretation analysis from the high-resolution image and temporal MODIS vegetation indices. It can be concluded that the significant differences between the RICENLCD and the RICELandsat are most likely caused by the visual interpretation uncertainties on the RICENLCD. Two main factors contribute to the uncertainties of the RICENLCD. First, image selection determines the interpretation accuracy of paddy rice. The NLCD is produced based on a single FCC image (R/G/B = NIR/Red/Green) (Liu et al., 2005), on which paddy rice might show a similar image tone (red color) with other vegetation types. Adding the SWIR can increase visual interpretation accuracy of paddy rice (Li et al., 2012). Our results suggest that incorporating phenological information using the multi-temporal Landsat FCC images (R/G/B = SWIR/NIR/Red) during the flooding/transplanting and ripening phases should be considered for the rice interpretation of the NLCD. Secondly, the interpreter’s expertise, including a good knowledge of the study area and image features (tone, texture, spatial pattern, etc.) of paddy rice, also plays an important role. However, the interpreter’s expertise is not objective and repeatable (Shalaby and Tateishi, 2007), and the interpretation error cannot be predictable even across a large region.
Fig. 11.
Evaluation of the discrepancy between the RICELandsat and the RICENLCD: (a) and (c), the high-resolution images on Google Earth; (b) and (d), seasonal dynamics of 500 m MODIS vegetation indices (NDVI, EVI, LSWI) during 2000–2012.
Several factors contribute to uncertainties in the flood/transplanting and ripening-based algorithms using multi-temporal Landsat images to identify paddy rice on a large spatial scale, such as Southeast Asia — the global main rice cultivation region. Southeast Asia has variable landscapes, topography, and climate along with complex rice-growing ecosystems and multiple cropping intensities (Xiao et al., 2006; Kuenzer and Knauer, 2013). The first factor is the similarity of the flooding/transplanting characteristics from other land types, including mangrove forests and the seasonally inundated natural wetlands, which can be misclassified as paddy rice. The second factor is the intensive collection of training ROIs to implement the ripening-based algorithm. The third factor is the arbitrary thresholds for generating the terrain mask as rice cultivation terrain, which is variable across regions. Finally, Southeast Asia generally has a tropical monsoon climate with only a short dry season from November to March. Frequent rainfall during the long wet season significantly limits the availability of good-quality Landsat data. The inclusion of other fine-resolution satellite data will increase observation frequency and may help map rice distribution in monsoon Asia in the future.
5 Conclusions
Information on the spatial extent of paddy rice planting area is important for studies of rice growth and yield prediction, water resource management, and methane emission assessment. However, spatial datasets of paddy rice at a fine resolution with reliable accuracy are still not available at the regional scale. This study demonstrated the potentials of multi-temporal Landsat imagery in regional-scale rice classification by integrating the phenological and spectral features of paddy rice in the flooding/transplanting and ripening phases. The multi-temporal Landsat vegetation indices were sensitive to tracking the seasonal dynamics of the vegetation-to-water ratio of the rice fields during the flooding and seedling transplanting phases. The unique spectral features of the ripening paddy rice were spatially and temporally robust and can be used to identify paddy rice from other land cover types. However, future studies should investigate several factors such as non-cropland inundated land types, terrain conditions, and image availability when applying the methodology in this study to rice field identification in other regions, particularly in Southeast Asia with its complex rice cultivation ecosystems.
Acknowledgments
This study was supported by the NASA Land Use and Land Cover Change Program (NNX09AC39G, NNX11AJ35G), the US National Science Foundation EPSCoR program (NSF-0919466), and the National Institutes of Health (1R01AI101028-01A1). The WorldView-2 high-resolution images were provided by NASA under the terms of the National Geospatial-Intelligence Agency’s (NGA) Nextview License Agreement. We thank the reviewers for their insightful comments on earlier versions of the manuscript. We would also like to thank Drs. Kaishan Song, Jia Du, and Zhenghong Miao for providing the GPS data, field photos and agricultural census statistic data, and Sarah Xiao for the English and grammar corrections.
References
- Belder P, Bouman BAM, Cabangon R, Lu G, Quilang EJP, Li YH, Spiertz JHJ, Tuong TP. Effect of water-saving irrigation on rice yield and water use in typical lowland conditions in Asia. Agric Water Manage. 2004;65(3):193–210. [Google Scholar]
- Biradar CM, Xiao XM. Quantifying the area and spatial distribution of double- and triple-cropping croplands in India with multi-temporal MODIS imagery in 2005. Int J Remote Sens. 2011;32(2):367–386. [Google Scholar]
- Cohen WB, Yang ZG, Kennedy R. Detecting trends in forest disturbance and recovery using yearly Landsat time series: 2. TimeSync- Tools for calibration and validation. Remote Sens Environ. 2010;114(12):2911–2924. [Google Scholar]
- Congalton RG. A review of asessing the accuracy of classifications of remotely sensed data. Remote Sens Environ. 1991;37(1):35–46. [Google Scholar]
- Döll P. Impact of climate change and variability on irrigation requirements: a global perspective. Clim Change. 2002;54(3):269–293. [Google Scholar]
- Dong JW, Xiao XM, Chen BQ, Torbick N, Jin C, Zhang GL, Biradar C. Mapping deciduous rubber plantations through integration of PALSAR and multi-temporal Landsat imagery. Remote Sens Environ. 2013;134:392–402. [Google Scholar]
- Hansen MC, Potapov PV, Moore R, Hancher M, Turubanova SA, Tyukavina A, Thau D, Stehman SV, Goetz SJ, Loveland TR, Kommareddy A, Egorov A, Chini L, Justice CO, Townshend JRG. High-resolution global maps of 21st-century forest cover change. Science. 2013;342(6160):850–853. doi: 10.1126/science.1244693. [DOI] [PubMed] [Google Scholar]
- Huang CQ, Coward SN, Masek JG, Thomas N, Zhu ZL, Vogelmann JE. An automated approach for reconstructing recent forest disturbance history using dense Landsat time series stacks. Remote Sens Environ. 2010a;114(1):183–198. [Google Scholar]
- Huang N, Wang ZM, Liu DW, Niu Z. Selecting sites for converting farmlands to wetlands in the Sanjiang Plain, Northeast China, based on remote sensing and GIS. Environ Manage. 2010b;46(5):790–800. doi: 10.1007/s00267-010-9547-6. [DOI] [PubMed] [Google Scholar]
- Huete A, Didan K, Miura T, Rodriguez EP, Gao X, Ferreira LG. Overview of the radiometric and biophysical performance of the MODIS vegetation indices. Remote Sens Environ. 2002;83(1–2):195–213. [Google Scholar]
- Huete AR, Liu HQ, Batchily K, vanLeeuwen W. A comparison of vegetation indices global set of TM images for EOS-MODIS. Remote Sens Environ. 1997;59(3):440–451. [Google Scholar]
- Kennedy RE, Yang ZG, Cohen WB. Detecting trends in forest disturbance and recovery using yearly Landsat time series: 1. LandTrendr — Temporal segmentation algorithms. Remote Sens Environ. 2010;114(12):2897–2910. [Google Scholar]
- Kuenzer C, Knauer K. Remote sensing of rice crop areas. Int J Remote Sens. 2013;34(6):2101–2139. [Google Scholar]
- Laba M, Smith SD, Degloria SD. Landsat-based land cover mapping in the lower Yuna River watershed in the Dominican Republic. Int J Remote Sens. 1997;18(14):3011–3025. [Google Scholar]
- Li CS, Mosier A, Wassmann R, Cai ZC, Zheng XH, Huang Y, Tsuruta H, Boonjawat J, Lantin R. Modeling greenhouse gas emissions from rice-based production systems: sensitivity and upscaling. Global Biogeochem Cycles. 2004;18(1):GB1043. [Google Scholar]
- Li P, Feng ZM, Jiang LG, Liu YJ, Xiao XM. Changes in rice cropping systems in the Poyang Lake Region, China during 2004–2010. J Geogr Sci. 2012;22(4):653–668. [Google Scholar]
- Liu J, Liu M, Tian H, Zhuang D, Zhang Z, Zhang W, Tang X, Deng X. Spatial and temporal patterns of China’s cropland during 1990–2000: an analysis based on Landsat TM data. Remote Sens Environ. 2005;98(4):442–456. [Google Scholar]
- Masek JG, Huang CQ, Wolfe R, Cohen W, Hall F, Kutler J, Nelson P. North American forest disturbance mapped from a decadal Landsat record. Remote Sens Environ. 2008;112(6):2914–2926. [Google Scholar]
- McCloy KR, Smith FR, Robinson MR. Monitoring rice areas using LANDSAT MSS data. Int J Remote Sens. 1987;8(5):741–749. [Google Scholar]
- Müller H, Rufin P, Griffiths P, Barros Siqueira AJ, Hostert P. Mining dense Landsat time series for separating cropland and pasture in a heterogeneous Brazilian savanna landscape. Remote Sens Environ. 2015;156:490–499. [Google Scholar]
- Okamoto K, Fukuhara M. Estimation of paddy field area using the area ratio of categories in each mixel of Landsat TM. Int J Remote Sens. 1996;17(9):1735–1749. [Google Scholar]
- Okamoto K, Yamakawa S, Kawashima H. Estimation of flood damage to rice production in North Korea in 1995. Int J Remote Sens. 1998;19(2):365–371. [Google Scholar]
- Panigrahy S, Parihar JS. Role of middle infrared bands of Landsat Thematic Mapper in determining the classification accuracy of rice. Int J Remote Sens. 1992;13(15):2943–2949. [Google Scholar]
- Qiu J, Tang H, Frolking S, Boles S, Li C, Xiao X, Liu J, Zhuang Y, Qin X. Mapping single-, double-, and triple-crop agriculture in China at 0.5°×0.5° by combining county-scale census data with a remote sensing-derived land cover map. Geocarto Int. 2003;18(2):3–13. [Google Scholar]
- Rao PPN, Rao VR. Rice crop identification and area estimation using remotely-sensed data from Indian cropping patterns. Int J Remote Sens. 1987;8(4):639–650. [Google Scholar]
- Richards JA, editor. Remote Sensing Digital Image Analysis. Berlin: Springer-Verlag; 1999. [Google Scholar]
- Sakamoto T, van Cao P, van Nguyen N, Kotera A, Yokozawa M. Agro-ecological interpretation of rice cropping systems in flood-prone areas using MODIS imagery. Photogramm Eng Remote Sensing. 2009a;75(4):413–424. [Google Scholar]
- Sakamoto T, Van Nguyen N, Ohno H, Ishitsuka N, Yokozawa M. Spatio–temporal distribution of rice phenology and cropping systems in the Mekong Delta with special reference to the seasonal water flow of the Mekong and Bassac rivers. Remote Sens Environ. 2006;100(1):1–16. [Google Scholar]
- Sakamoto T, Van Phung C, Kotera A, Van Nguyen KD, Yokozawa M. Analysis of rapid expansion of inland aquaculture and triple rice-cropping areas in a coastal area of the Vietnamese Mekong Delta using MODIS time-series imagery. Landsc Urban Plan. 2009b;92(1):34–46. [Google Scholar]
- Shalaby A, Tateishi R. Remote sensing and GIS for mapping and monitoring land cover and land-use changes in the Northwestern coastal zone of Egypt. Appl Geogr. 2007;27(1):28–41. [Google Scholar]
- Sun H, Huang J, Huete AR, Peng D, Zhang F. Mapping paddy rice with multi-date moderate-resolution imaging spectroradiometer (MODIS) data in China. Journal of Zhejiang University SCIENCE A. 2009;10:1509–1522. [Google Scholar]
- Tucker CJ. Red and photographic infrared linear combinations for monitoring vegetation. Remote Sens Environ. 1979;8(2):127–150. [Google Scholar]
- Turner MD, Congalton RG. Classification of multi-temporal SPOT-XS satellite data for mapping rice fields on a West African floodplain. Int J Remote Sens. 1998;19(1):21–41. [Google Scholar]
- Van Nguyen N, Ferrero A. Meeting the challenges of global rice production. Paddy and Water Environment. 2006;4(1):1–9. [Google Scholar]
- Vermote EF, ElSaleous N, Justice CO, Kaufman YJ, Privette JL, Remer L, Roger JC, Tanre D. Atmospheric correction of visible to middle-infrared EOS-MODIS data over land surfaces: background, operational algorithm and validation. J Geophys Res, D, Atmospheres. 1997;102(D14):17131–17141. [Google Scholar]
- Xiao XM, Boles S, Frolking S, Li CS, Babu JY, Salas W, Moore B., III Mapping paddy rice agriculture in South and Southeast Asia using multi-temporal MODIS images. Remote Sens Environ. 2006;100(1):95–113. [Google Scholar]
- Xiao XM, Boles S, Liu JY, Zhuang DF, Frolking S, Li CS, Salas W, Moore B., III Mapping paddy rice agriculture in southern China using multi-temporal MODIS images. Remote Sens Environ. 2005;95(4):480–492. [Google Scholar]
- Xiao XM, Zhang QY, Braswell B, Urbanski S, Boles S, Wofsy S, Berrien M, Ojima D. Modeling gross primary production of temperate deciduous broadleaf forest using satellite images and climate data. Remote Sens Environ. 2004;91(2):256–270. [Google Scholar]
- Xie J. Dissertation for Master degree. 2013. Classification of wetlands using object-oriented method and multi-season remote sensing images in Sanjiang Plain. Available from China knowledge Resource Integrated Database (in Chinese) [Google Scholar]
- Zhang Y, Wang YY, Su SL, Li CS. Quantifying methane emissions from rice paddies in Northeast China by integrating remote sensing mapping with a biogeochemical model. Biogeosciences. 2011;8(5):1225–1235. [Google Scholar]
- Zhong L, Gong P, Biging GS. Efficient corn and soybean mapping with temporal extendability: a multi-year experiment using Landsat imagery. Remote Sens Environ. 2014;140:1–13. [Google Scholar]
- Zhu Z, Woodcock CE. Object-based cloud and cloud shadow detection in Landsat imagery. Remote Sens Environ. 2012;118:83–94. [Google Scholar]
- Zhu Z, Woodcock CE, Olofsson P. Continuous monitoring of forest disturbance using all available Landsat imagery. Remote Sens Environ. 2012;122:75–91. [Google Scholar]


