

Abstract
Current evidence of an association between body size and prostate cancer is conflicting, possibly due to differential effects of body size across the lifespan and the heterogeneity of the disease. We therefore examined childhood and adult body size in relation to total incident prostate cancer and prognostic subtypes in a prospective cohort of 47,491 US men in the Health Professionals Follow-up Study. We assessed adult height, body mass index (BMI) in early and middle-to-late adulthood, adult waist circumference, and body shape at age 10. With follow-up from 1986 to 2010, we estimated the relative risk (RR) of prostate cancer using Cox proportional hazards models. We identified 6183 incident cases. Tallness was associated with increased risk of advanced-stage tumors, particularly fatal disease (RR=1.66, 95% CI 1.23–2.23, highest versus lowest quintile, Ptrend<0.001). High BMI at age 21 was inversely associated with total prostate cancer (RR=0.89, 95% CI 0.80–0.98, BMI ≥26 versus 20–21.9, Ptrend=0.01) and with fatal and advanced disease. The association for late adult BMI differed by age (Pinteraction<0.001); high BMI was inversely associated with total prostate cancer (RR=0.64, 95% CI 0.51–0.78, BMI ≥30 versus 21–22.9, Ptrend<0.001) and with non-advanced and less aggressive tumors among men ≤65 years, whereas no association was seen among men >65 years. Adult waist circumference was weakly inversely associated with less aggressive disease. Childhood obesity was unclearly related to risk. Our study confirms tall men to be at increased risk of fatal and advanced prostate cancer. The influence of adiposity varies by prognostic disease subtype and by age.
Keywords: prostatic neoplasms, height, body mass index, childhood body size, waist circumference, epidemiology
Introduction
Body size is related to various hormonal and metabolic pathways and may therefore influence the risk of developing prostate cancer, a largely hormone-dependent cancer. However, current evidence of an association is conflicting. Prostate cancer is a heterogeneous disease and the etiology seems to differ between prognostic tumor subtypes and between different groups of men (e.g. younger versus older). The timing of body size throughout life may have unique influences on disease pathogenesis. In light of the obesity epidemic in the Western world, it is crucial to clarify the etiological role of body size in prostate cancer development for future cancer preventive strategies.
Tall adult height has been associated with increased risk of prostate cancer [1–5]. High body mass index (BMI) in middle-to-late adulthood has been suggested to increase the risk of advanced and fatal prostate cancer, but reduce the risk of localized disease [3,6,7]. Body size early in life is potentially independently important since early changes in prostate tissue have been seen already in men in their twenties [8]. For body size in early adulthood (≤30 years) the findings are inconsistent [2,9–12]. Obesity in childhood has been inversely associated with risk of total, advanced, or aggressive prostate cancer [11,13,14], whereas other studies have shown no association [15,16].
The present study is an updated investigation of childhood and adult body size and prostate cancer incidence and progression in the Health Professionals Follow-up Study [14]. This is one of the largest observational studies on men, with over 6000 prostate cancer cases and prospectively updated information on lifestyle and health since 1986 as well as early-life anthropometric data. The prior analysis showed strong positive associations between adult height and advanced/metastatic prostate cancer, and inverse associations between obesity at age 5, 10, and 20 and advanced/metastatic disease. In the current study with 16 additional years of follow-up we examined adult height, BMI at age 21, cumulative average BMI since baseline, adult waist circumference, and body shape at age 10 in relation to total incident prostate cancer and different tumor subtypes. We further investigated the effect estimates of all anthropometric measures stratified by age at diagnosis and family history of the disease, as these factors have previously been shown to modify the associations between BMI, waist circumference and prostate cancer [10,17].
Methods
Study population
The Health Professionals Follow-up Study is a prospective cohort of 51,529 US male health professionals [18]. The participants, aged 40–75 years at enrolment in 1986, completed a baseline questionnaire on medical and lifestyle factors and have been followed through self-administered questionnaires every two years for updated information, with an average response rate >94%. The study and use of the data are continually approved by the Institutional Review Board of the Harvard School of Public Health.
We excluded erroneous reports (n=39) and men who left ≥70 items blank in the 1986 dietary questionnaire or who reported unreasonably high (>17,600 kJ) or low (<3350 kJ) energy intakes (n=1596). We further excluded men with cancer, except non-melanoma skin cancer, at baseline (n=2009) and men with missing values for height (n=32) or weight in both 1986 and 1988 (n=362). Among the 47,491 men who remained for analyses after exclusions, the number of men with complete data on BMI at age 21 was 45,695, on waist circumference 31,069, and on childhood body shape 34,983.
Anthropometric measures
Height, current weight, and weight at age 21 were self-reported on the 1986 baseline questionnaire. Current weight has been updated every two years. We calculated BMI (kg/m2) at age 21, at baseline, and the cumulative average at each follow-up. Cumulative average BMI was the average of BMI values for each questionnaire up to that follow-up cycle; for example, the average of 1986, 1988, and 1990 BMI was used as the cumulative average BMI for the 1990 cycle. If data on weight was missing at one follow-up, then data from the previous questionnaire cycle was used. Information on waist circumference was obtained through an additional questionnaire in 1987 where participants were asked to measure their waist with a provided tape measure and detailed instructions, and this measurement was repeated in 1996. Self-reported weight and waist circumference have been strongly correlated with objectively measured values in a sample of the cohort (r=0.97 and 0.95, respectively) [19].
Body shape at different ages was assessed in the 1988 questionnaire through a pictogram with drawings of silhouettes of nine different sizes, ranging from very thin to obese (Fig. 1) [20]. Participants were asked to select the silhouette that best represented their body shape at age 5, 10, 20, 30, 40, and current age, respectively. We focused on body shape at age 10 because the previous investigation showed this variable to be most strongly associated with prostate cancer [14]. A validation study in elderly individuals showed high correlation (r=0.66) between recalled body shape at age 10 assessed by the pictogram and weight measured in childhood [21].
Fig. 1.
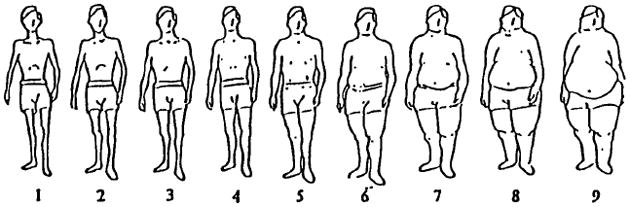
Silhouette drawings of body shape in the Health Professionals Follow-up Study, 1988 questionnaire: “Which diagram best depicts your outline at each age (5, 10, 20, 30, 40, current)”. Reproduced from Stunkard et al. [20] with permission from Wolters Kluwer/Lippincott Williams & Wilkins.
Outcome measures
Prostate cancer diagnoses were identified through self-reports and confirmed by medical records and pathology reports. Next-of-kin was contacted if the participant had died. Greater than 90% of the prostate cancer cases were confirmed by medical records; the remaining were included in total prostate cancer analyses since the accuracy among those with available records is >98%. Information on tumor pathology and prostate-specific antigen (PSA) values were obtained through medical records and pathology reports at diagnosis. Starting in 2000, men with a prostate cancer diagnosis were followed with biennial questionnaires on disease progression and metastases. Death reports were retrieved from family members or the National Death Index, ascertaining approximately 98% of all deaths in the cohort. Prostate cancer was determined as cause of death based on all available information from medical records, registry, and death certificates.
We investigated incidence of total prostate cancer as well as risk stratified by grade and stage of disease. Lethal cases were those who died of prostate cancer or had distant metastases at diagnosis or during follow-up. We also analyzed fatal disease (i.e., death from prostate cancer) separately, because body size could plausibly affect the risk of dying from prostate cancer independently of affecting the risk of metastases. Advanced cases included tumors that had spread outside the prostate at diagnosis (stage T3b/T4, N1, or M1) or lethal tumors. Non-advanced tumors included those confined within the prostate and with no metastases at diagnosis (stage T1/T2, N0, and M0), and did not cause any metastases or prostate cancer-specific death during follow-up. We did not include T1a tumors (n=254) in our case definition as these are relatively benign and prone to detection bias; these patients were censored at date of diagnosis. We defined high-grade (aggressive) prostate cancer as Gleason score 8–10 and low-grade (non-aggressive) tumors as Gleason score 2–6, and examined Gleason score-7 cases separately.
Statistical analysis
Participants were followed until January 31, 2010. Person-time was calculated from the month of return of the 1986 questionnaire until the month of prostate cancer diagnosis, month of death from any cause, or end of follow-up. For analyses of childhood body shape, follow-up time started at return of the 1988 questionnaire when the data were collected. For cumulative average BMI and waist circumference, we excluded the first two years of follow-up to avoid the risk of reverse causality due to disease-related weight loss.
All categorizations of variables were done a priori (see tables); different categorizations were used for BMI at age 21 and later adult BMI because the distribution of BMI was different for early and later adulthood. To test for linear trends across categories we modeled the exposures as continuous variables, using the median value in each category of height, BMI, and waist circumference. We also modeled the continuous exposures as a 2-inch increment in height, a 5 kg/m2 increment in BMI, and a 1-inch increment in waist circumference, respectively. The correlation between exposures was estimated by Spearman correlation coefficients.
We used Cox proportional hazards regression with age as the time scale to estimate the relative risk (RR) of prostate cancer as hazard ratios with 95 % confidence intervals (CI). All models were stratified by calendar time. Multivariable models were additionally adjusted for a priori selected covariates gleaned from the baseline or follow-up questionnaires: ethnicity, vigorous activity, energy intake, smoking, diabetes, family history of prostate cancer (father or brother), PSA test (assessed from 1994 onwards), and PSA testing intensity (PSA test in < or ≥ 50% of periods); both PSA variables were lagged one period to avoid counting diagnostic tests as screening. We also considered multivitamin use and intake of alcohol, calcium, coffee, red/processed meat, and tomato sauce as potential confounders, but they were not included in the final models as they did not influence the results. The questions on diet and physical activity have been validated in sub-samples of the cohort [22,23], and self-reported diabetes has been validated in a population of female health professionals [24]. Additionally, we mutually adjusted for the anthropometric measures in some models. Information on weight, activity, diet, smoking, diabetes, and PSA testing were used as time-varying variables and were updated at each questionnaire cycle. Information on family history of prostate cancer was updated several times throughout follow-up.
We tested the proportional hazards assumption (proportionality across both time and age) using likelihood ratio tests. We further investigated the effects of all anthropometric measures stratified by age and family history of prostate cancer. To explore whether the results were heavily affected by PSA screening, we performed additional analyses restricted to the cohort of highly screened men having had a PSA test in 1994 or 1996, with follow-up from 1996 to 2010, and with continued adjustment for PSA testing over time in the models.
All P values are two-sided, with P<0.05 considered as statistically significant. We used SAS version 9.3 (SAS Institute Inc., Cary, NC) for all analyses.
Results
Total follow-up time was 24 years, with an accumulated 938,614 person-years; with baseline in 1988 there were 22 years of follow-up and 852,890 accumulated person-years. We identified 6183 prostate cancer cases, of whom 618 were fatal, 785 lethal, 1016 advanced, 3990 non-advanced, 707 high-grade (Gleason 8–10), 1776 Gleason 7, and 2476 low-grade (Gleason 2–6) cases.
Age-standardized characteristics did not vary appreciably by anthropometric variables, except that vigorous physical activity was much lower in men with high cumulative average BMI or high waist circumference (table 1). Height was uncorrelated with the other anthropometric measures (rs in the range −0.03 to −0.001) with the exception of waist circumference (rs=0.22). The two BMI measures (at age 21 and adult cumulative average) were moderately correlated (rs=0.47). Waist circumference correlated weakly with height (rs=0.22), young adult BMI (rs=0.27) and strongly with cumulative average BMI (rs=0.70). Childhood body shape was weakly correlated with adult body size (rs=0.38, 0.18, and 0.09, respectively for BMI at age 21, cumulative average BMI, and waist circumference).
Table 1.
Age-standardized characteristics of participants in the Health Professionals Follow-up Study at baseline in 1986, by top and reference categories of anthropometric measures
| Height, inches (quintiles) | BMI at age 21, kg/m2 | Cumulative average BMI, kg/m2 | Waist circumference, inches (quintiles) | Body shape at age 10 | ||||||
|---|---|---|---|---|---|---|---|---|---|---|
|
| ||||||||||
| <68 (ref) | ≥73 | 20–21.9 (ref) | ≥26 | 21–22.9 (ref) | ≥30 kg/m2 | <34.5 (ref) | >40 | Silhouette 2 (ref) | Silhouette 6–9 | |
| No. of participants | 7423 | 8150 | 10987 | 5404 | 6849 | 3933 | 6231 | 5984 | 11175 | 2994 |
| Age, years | 56.9 | 52.1 | 55.3 | 52.9 | 53.8 | 54.4 | 51.8 | 56.7 | 55.0 | 51.1 |
| BMI at age 21, kg/m2 | 23.4 | 23.0 | 21.1 | 28.5 | 21.2 | 26.9 | 21.8 | 24.6 | 22.4 | 25.3 |
| BMI in 1986, kg/m2 | 25.9 | 25.5 | 24.1 | 29.4 | 22.1 | 33.0 | 22.6 | 29.0 | 25.0 | 26.5 |
| Waist circumference, inches | 36.1 | 38.8 | 36.4 | 40.5 | 34.4 | 44.1 | 33.0 | 43.0 | 37.1 | 38.6 |
| Height, inches | 66.0 | 74.0 | 70.1 | 69.9 | 70.1 | 69.6 | 69.0 | 71.0 | 70.3 | 70.2 |
| Body shape at age 10a | ||||||||||
| Silhouette ≥6, % | 8 | 9 | 3 | 25 | 6 | 17 | 6 | 13 | - | - |
| Caucasian, % | 90 | 97 | 95 | 97 | 95 | 96 | 94 | 98 | 96 | 97 |
| Had PSA test in 1994, % | 38 | 37 | 38 | 36 | 39 | 34 | 38 | 43 | 42 | 40 |
| Family history of prostate cancer, % | 11 | 12 | 12 | 12 | 12 | 11 | 13 | 13 | 13 | 12 |
| Diabetes, % | 4 | 3 | 3 | 5 | 3 | 6 | 2 | 4 | 3 | 4 |
| Never smoker, % | 48 | 45 | 47 | 44 | 52 | 42 | 53 | 41 | 49 | 40 |
| Current smoker, % | 9 | 10 | 10 | 11 | 10 | 10 | 9 | 10 | 9 | 11 |
| Multivitamin user, % | 42 | 42 | 42 | 40 | 47 | 36 | 47 | 39 | 42 | 43 |
| Vigorous activity, MET-h/wk | 12.6 | 12.8 | 12.0 | 12.5 | 17.5 | 6.6 | 19.3 | 6.8 | 12.2 | 14.5 |
| Mean intake | ||||||||||
| Total energy, kcal/d | 1911 | 2065 | 2012 | 1960 | 2000 | 2016 | 1999 | 2033 | 2011 | 1944 |
| Alcohol, g/d | 9.8 | 12.2 | 11.5 | 10.0 | 10.8 | 10.2 | 10.7 | 11.8 | 11.5 | 11.6 |
| Calcium, mg/d | 872 | 923 | 885 | 914 | 917 | 894 | 936 | 899 | 898 | 903 |
| Coffee, servings/d | 1.8 | 1.9 | 1.8 | 2.0 | 1.7 | 2.0 | 1.6 | 2.0 | 1.7 | 2.3 |
| Red/processed meat, servings/d | 0.9 | 1.0 | 1.0 | 1.0 | 0.9 | 1.2 | 0.8 | 1.1 | 1.0 | 0.9 |
| Tomato sauce, servings/d | 0.1 | 0.1 | 0.1 | 0.1 | 0.1 | 0.1 | 0.1 | 0.1 | 0.1 | 0.1 |
BMI, body mass index; PSA, prostate-specific antigen; MET, metabolic equivalents.
Values are means or percentages, standardized to the age distribution of the study population (except age).
Based on pictogram in Fig. 1.
The results were overall similar between age- and multivariable-adjusted models, therefore only the latter are shown in tables.
Tallness was positively related to fatal, lethal, advanced, and Gleason 7 prostate cancer (Table 2). The association was strongest for fatal disease; the risk of dying from prostate cancer increased by 15% (95% CI 1.08–1.22) with every 2 inch increment in height, and by 66% (95% CI 1.23–2.23) comparing the highest quintile to the lowest (Ptrend<0.001). We also observed an inverse association with low-grade disease, whereas there was no association for high-grade disease. The associations were not affected by adjusting for childhood or adult body size (data not shown).
Table 2.
Relative risk of prostate cancer (PC) in relation to adult height in the Health Professionals Follow-up Study (1986–2010)
| Height (inches) | ||||||||
|---|---|---|---|---|---|---|---|---|
|
| ||||||||
| <68 | 68–69 | 70 | 71–72 | ≥73 | Ptrend | Continuous per 2 inches | ||
| Total PC | Cases | 1001 | 1448 | 1100 | 1627 | 1007 | ||
| MV-adj RRa | 1.00 | 1.00 (0.91–1.08) | 1.04 (0.95–1.13) | 1.00 (0.92–1.08) | 1.03 (0.94–1.13) | 0.69 | 1.01 (0.99–1.03) | |
|
| ||||||||
| Fatal PC | Cases | 96 | 142 | 106 | 169 | 105 | ||
| MV-adj RRa | 1.00 | 1.11 (0.85–1.46) | 1.26 (0.94–1.68) | 1.42 (1.09–1.86) | 1.66 (1.23–2.23) | <0.001 | 1.15 (1.08–1.22) | |
|
| ||||||||
| Lethal PCb | Cases | 132 | 186 | 135 | 214 | 118 | ||
| MV-adj RRa | 1.00 | 1.07 (0.85–1.35) | 1.15 (0.89–1.48) | 1.28 (1.02–1.61) | 1.28 (0.98–1.67) | 0.02 | 1.08 (1.02–1.14) | |
|
| ||||||||
| Advanced PCb | Cases | 162 | 246 | 172 | 279 | 157 | ||
| MV-adj RRa | 1.00 | 1.15 (0.93–1.42) | 1.16 (0.93–1.45) | 1.30 (1.06–1.60) | 1.29 (1.02–1.64) | 0.008 | 1.08 (1.02–1.13) | |
|
| ||||||||
| Non-advanced PCb | Cases | 625 | 939 | 735 | 1046 | 645 | ||
| MV-adj RRa | 1.00 | 1.00 (0.90–1.11) | 1.04 (0.93–1.16) | 0.96 (0.86–1.07) | 0.96 (0.86–1.08) | 0.32 | 0.99 (0.97–1.02) | |
|
| ||||||||
| Gleason 8–10 PC | Cases | 115 | 167 | 130 | 183 | 112 | ||
| MV-adj RRa | 1.00 | 1.03 (0.81–1.33) | 1.13 (0.87–1.48) | 1.01 (0.79–1.29) | 1.07 (0.81–1.42) | 0.78 | 1.02 (0.96–1.08) | |
|
| ||||||||
| Gleason 7 PC | Cases | 250 | 413 | 293 | 486 | 334 | ||
| MV-adj RRa | 1.00 | 1.13 (0.96–1.32) | 1.06 (0.89–1.27) | 1.13 (0.97–1.33) | 1.24 (1.04–1.47) | 0.02 | 1.05 (1.01–1.09) | |
|
| ||||||||
| Gleason 2–6 PC | Cases | 404 | 603 | 474 | 632 | 363 | ||
| MV-adj RRa | 1.00 | 0.97 (0.85–1.10) | 1.03 (0.89–1.18) | 0.88 (0.78–1.01) | 0.83 (0.72–0.97) | 0.004 | 0.96 (0.93–0.99) | |
Relative risks (RR) are hazard ratios with 95 % confidence intervals derived from Cox proportional hazards regression models. All models are multivariable (MV)-adjusted for age in months, calendar time, ethnicity (White, African-American, Asian-American, other), vigorous activity (0 MET-h/w; 0.1–3.4; 3.5–10.4; 10.5–28.4; ≥28.5), energy intake (continuous), smoking (never smoker; past smoker, quit >10 yrs ago; past smoker, quit ≤10 yrs ago; current smoker), diabetes (yes/no), family history of prostate cancer (father or brother, yes/no), prostate-specific antigen (PSA) test (yes/no, collected from 1994 onwards; lagged one period to avoid counting diagnostic tests as screening), and PSA intensity (PSA test in < or > 50% of periods, lagged one period). P values are derived from χ2 test for trend across exposure categories (α=0.05). Age-adjusted models showed little differences.
Lethal prostate cancer: Death due to prostate cancer or distant metastases at diagnosis or during follow-up. Advanced: T3b/T4 or N1 or M1 at diagnosis, lethal, or any metastases during follow-up. Non-advanced: T1/T2 and N0 and M0 at diagnosis, no metastases or death due to prostate cancer during follow-up.
Higher BMI at age 21 was associated with significantly lower risk of lethal, advanced, and Gleason-7 prostate cancer, with multivariable-adjusted RRs in the range 0.69–0.77 comparing BMI ≥26 to BMI 20–21.9. However, a significant trend was seen across BMI categories only for advanced and Gleason-7 (Table 3). We observed weak inverse associations for total, non-advanced, and low-grade prostate cancer.
Table 3.
Relative risk of prostate cancer (PC) in relation to body mass index (BMI) at age 21 in the Health Professionals Follow-up Study (1986–2010)
| Body mass index at age 21 (kg/m2) | ||||||||
|---|---|---|---|---|---|---|---|---|
|
| ||||||||
| <20 | 20–21.9 | 22–23.9 | 24–25.9 | ≥26 | Ptrend | Continuous per 5 kg/m2 | ||
| Total PC | Cases | 825 | 1546 | 1852 | 1132 | 588 | ||
| MV-adj RRa | 0.99 (0.90–1.08) | 1.00 | 0.98 (0.91–1.05) | 0.92 (0.85–1.00) | 0.89 (0.80–0.98) | 0.01 | 0.94 (0.89–0.98) | |
|
| ||||||||
| Fatal PC | Cases | 94 | 181 | 177 | 88 | 51 | ||
| MV-adj RRa | 0.83 (0.64–1.07) | 1.00 | 0.92 (0.74–1.14) | 0.74 (0.57–0.97) | 0.77 (0.56–1.07) | 0.20 | 0.88 (0.75–1.02) | |
|
| ||||||||
| Lethal PCb | Cases | 118 | 231 | 223 | 118 | 63 | ||
| MV-adj RRa | 0.82 (0.65–1.03) | 1.00 | 0.90 (0.74–1.09) | 0.77 (0.61–0.96) | 0.73 (0.55–0.98) | 0.12 | 0.88 (0.76–1.00) | |
|
| ||||||||
| Advanced PCb | Cases | 150 | 290 | 300 | 155 | 81 | ||
| MV-adj RRa | 0.86 (0.70–1.06) | 1.00 | 0.92 (0.78–1.09) | 0.77 (0.62–0.94) | 0.69 (0.53–0.89) | 0.01 | 0.85 (0.76–0.96) | |
|
| ||||||||
| Non-advanced PCb | Cases | 537 | 970 | 1176 | 774 | 389 | ||
| MV-adj RRa | 1.04 (0.93–1.16) | 1.00 | 0.97 (0.89–1.06) | 0.96 (0.87–1.06) | 0.91 (0.81–1.03) | 0.05 | 0.93 (0.88–0.99) | |
|
| ||||||||
| Gleason 8–10 PC | Cases | 85 | 181 | 204 | 130 | 79 | ||
| MV-adj RRa | 0.82 (0.63–1.07) | 1.00 | 0.93 (0.75–1.15) | 0.91 (0.72–1.16) | 1.10 (0.83–1.45) | 0.27 | 1.03 (0.90–1.19) | |
|
| ||||||||
| Gleason 7 PC | Cases | 233 | 446 | 548 | 333 | 159 | ||
| MV-adj RRa | 0.98 (0.83–1.15) | 1.00 | 0.98 (0.86–1.11) | 0.90 (0.78–1.04) | 0.77 (0.64–0.93) | 0.01 | 0.87 (0.80–0.95) | |
|
| ||||||||
| Gleason 2–6 PC | Cases | 333 | 620 | 735 | 465 | 236 | ||
| MV-adj RRa | 1.01 (0.88–1.16) | 1.00 | 0.94 (0.84–1.05) | 0.90 (0.79–1.02) | 0.88 (0.75–1.03) | 0.03 | 0.93 (0.87–1.01) | |
Relative risks (RR) are hazard ratios with 95 % confidence intervals derived from Cox proportional hazards regression models. All models are multivariable (MV)-adjusted for age in months, calendar time, ethnicity (White, African-American, Asian-American, other), vigorous activity (0 MET-h/w; 0.1–3.4; 3.5–10.4; 10.5–28.4; ≥28.5), energy intake (continuous), smoking (never smoker; past smoker, quit >10 yrs ago; past smoker, quit ≤10 yrs ago; current smoker), diabetes (yes/no), family history of prostate cancer (father or brother, yes/no), prostate-specific antigen (PSA) test (yes/no, collected from 1994 onwards; lagged one period to avoid counting diagnostic tests as screening), and PSA intensity (PSA test in < or > 50% of periods, lagged one period). P values are derived from χ2 test for trend across exposure categories (α=0.05). Age-adjusted models showed little differences.
Lethal prostate cancer: Death due to prostate cancer or distant metastases at diagnosis or during follow-up. Advanced: T3b/T4 or N1 or M1 at diagnosis, lethal, or any metastases during follow-up. Non-advanced: T1/T2 and N0 and M0 at diagnosis, no metastases or death due to prostate cancer during follow-up.
The association between cumulative average BMI since baseline and prostate cancer risk was found to be non-proportional over age (P<0.001 for total prostate cancer); therefore we report the results stratified by age at diagnosis (Table 4). Among men 65 years or younger, BMI was inversely associated with total, non-advanced, Gleason-7, and low-grade prostate cancer. We observed no significant associations in men >65 years.
Table 4.
Relative risk of prostate cancer (PC) in relation to body mass index (BMI), cumulative average since 1988, stratified by age, in the Health Professionals Follow-up Study (1988–2010)
| Body mass index, cumulative average since 1988, lagged two years (kg/m2) | |||||||||
|---|---|---|---|---|---|---|---|---|---|
|
| |||||||||
| <21 | 21–22.9 | 23–24.9 | 25–27.4 | 27.5–29.9 | ≥30 | Ptrend | Continuous per 5 kg/m2 | ||
| Total PC | |||||||||
| Age ≤65 y | Cases | 65 | 280 | 557 | 576 | 297 | 147 | ||
| MV-adj RRa | 1.11 (0.84–1.48) | 1.00 | 0.90 (0.78–1.05) | 0.81 (0.70–0.94) | 0.81 (0.68–0.96) | 0.64 (0.51–0.78) | <0.001 | 0.83 (0.76–0.89) | |
| Age >65 y | Cases | 114 | 550 | 1188 | 1333 | 605 | 335 | ||
| MV-adj RRa | 0.87 (0.70–1.07) | 1.00 | 1.07 (0.96–1.19) | 1.04 (0.93–1.15) | 1.04 (0.92–1.18) | 0.97 (0.84–1.12) | 0.99 | 0.99 (0.94–1.05) | |
|
| |||||||||
| Fatal PC | |||||||||
| Age ≤65 y | Cases | 6 | 22 | 38 | 38 | 16 | 14 | ||
| MV-adj RRa | 1.32 (0.52–3.35) | 1.00 | 0.81 (0.47–1.40) | 0.68 (0.39–1.17) | 0.60 (0.31–1.17) | 0.83 (0.41–1.69) | 0.21 | 0.92 (0.70–1.22) | |
| Age >65 y | Cases | 15 | 70 | 127 | 134 | 64 | 34 | ||
| MV-adj RRa | 0.77 (0.43–1.37) | 1.00 | 0.95 (0.70–1.29) | 0.96 (0.71–1.31) | 1.05 (0.73–1.50) | 1.06 (0.68–1.64) | 0.43 | 1.03 (0.88–1.20) | |
|
| |||||||||
| Lethal PCb | |||||||||
| Age ≤65 y | Cases | 7 | 28 | 54 | 51 | 23 | 17 | ||
| MV-adj RRa | 1.17 (0.50–2.73) | 1.00 | 0.89 (0.55–1.43) | 0.72 (0.45–1.17) | 0.66 (0.37–1.18) | 0.83 (0.44–1.57) | 0.19 | 0.96 (0.75–1.21) | |
| Age >65 y | Cases | 22 | 85 | 160 | 165 | 83 | 39 | ||
| MV-adj RRa | 0.87 (0.53–1.43) | 1.00 | 0.98 (0.74–1.29) | 0.94 (0.71–1.24) | 1.08 (0.78–1.48) | 0.91 (0.61–1.35) | 0.92 | 0.99 (0.86–1.14) | |
|
| |||||||||
| Advanced PCb | |||||||||
| Age ≤65 y | Cases | 13 | 38 | 76 | 87 | 32 | 23 | ||
| MV-adj RRa | 1.59 (0.83–3.04) | 1.00 | 0.93 (0.62–1.39) | 0.88 (0.59–1.30) | 0.66 (0.40–1.08) | 0.79 (0.46–1.37) | 0.04 | 0.88 (0.71–1.08) | |
| Age >65 y | Cases | 23 | 107 | 198 | 209 | 101 | 45 | ||
| MV-adj RRa | 0.75 (0.46–1.21) | 1.00 | 0.95 (0.74–1.21) | 0.91 (0.71–1.16) | 0.99 (0.74–1.32) | 0.75 (0.52–1.08) | 0.50 | 0.94 (0.82–1.07) | |
|
| |||||||||
| Non-advanced PCb | |||||||||
| Age ≤65 y | Cases | 46 | 200 | 388 | 373 | 197 | 93 | ||
| MV-adj RRa | 1.11 (0.79–1.55) | 1.00 | 0.87 (0.73–1.04) | 0.73 (0.61–0.88) | 0.75 (0.61–0.93) | 0.57 (0.44–0.74) | <0.001 | 0.79 (0.71–0.87) | |
| Age >65 y | Cases | 69 | 357 | 777 | 848 | 381 | 214 | ||
| MV-adj RRa | 0.84 (0.65–1.10) | 1.00 | 1.07 (0.94–1.22) | 0.99 (0.87–1.13) | 0.99 (0.85–1.15) | 0.93 (0.78–1.11) | 0.43 | 0.96 (0.90–1.02) | |
|
| |||||||||
| Gleason 8–10 PC | |||||||||
| Age ≤65 y | Cases | 8 | 27 | 48 | 53 | 30 | 17 | ||
| MV-adj RRa | 1.45 (0.64–3.29) | 1.00 | 0.82 (0.50–1.35) | 0.76 (0.46–1.23) | 0.81 (0.47–1.39) | 0.74 (0.39–1.42) | 0.23 | 0.93 (0.73–1.17) | |
| Age >65 y | Cases | 16 | 57 | 157 | 149 | 81 | 49 | ||
| MV-adj RRa | 1.04 (0.58–1.85) | 1.00 | 1.40 (1.02–1.92) | 1.18 (0.86–1.61) | 1.41 (0.99–2.01) | 1.39 (0.93–2.09) | 0.18 | 1.12 (0.97–1.28) | |
|
| |||||||||
| Gleason 7 PC | |||||||||
| Age ≤65 y | Cases | 29 | 88 | 207 | 192 | 89 | 42 | ||
| MV-adj RRa | 1.70 (1.10–2.62) | 1.00 | 1.08 (0.84–1.39) | 0.87 (0.67–1.12) | 0.77 (0.57–1.05) | 0.57 (0.39–0.83) | <0.001 | 0.72 (0.63–0.83) | |
| Age >65 y | Cases | 32 | 147 | 324 | 349 | 167 | 83 | ||
| MV-adj RR* | 0.96 (0.65–1.43) | 1.00 | 1.10 (0.90–1.35) | 1.02 (0.83–1.24) | 1.04 (0.82–1.31) | 0.86 (0.65–1.14) | 0.29 | 0.91 (0.83–1.01) | |
|
| |||||||||
| Gleason 2–6 PC | |||||||||
| Age ≤65 y | Cases | 24 | 141 | 235 | 251 | 122 | 61 | ||
| MV-adj RRa | 0.77 (0.49–1.22) | 1.00 | 0.75 (0.61–0.94) | 0.73 (0.58–0.90) | 0.69 (0.54–0.89) | 0.57 (0.41–0.78) | 0.0015 | 0.82 (0.73–0.93) | |
| Age >65 y | Cases | 40 | 218 | 472 | 535 | 211 | 127 | ||
| MV-adj RRa | 0.76 (0.54–1.08) | 1.00 | 1.04 (0.88–1.23) | 0.99 (0.84–1.16) | 0.89 (0.73–1.08) | 0.91 (0.72–1.14) | 0.32 | 0.94 (0.87–1.03) | |
Relative risks (RR) are hazard ratios with 95 % confidence intervals derived from Cox proportional hazards regression models. All models are multivariable (MV)-adjusted for age in months, calendar time, ethnicity (White, African-American, Asian-American, other), vigorous activity (0 MET-h/w; 0.1–3.4; 3.5–10.4; 10.5–28.4; ≥28.5), energy intake (continuous), smoking (never smoker; past smoker, quit >10 yrs ago; past smoker, quit ≤10 yrs ago; current smoker), diabetes (yes/no), family history of prostate cancer (father or brother, yes/no), prostate-specific antigen (PSA) test (yes/no, collected from 1994 onwards; lagged one period to avoid counting diagnostic tests as screening), and PSA intensity (PSA test in < or > 50% of periods, lagged one period). P values are derived from χ2 test for trend across exposure categories (α=0.05). Age-adjusted models showed little differences.
Lethal prostate cancer: Death due to prostate cancer or distant metastases at diagnosis or during follow-up. Advanced: T3b/T4 or N1 or M1 at diagnosis, lethal, or any metastases during follow-up. Non-advanced: T1/T2 and N0 and M0 at diagnosis, no metastases or death due to prostate cancer during follow-up.
The associations between age 21 and adult BMI and prostate cancer were somewhat attenuated when additionally adjusting for childhood body shape, or mutual adjustment for BMI in early or late adulthood, respectively (Supplemental Tables 1 and 2), but not for height or waist circumference (data not shown).
Waist circumference was not associated with risk of total prostate cancer (multivariable-adjusted RR for each quintile versus lowest quintile: Q2: 1.09, 95% CI 1.00–1.20, Q3: 1.01, 95% CI 0.91–1.10, Q4: 1.00, 95% CI 0.91–1.10, Q5: 0.97, 95% CI 0.88–1.06, Ptrend=0.10; continuous per 1-inch increase: 0.99, 95% CI 0.99–1.00). Higher waist circumference was associated with lower risk of non-advanced (multivariable-adjusted RR for top versus bottom quintile: 0.93, 95% CI 0.82–1.04, Ptrend=0.03), Gleason-7 (multivariable-adjusted RR 0.84, 95% CI 0.70–1.00, Ptrend=0.02) and low-grade prostate cancer (multivariable-adjusted RR 0.88, 95% CI 0.75–1.02, Ptrend=0.01). The observed associations were weakened when adjusting for either childhood body shape or adult BMI. Waist circumference was not associated with other prostate cancer subtypes (data not shown).
Investigating body shape at age 10, we found inverse associations between the middle-size category (silhouette 5) and with risk of total, non-advanced, and low-grade prostate cancer (Table 5). The inverse associations for the most overweight/obese category (silhouettes 6–9) were not statistically significant. We found men in the thinnest category (silhouette 1) to have had a weakly increased risk of total, non-advanced, and Gleason-7 disease compared to the reference group (silhouette 2). Results were similar when stratified by age ≤65 years and >65 years (data not shown).
Table 5.
Relative risk of prostate cancer (PC) in relation to body shape at age 10 in the Health Professionals Follow-up Study (1988–2010)
| Body shape at age 10a | ||||||||
|---|---|---|---|---|---|---|---|---|
|
| ||||||||
| Silhouette 1 | Silhouette 2 | Silhouette 3 | Silhouette 4 | Silhouette 5 | Silhouette 6–9 | Ptrend | ||
| Total PC | Cases | 1251 | 1516 | 802 | 454 | 316 | 332 | |
| MV-adj RRb | 1.08 (1.00–1.17) | 1.00 | 1.02 (0.93–1.11) | 0.95 (0.85–1.06) | 0.87 (0.77–0.99) | 0.95 (0.84–1.08) | 0.0014 | |
|
| ||||||||
| Fatal PC | Cases | 120 | 150 | 68 | 35 | 42 | 20 | |
| MV-adj RRb | 1.02 (0.79–1.31) | 1.00 | 0.98 (0.72–1.33) | 0.83 (0.56–1.23) | 1.46 (1.01–2.11) | 0.82 (0.50–1.34) | 0.91 | |
|
| ||||||||
| Lethal PCc | Cases | 168 | 183 | 85 | 47 | 47 | 30 | |
| MV-adj RRb | 1.17 (0.94–1.46) | 1.00 | 0.97 (0.74–1.28) | 0.92 (0.65–1.29) | 1.27 (0.91–1.79) | 0.99 (0.66–1.49) | 0.57 | |
|
| ||||||||
| Advanced PCc | Cases | 212 | 240 | 126 | 62 | 58 | 38 | |
| MV-adj RRb | 1.11 (0.91–1.34) | 1.00 | 1.07 (0.85–1.34) | 0.88 (0.66–1.18) | 1.07 (0.79–1.44) | 0.84 (0.59–1.20) | 0.18 | |
|
| ||||||||
| Non-advanced PCc | Cases | 841 | 1006 | 548 | 315 | 199 | 231 | |
| MV-adj RRb | 1.11 (1.01–1.22) | 1.00 | 1.05 (0.94–1.16) | 0.97 (0.85–1.11) | 0.80 (0.69–0.94) | 0.95 (0.82–1.10) | 0.0010 | |
|
| ||||||||
| Gleason 8–10 PC | Cases | 137 | 175 | 96 | 58 | 45 | 37 | |
| MV-adj RRb | 0.98 (0.78–1.24) | 1.00 | 1.05 (0.81–1.36) | 1.04 (0.76–1.42) | 1.14 (0.81–1.59) | 1.04 (0.72–1.50) | 0.47 | |
|
| ||||||||
| Gleason 7 PC | Cases | 381 | 413 | 248 | 145 | 87 | 102 | |
| MV-adj RRb | 1.20 (1.04–1.39) | 1.00 | 1.15 (0.97–1.35) | 1.12 (0.92–1.36) | 0.87 (0.68–1.10) | 0.98 (0.78–1.22) | 0.05 | |
|
| ||||||||
| Gleason 2–6 PC | Cases | 519 | 668 | 325 | 185 | 129 | 142 | |
| MV-adj RRb | 1.05 (0.93–1.18) | 1.00 | 0.94 (0.82–1.08) | 0.85 (0.72–1.01) | 0.76 (0.62–0.92) | 0.90 (0.74–1.08) | <0.001 | |
Based on pictogram in Fig. 1.mol
Relative risks (RR) are hazard ratios with 95 % confidence intervals derived from Cox proportional hazards regression models. All models are multivariable (MV)-adjusted for age in months, calendar time, ethnicity (White, African-American, Asian-American, other), vigorous activity (0 MET-h/w; 0.1–3.4; 3.5–10.4; 10.5–28.4; ≥28.5), energy intake (continuous), smoking (never smoker; past smoker, quit >10 yrs ago; past smoker, quit ≤10 yrs ago; current smoker), diabetes (yes/no), family history of prostate cancer (father or brother, yes/no), prostate-specific antigen (PSA) test (yes/no, collected from 1994 onwards; lagged one period to avoid counting diagnostic tests as screening), and PSA intensity (PSA test in < or > 50% of periods, lagged one period). P values are derived from χ2 test for trend across exposure categories (α=0.05). Age-adjusted models showed little differences.
Lethal prostate cancer: Death due to prostate cancer or distant metastases at diagnosis or during follow-up. Advanced: T3b/T4 or N1 or M1 at diagnosis, lethal, or any metastases during follow-up. Non-advanced: T1/T2 and N0 and M0 at diagnosis, no metastases or death due to prostate cancer during follow-up.
Beside the interaction between cumulative average BMI and age, we observed no significant interactions between any of the anthropometric variables and age or family history of prostate cancer (Pinteraction >0.05). However, in stratified analyses the positive associations between tall height and fatal, lethal and advanced disease were more pronounced in men ≤65 years and in men with no family history of prostate cancer, compared to men >65 years or men with an affected father or brother. Furthermore, the observed inverse associations between BMI at age 21 and total, non-advanced, Gleason-7 and low-grade prostate cancer appeared stronger in men ≤65 years compared to older men.
Additional analyses showed overall similar results in the cohort of highly screened men compared to the full cohort (data not shown).
Discussion
In this large prospective cohort study with over 20 years of follow-up, we found taller height to be positively associated with fatal and advanced-stage prostate cancer, in line with prior findings [1,14]. We also confirmed the previously reported inverse association between high BMI at age 21 and advanced and lethal prostate cancer [10,14]. In addition, higher cumulative average BMI was associated with reduced risk of total, non-advanced, and less aggressive disease in men ≤65 years at diagnosis. Waist circumference was weakly inversely associated with less aggressive disease. We observed no clear association between childhood body size and prostate cancer.
Strengths of our study include the prospective design with repeated measures of weight and other lifestyle factors and data on early-life body size. The large study sample with extensive information on tumor stage and grade and long follow-up on progression and mortality enabled detailed analyses of prognostic disease subtypes.
The self-reported measures of body size are a potential limitation. However, self-reported and measured height, weight and waist circumference have been highly correlated in men (r~0.95) [19,25], and recalled weight in early adulthood has been highly correlated with measured weight [21]. The pictogram assessing body shape in different ages has been shown useful to identify thin (silhouettes 1–4) and obese (silhouettes 6–9) individuals [25], and has also shown good correlation with weight measured in childhood [21]. Nevertheless, we cannot rule out potential bias caused by exposure misclassification, although it is most likely non-differential due to the prospective study design.
Our findings on height are in line with other studies. A meta-analysis including thirteen cohort studies yielded a pooled RR for advanced/aggressive/fatal prostate cancer of 1.12 (95% CI 1.05–1.19) for every 10 cm (~3.9 in) increment in height [5]. Another meta-analysis based on 31 cohort studies yielded a pooled estimate for total prostate cancer of 1.09 (95% CI 1.06–1.12) [5]. It is not clear why a positive association was observed between height and grade 7 cancer, but not high-grade cancer; it is possible this was due to lower numbers of high-grade cases.
Our analysis of BMI at age 21 showed a 20–30 % reduced risk of fatal, lethal and advanced disease and a weak risk reduction for total prostate cancer comparing the highest to the lowest BMI category. Other studies show inconsistent evidence of an association between obesity in early adulthood (18–30 years) and prostate cancer. A review of studies on total prostate cancer suggest no or a weak positive relationship [26]. Two studies reported inverse associations with advanced [11] or fatal [9] disease, similar to our findings, whereas others show null associations [2,9,12,27,28]. Findings for non-advanced or non-aggressive prostate cancer are mixed [2,9,12,28].
BMI in middle-to-late adulthood has been contrarily related to prostate cancer across disease subtypes. Meta-analyses have shown modest positive associations with total prostate cancer [3,29], although many individual studies report null findings. This is in contrast to the inverse association observed in the current study. A probable explanation is the stronger inverse association with non-advanced/less aggressive disease, similar to what several other prospective studies have reported [2,9,17,28,30,31]. A recent meta-analysis based on 12 prospective studies showed an RR of 0.94 (95% CI 0.91–0.97) for localized prostate cancer for every 5 kg/m2 increase in BMI [7]. For advanced, high-grade, and fatal disease there is evidence of a positive association with obesity [3,6,7,17,31–33]; meta-analyses have yielded RRs in the range 1.09–1.12 for advanced disease for every 5 kg/m2 increase in BMI [3,7], and RR 1.15 (95% CI 1.06–1.25) for prostate cancer-specific mortality [6]. However, findings are divergent as several cohort studies have found no associations with advanced [2,4,9,12,28,30] or fatal [6] prostate cancer, which is in agreement with the current study.
Waist circumference was not associated with total prostate cancer risk [14]. This is consistent with our previous investigation [14] and two partly overlapping meta-analyses including cohort and case-control studies [3,34]. However, a more recent meta-analysis showed a 56% (P=0.007) increased risk of total prostate cancer for waist circumference >102 cm (40.2 in) [35]. Our findings of an inverse association with less aggressive disease are in agreement with findings in the Prostate Cancer Prevention Trial (RR 0.78, 95% CI 0.66–0.93, highest versus lowest quartile, Ptrend=0.02) [17]. Positive associations have been suggested for advanced/aggressive prostate cancer in prospective cohort studies [17,30,36].
Previously in our study population, baseline BMI and waist circumference were more strongly associated with total prostate cancer in men <60 years and men with a family history of prostate cancer [10]. In the current study, the inverse associations between BMI in early and late adulthood and non-advanced/less aggressive disease were all stronger in men ≤65 years compared to older men. Furthermore, the association with height appeared to differ between strata of age and family history of prostate cancer, although these results should be interpreted with caution as the formal test for interaction was non-significant. Tumors manifesting in early age or in men with an affected father or brother are mainly hereditary, and the mechanistic pathways of hereditary prostate cancer may differ from those of sporadic tumors [10], although the distinct biologic mechanisms are yet largely unknown.
Although the observed inverse associations between BMI and waist circumference in middle-to-late adulthood and total/non-advanced/low-grade tumors are in agreement with other studies, these results may be influenced by detection bias. Due to lower PSA values and difficulties in performing diagnostic tests [37], obese men are less likely to be diagnosed with prostate cancer, especially at an early stage, than non-obese men. This could weaken or even reverse potentially positive associations between obesity and early-stage tumors. Reverse causation due to disease-related weight loss is not likely to explain the observed findings for adult obesity since it would mainly have affected the estimates for lethal/advanced disease and because we excluded the first two years of follow-up. However, it is unlikely that detection bias or reverse causation would be stronger in the young age group where we observed the strongest associations. Finally, competing risks are a possible explanation for the inverse associations, as men with higher BMI or waist circumference may be at increased risk of death due to other causes, resulting in an apparent protective effect of obesity on prostate cancer diagnosis or death. This would likely play more of a role in the null findings for lethal prostate cancer than for the inverse findings for localized or low-grade disease, because men would need to survive long enough after diagnosis to develop metastatic and eventually fatal prostate cancer. Again, though, competing risks would likely not explain our stronger findings for younger men, as competing risks play a larger role among older study populations where death rates are higher.
We observed greater attenuation overall when adjusting for BMI at age 21 in analyses of cumulative average BMI or waist circumference than the reverse. This supports our hypothesis that body size in early adulthood is more strongly related to prostate cancer development than body size later in life.
Previous findings of an inverse association between childhood obesity and advanced/metastatic prostate cancer in the same cohort [14] were not confirmed in our updated analysis. Although we found men in the middle-size category in childhood to be at lower risk for total, non-advanced and low-grade disease, no association was seen in the most overweight/obese group. This remained true when results were stratified by age at diagnosis, suggesting that the older age of the cohort does not explain the difference in results from our previous publication. A large Danish cohort study found BMI at age 7–13 to be positively associated with total and localized prostate cancer, but not metastatic disease; however, the associations became non-significant when adjusting for childhood height [15]. Two case-control studies reported lower risk of total or advanced prostate cancer in men being overweight/obese at age 10–13 [11,13]. Other case-control studies did not find any associations with body size at age 8–9 [16] or in adolescence [38–40], though these studies made no distinction between prostate cancer subtypes. In the current study, the observed higher risk of non-advanced and Gleason-7 disease among men the thinnest category may be due to unmeasured confounding factors causing extreme thinness in childhood and should thus be cautiously interpreted.
The results for all exposures were overall stable between age- and multivariable-adjusted models, and additional adjustment for dietary factors produced little differences. However, residual or unmeasured confounding cannot be ruled out in our study. PSA testing is an important covariate that we included. Because men with higher adult BMI were somewhat less likely to have had a PSA test in 1994, the associations with non-advanced/low-grade prostate cancer could potentially be biased towards a more inverse association. However, the results were overall similar in the cohort of highly screened men, so residual confounding by PSA testing is probably not a major explanation.
Plausible biological mechanisms for a potential association between body size and prostate cancer involve hormonal and metabolic pathways that interact in a complex manner. These include the insulin/insulin-like growth factor-I (IGF-I) axis, sex hormones, and inflammation-mediated pathways, although the latter remain largely unclear [41]. High levels of IGF-I [42–44] and insulin [45–47] have been positively linked to prostate cancer risk and mortality, whereas low testosterone levels have been associated with increased risk of aggressive prostate cancer [37,48].
Overweight and obesity in adult men correlate with both higher circulating levels of insulin and free IGF-I, and lower levels of testosterone [41]. However, insulin resistance and long-lasting diabetes, both long-term consequences of obesity, have been inversely associated with prostate cancer, possibly by limiting the negative effects of insulin [41]. It has thus been suggested that obesity could impose a higher risk of aggressive prostate cancer but a lower risk of non-aggressive disease [34,48], the latter being supported by the current study.
Puberty is associated with a sharp rise in IGF-I levels [49]. Obesity in pre-pubertal age may delay onset of puberty [50], leading to lower exposure of IGF-I at a potentially critical time point in male development, or alternatively lower cumulative lifetime exposure; both could hypothetically lead to a lower risk of developing prostate cancer later in life. Adolescent obesity has been seen to persist in early adulthood [51], thus the observed inverse association between overweight at age 21 and prostate cancer could be the result of lower IGF-I levels.
Attained height is thought to be a marker for early-life factors potentially associated with prostate cancer such as exposure to growth hormones, notably IGF-I, in childhood/adolescence [5]. Supported by the observed positive associations with advanced-stage tumors in our study, the early-life factors predicting height may prime the prostate gland at an early age for later development of a more aggressive tumor. If height is involved in low-grade tumors progressing into high-grade tumors, this could potentially also explain the observed inverse association between height and low-grade disease.
In conclusion, our updated extensive analysis of the Health Professionals Follow-up Study identified tall men to be at increased risk of advanced and fatal prostate cancer. We further showed that the influence of body weight varies by tumor stage and aggressiveness as well as between different periods in life. However, more observational and experimental studies are needed in order to draw conclusions on causality regarding the complex role of body size in prostate cancer development. The timing of exposure as well as disease subtypes are fundamental to consider in future studies.
Supplementary Material
Novelty & Impact Statement.
The relationship between body size and prostate cancer is complex. Body size changes progressively throughout life and consequent affects on prostate cancer risk may be associated with related changes in hormonal and metabolic pathways. This large prospective study examined potential associations between the risk of various prostate cancer subtypes and multiple anthropometric measures at different ages in men. Tallness was confirmed to be associated with an elevated risk of advanced prostate cancer, particularly fatal disease. The extent to which body weight influenced risk varied according to factors such as age and disease subtype.
Acknowledgments
The study was funded by the National Institutes of Health (grant No. PO1 CA055075, CA141298, and CA13389, UM1 CA167552). E. Möller was supported by the Swedish Cancer Society (grant No. 110563); J.L. Batista and K.M. Wilson are supported by the Dana-Farber Cancer Institute Mazzone Awards Program; LA Mucci and KM Wilson are supported by Prostate Cancer Foundation Young Investigator Awards. The funding bodies had no influence in the design or conduct of the study, analysis and interpretation of the data, or preparation of the article. We would like to thank the participants and staff of the HPFS for their valuable contributions as well as the following state cancer registries for their help: AL, AZ, AR, CA, CO, CT, DE, FL, GA, ID, IL, IN, IA, KY, LA, ME, MD, MA, MI, NE, NH, NJ, NY, NC, ND, OH, OK, OR, PA, RI, SC, TN, TX, VA, WA, WY. The authors assume full responsibility for analyses and interpretation of these data.
Footnotes
Conflict of interest
The authors declare no conflicts of interest.
References
- 1.Giovannucci E, Liu Y, Platz EA, Stampfer MJ, Willett WC. Risk factors for prostate cancer incidence and progression in the health professionals follow-up study. Int J Cancer. 2007;121:1571–8. doi: 10.1002/ijc.22788. [DOI] [PMC free article] [PubMed] [Google Scholar]
- 2.Littman AJ, White E, Kristal AR. Anthropometrics and prostate cancer risk. Am J Epidemiol. 2007;165:1271–9. doi: 10.1093/aje/kwm013. [DOI] [PubMed] [Google Scholar]
- 3.MacInnis RJ, English DR. Body size and composition and prostate cancer risk: systematic review and meta-regression analysis. Cancer Causes Control. 2006;17:989–1003. doi: 10.1007/s10552-006-0049-z. [DOI] [PubMed] [Google Scholar]
- 4.Wallstrom P, Bjartell A, Gullberg B, Olsson H, Wirfalt E. A prospective Swedish study on body size, body composition, diabetes, and prostate cancer risk. Br J Cancer. 2009;100:1799–1805. doi: 10.1038/sj.bjc.6605077. [DOI] [PMC free article] [PubMed] [Google Scholar]
- 5.Zuccolo L, Harris R, Gunnell D, Oliver S, Lane JA, Davis M, Donovan J, Neal D, Hamdy F, Beynon R, Savovic J, Martin RM. Height and prostate cancer risk: a large nested case-control study (ProtecT) and meta-analysis. Cancer Epidemiol Biomarkers Prev. 2008;17:2325–36. doi: 10.1158/1055-9965.EPI-08-0342. [DOI] [PMC free article] [PubMed] [Google Scholar]
- 6.Cao Y, Ma J. Body mass index, prostate cancer-specific mortality, and biochemical recurrence: a systematic review and meta-analysis. Cancer Prev Res (Phila) 2011;4:486–501. doi: 10.1158/1940-6207.CAPR-10-0229. [DOI] [PMC free article] [PubMed] [Google Scholar]
- 7.Discacciati A, Orsini N, Wolk A. Body mass index and incidence of localized and advanced prostate cancer – a dose-response meta-analysis of prospective studies. Ann Oncol. 2012;23:1665–71. doi: 10.1093/annonc/mdr603. [DOI] [PubMed] [Google Scholar]
- 8.Sakr WA, Haas GP, Cassin BF, Pontes JE, Crissman JD. The frequency of carcinoma and intraepithelial neoplasia of the prostate in young male patients. J Urol. 1993;150:379–85. doi: 10.1016/s0022-5347(17)35487-3. [DOI] [PubMed] [Google Scholar]
- 9.Discacciati A, Orsini N, Andersson SO, Andren O, Johansson JE, Wolk A. Body mass index in early and middle-late adulthood and risk of localised, advanced and fatal prostate cancer: a population-based prospective study. Br J Cancer. 2011;105:1061–8. doi: 10.1038/bjc.2011.319. [DOI] [PMC free article] [PubMed] [Google Scholar]
- 10.Giovannucci E, Rimm EB, Liu Y, Leitzmann M, Wu K, Stampfer MJ, Willett WC. Body mass index and risk of prostate cancer in U.S. health professionals. J Natl Cancer Inst. 2003;95:1240–4. doi: 10.1093/jnci/djg009. [DOI] [PubMed] [Google Scholar]
- 11.Robinson WR, Stevens J, Gammon MD, John EM. Obesity before age 30 years and risk of advanced prostate cancer. Am J Epidemiol. 2005;161:1107–14. doi: 10.1093/aje/kwi150. [DOI] [PubMed] [Google Scholar]
- 12.Schuurman AG, Goldbohm RA, Dorant E, van den Brandt PA. Anthropometry in relation to prostate cancer risk in the Netherlands Cohort Study. Am J Epidemiol. 2000;151:541–9. doi: 10.1093/oxfordjournals.aje.a010241. [DOI] [PubMed] [Google Scholar]
- 13.Barba M, Terrenato I, Schunemann HJ, Fuhrman B, Sperati F, Teter B, Gallucci M, D’Amato A, Muti P. Indicators of sexual and somatic development and adolescent body size in relation to prostate cancer risk: results from a case-control study. Urology. 2008;72:183–7. doi: 10.1016/j.urology.2007.09.065. [DOI] [PubMed] [Google Scholar]
- 14.Giovannucci E, Rimm EB, Stampfer MJ, Colditz GA, Willett WC. Height, body weight, and risk of prostate cancer. Cancer Epidemiol Biomarkers Prev. 1997;6:557–63. [PubMed] [Google Scholar]
- 15.Aarestrup J, Gamborg M, Cook MB, Sørensen TI, Baker JL. Childhood body mass index and the risk of prostate cancer in adult men. Br J Cancer. 2014;111:207–12. doi: 10.1038/bjc.2014.266. [DOI] [PMC free article] [PubMed] [Google Scholar]
- 16.Hsing AW, Deng J, Sesterhenn IA, Mostofi FK, Stanczyk FZ, Benichou J, Xie T, Gao YT. Body size and prostate cancer: a population-based case-control study in China. Cancer Epidemiol Biomarkers Prev. 2000;9:1335–41. [PubMed] [Google Scholar]
- 17.Gong Z, Neuhouser ML, Goodman PJ, Albanes D, Chi C, Hsing AW, Lippman SM, Platz EA, Pollak MN, Thompson IM, Kristal AR. Obesity, diabetes, and risk of prostate cancer: results from the prostate cancer prevention trial. Cancer Epidemiol Biomarkers Prev. 2006;15:1977–83. doi: 10.1158/1055-9965.EPI-06-0477. [DOI] [PubMed] [Google Scholar]
- 18.Giovannucci E, Rimm EB, Colditz GA, Stampfer MJ, Ascherio A, Chute CC, Willett WC. A prospective study of dietary fat and risk of prostate cancer. J Natl Cancer Inst. 1993;85:1571–9. doi: 10.1093/jnci/85.19.1571. [DOI] [PubMed] [Google Scholar]
- 19.Rimm EB, Stampfer MJ, Colditz GA, Chute CG, Litin LB, Willett WC. Validity of self-reported waist and hip circumferences in men and women. Epidemiology. 1990;1:466–73. doi: 10.1097/00001648-199011000-00009. [DOI] [PubMed] [Google Scholar]
- 20.Stunkard AJ, Sorensen T, Schulsinger F. Use of the Danish Adoption Register for the study of obesity and thinness. Res Publ Assoc Res Nerv Ment Dis. 1983;60:115–20. [PubMed] [Google Scholar]
- 21.Must A, Willett WC, Dietz WH. Remote recall of childhood height, weight, and body build by elderly subjects. Am J Epidemiol. 1993;138:56–64. doi: 10.1093/oxfordjournals.aje.a116777. [DOI] [PubMed] [Google Scholar]
- 22.Chasan-Taber S, Rimm EB, Stampfer MJ, Spiegelman D, Colditz GA, Giovannucci E, Ascherio A, Willett WC. Reproducibility and validity of a self-administered physical activity questionnaire for male health professionals. Epidemiology. 1996;7:81–6. doi: 10.1097/00001648-199601000-00014. [DOI] [PubMed] [Google Scholar]
- 23.Rimm EB, Giovannucci EL, Stampfer MJ, Colditz GA, Litin LB, Willett WC. Reproducibility and validity of an expanded self-administered semiquantitative food frequency questionnaire among male health professionals. Am J Epidemiol. 1992;135:1114–26. doi: 10.1093/oxfordjournals.aje.a116211. discussion 1127–36. [DOI] [PubMed] [Google Scholar]
- 24.Colditz GA, Willett WC, Stampfer MJ, Manson JE, Hennekens CH, Arky RA, Speizer FE. Weight as a risk factor for clinical diabetes in women. Am J Epidemiol. 1990;132:501–13. doi: 10.1093/oxfordjournals.aje.a115686. [DOI] [PubMed] [Google Scholar]
- 25.Bulik CM, Wade TD, Heath AC, Martin NG, Stunkard AJ, Eaves LJ. Relating body mass index to figural stimuli: population-based normative data for Caucasians. Int J Obes Relat Metab Disord. 2001;25:1517–24. doi: 10.1038/sj.ijo.0801742. [DOI] [PubMed] [Google Scholar]
- 26.Robinson WR, Poole C, Godley PA. Systematic review of prostate cancer’s association with body size in childhood and young adulthood. Cancer Causes Control. 2008;19:793–803. doi: 10.1007/s10552-008-9142-9. [DOI] [PubMed] [Google Scholar]
- 27.Giles GG, Severi G, English DR, McCredie MR, MacInnis R, Boyle P, Hopper JL. Early growth, adult body size and prostate cancer risk. Int J Cancer. 2003;103:241–5. doi: 10.1002/ijc.10810. [DOI] [PubMed] [Google Scholar]
- 28.Wright ME, Chang SC, Schatzkin A, Albanes D, Kipnis V, Mouw T, Hurwitz P, Hollenbeck A, Leitzmann MF. Prospective study of adiposity and weight change in relation to prostate cancer incidence and mortality. Cancer. 2007;109:675–84. doi: 10.1002/cncr.22443. [DOI] [PubMed] [Google Scholar]
- 29.Renehan AG, Tyson M, Egger M, Heller RF, Zwahlen M. Body-mass index and incidence of cancer: a systematic review and meta-analysis of prospective observational studies. Lancet. 2008;371:569–78. doi: 10.1016/S0140-6736(08)60269-X. [DOI] [PubMed] [Google Scholar]
- 30.Pischon T, Boeing H, Weikert S, Allen N, Key T, Johnsen NF, Tjonneland A, Severinsen MT, Overvad K, Rohrmann S, Kaaks R, Trichopoulou A, et al. Body size and risk of prostate cancer in the European prospective investigation into cancer and nutrition. Cancer Epidemiol Biomarkers Prev. 2008;17:3252–61. doi: 10.1158/1055-9965.EPI-08-0609. [DOI] [PubMed] [Google Scholar]
- 31.Rodriguez C, Freedland SJ, Deka A, Jacobs EJ, McCullough ML, Patel AV, Thun MJ, Calle EE. Body mass index, weight change, and risk of prostate cancer in the Cancer Prevention Study II Nutrition Cohort. Cancer Epidemiol Biomarkers Prev. 2007;16:63–9. doi: 10.1158/1055-9965.EPI-06-0754. [DOI] [PubMed] [Google Scholar]
- 32.Bassett JK, Severi G, Baglietto L, MacInnis RJ, Hoang HN, Hopper JL, English DR, Giles GG. Weight change and prostate cancer incidence and mortality. Int J Cancer. 2012;131:1711–9. doi: 10.1002/ijc.27414. [DOI] [PubMed] [Google Scholar]
- 33.Stocks T, Hergens MP, Englund A, Ye W, Stattin P. Blood pressure, body size and prostate cancer risk in the Swedish Construction Workers cohort. Int J Cancer. 2010;127:1660–8. doi: 10.1002/ijc.25171. [DOI] [PubMed] [Google Scholar]
- 34.Hsing AW, Sakoda LC, Chua S., Jr Obesity, metabolic syndrome, and prostate cancer. Am J Clin Nutr. 2007;86:s843–57. doi: 10.1093/ajcn/86.3.843S. [DOI] [PubMed] [Google Scholar]
- 35.Esposito K, Chiodini P, Capuano A, Bellastella G, Maiorino MI, Parretta E, Lenzi A, Giugliano D. Effect of metabolic syndrome and its components on prostate cancer risk: Meta-analysis. J Endocrinol Invest. 2013;36:132–9. doi: 10.1007/BF03346748. [DOI] [PubMed] [Google Scholar]
- 36.MacInnis RJ, English DR, Gertig DM, Hopper JL, Giles GG. Body size and composition and prostate cancer risk. Cancer Epidemiol Biomarkers Prev. 2003;12:1417–21. [PubMed] [Google Scholar]
- 37.Allott EH, Masko EM, Freedland SJ. Obesity and prostate cancer: weighing the evidence. Eur Urol. 2013;63:800–9. doi: 10.1016/j.eururo.2012.11.013. [DOI] [PMC free article] [PubMed] [Google Scholar]
- 38.Andersson SO, Baron J, Wolk A, Lindgren C, Bergstrom R, Adami HO. Early life risk factors for prostate cancer: a population-based case-control study in Sweden. Cancer Epidemiol Biomarkers Prev. 1995;4:187–92. [PubMed] [Google Scholar]
- 39.Dal Maso L, Zucchetto A, La Vecchia C, Montella M, Conti E, Canzonieri V, Talamini R, Tavani A, Negri E, Garbeglio A, Franceschi S. Prostate cancer and body size at different ages: an Italian multicentre case-control study. Br J Cancer. 2004;90:2176–80. doi: 10.1038/sj.bjc.6601859. [DOI] [PMC free article] [PubMed] [Google Scholar]
- 40.Ilic M, Vlajinac H, Marinkovic J. Case-control study of risk factors for prostate cancer. Br J Cancer. 1996;74:1682–6. doi: 10.1038/bjc.1996.610. [DOI] [PMC free article] [PubMed] [Google Scholar]
- 41.Roberts DL, Dive C, Renehan AG. Biological mechanisms linking obesity and cancer risk: new perspectives. Annu Rev Med. 2010;61:301–16. doi: 10.1146/annurev.med.080708.082713. [DOI] [PubMed] [Google Scholar]
- 42.Price AJ, Allen NE, Appleby PN, Crowe FL, Travis RC, Tipper SJ, Overvad K, Gronbaek H, Tjonneland A, Johnsen NF, Rinaldi S, Kaaks R, et al. Insulin-like growth factor-I concentration and risk of prostate cancer: results from the European Prospective Investigation into Cancer and Nutrition. Cancer Epidemiol Biomarkers Prev. 2012;21:1531–41. doi: 10.1158/1055-9965.EPI-12-0481-T. [DOI] [PMC free article] [PubMed] [Google Scholar]
- 43.Roddam AW, Allen NE, Appleby P, Key TJ, Ferrucci L, Carter HB, Metter EJ, Chen C, Weiss NS, Fitzpatrick A, Hsing AW, Lacey JV, Jr, et al. Insulin-like growth factors, their binding proteins, and prostate cancer risk: Analysis of individual patient data from 12 prospective studies. Ann Intern Med. 2008;149:461–W88. doi: 10.7326/0003-4819-149-7-200810070-00006. [DOI] [PMC free article] [PubMed] [Google Scholar]
- 44.Rowlands MA, Gunnell D, Harris R, Vatten LJ, Holly JM, Martin RM. Circulating insulin-like growth factor peptides and prostate cancer risk: a systematic review and meta-analysis. Int J Cancer. 2009;124:2416–29. doi: 10.1002/ijc.24202. [DOI] [PMC free article] [PubMed] [Google Scholar]
- 45.Albanes D, Weinstein SJ, Wright ME, Mannisto S, Limburg PJ, Snyder K, Virtamo J. Serum insulin, glucose, indices of insulin resistance, and risk of prostate cancer. J Natl Cancer Inst. 2009;101:1272–9. doi: 10.1093/jnci/djp260. [DOI] [PMC free article] [PubMed] [Google Scholar]
- 46.Ma J, Li H, Giovannucci E, Mucci L, Qiu W, Nguyen PL, Gaziano JM, Pollak M, Stampfer MJ. Prediagnostic body-mass index, plasma C-peptide concentration, and prostate cancer-specific mortality in men with prostate cancer: a long-term survival analysis. Lancet Oncol. 2008;9:1039–47. doi: 10.1016/S1470-2045(08)70235-3. [DOI] [PMC free article] [PubMed] [Google Scholar]
- 47.Neuhouser ML, Till C, Kristal A, Goodman P, Hoque A, Platz EA, Hsing AW, Albanes D, Parnes HL, Pollak M. Finasteride modifies the relation between serum C-peptide and prostate cancer risk: results from the Prostate Cancer Prevention Trial. Cancer Prev Res (Phila) 2010;3:279–89. doi: 10.1158/1940-6207.CAPR-09-0188. [DOI] [PMC free article] [PubMed] [Google Scholar]
- 48.Freedland SJ, Platz EA. Obesity and prostate cancer: making sense out of apparently conflicting data. Epidemiol Rev. 2007;29:88–97. doi: 10.1093/epirev/mxm006. [DOI] [PubMed] [Google Scholar]
- 49.Juul A, Bang P, Hertel NT, Main K, Dalgaard P, Jorgensen K, Müller J, Hall K, Skakkebaek NE. Serum insulin-like growth factor-I in 1030 healthy children, adolescents, and adults: relation to age, sex, stage of puberty, testicular size, and body mass index. J Clin Endocrinol Metab. 1994;78:744–52. doi: 10.1210/jcem.78.3.8126152. [DOI] [PubMed] [Google Scholar]
- 50.Wang Y. Is obesity associated with early sexual maturation? A comparison of the association in American boys versus girls. Pediatrics. 2002;110:903–10. doi: 10.1542/peds.110.5.903. [DOI] [PubMed] [Google Scholar]
- 51.The NS, Suchindran C, North KE, Popkin BM, Gordon-Larsen P. Association of adolescent obesity with risk of severe obesity in adulthood. JAMA. 2010;304:2042–7. doi: 10.1001/jama.2010.1635. [DOI] [PMC free article] [PubMed] [Google Scholar]
Associated Data
This section collects any data citations, data availability statements, or supplementary materials included in this article.