Abstract
Accurate and timely rice paddy field maps with a fine spatial resolution would greatly improve our understanding of the effects of paddy rice agriculture on greenhouse gases emissions, food and water security, and human health. Rice paddy field maps were developed using optical images with high temporal resolution and coarse spatial resolution (e.g., Moderate Resolution Imaging Spectroradiometer (MODIS)) or low temporal resolution and high spatial resolution (e.g., Landsat TM/ETM+). In the past, the accuracy and efficiency for rice paddy field mapping at fine spatial resolutions were limited by the poor data availability and image-based algorithms. In this paper, time series MODIS and Landsat ETM+/OLI images, and the pixel- and phenology-based algorithm are used to map paddy rice planting area. The unique physical features of rice paddy fields during the flooding/open-canopy period are captured with the dynamics of vegetation indices, which are then used to identify rice paddy fields. The algorithm is tested in the Sanjiang Plain (path/row 114/27) in China in 2013. The overall accuracy of the resulted map of paddy rice planting area generated by both Landsat ETM+ and OLI is 97.3%, when evaluated with areas of interest (AOIs) derived from geo-referenced field photos. The paddy rice planting area map also agrees reasonably well with the official statistics at the level of state farms (R2 = 0.94). These results demonstrate that the combination of fine spatial resolution images and the phenology-based algorithm can provide a simple, robust, and automated approach to map the distribution of paddy rice agriculture in a year.
Keywords: Rice paddy, Cropland, Observation frequency, Data availability, Vegetation indices, Sanjiang Plain
1. Introduction
Food security is a growing concern worldwide; more than one billion people lack sufficient food and micronutrients (Barrett, 2010). Rice paddy fields account for over 11% of global cropland area, and produce food for more than half of the world’s population, especially in monsoon Asia (FAOSTAT, 2009). The continuous increase of paddy rice production (Matsumura et al., 2009), which is mainly attributed to the expansion of rice paddy fields, increased cropping intensity, and higher rice yields since the Green Revolution, plays a crucial role in supporting a growing global population in the last fifty years. The world population is projected to keep growing up to 9 billion around 2050, and imposes huge pressure on food security (FAO, 2009). As the major rice-producing region, Asia comprises approximately 90% of the global rice harvest area and production, and residents there obtain over 35% of their daily calories from rice. As rice paddy fields are flooded during most of the growing period, the expansion of rice paddy fields can further exacerbate water shortages, threatening ecosystem sustainability and services (Bouman et al., 2007), especially in Asia, where agriculture irrigation accounts for over 80% of total water use (FAOSTAT, 2009). Rice paddy fields have also been identified as an important source of global atmospheric methane (CH4) (Chen et al., 2013). The warming force of CH4 is approximately 34 times stronger than that of carbon dioxide (CO2) per unit of weight (IPCC, 2013). It has been demonstrated that increased CH4 emissions were associated with rapid expansion of paddy rice agriculture in Northeastern China (Zhang et al., 2012). Additionally, rice paddy fields can facilitate the spread and transmission of the highly pathogenic avian influenza (HPAI, subtype H5N1) virus, as both wild waterfowl and domestic poultry (ducks and chickens) used post-harvested rice fields in their wintering areas (Gilbert et al., 2007, 2008).
It is necessary to map and monitor the spatial distribution and temporal dynamics of rice paddy fields for the studies of food security, water management, climate change, and transmission of avian influenza viruses. Several global and national datasets of rice paddy fields were developed with fairly coarse spatial resolution. Agricultural inventory datasets and land cover products were combined to produce global and national rice paddy field maps at 0.05° and 0.5°, respectively (Frolking et al., 2002; Leff et al., 2004). Compared with agricultural inventory datasets obtained through extensive sample surveys, which are costly and time consuming, remote sensing is highly efficient for monitoring paddy rice agriculture at large scales.
Optical remote sensing data have been widely used to track the phenology (Motohka et al., 2009; Sakamoto et al., 2006), spatial distribution (Shi et al., 2013; Sun et al., 2009; Xiao et al., 2006, 2005), and cropping intensity (Biradar and Xiao, 2011; Peng et al., 2011; Son et al., 2014) of paddy rice at regional and local scales. Many studies have used images from the Moderate Resolution Imaging Spectroradiometer (MODIS) sensors to map rice paddy (Xiao et al., 2005, 2006; Shi et al., 2013). MODIS sensors have daily revisit frequency, but its spatial resolutions (250-m and 500-m) are usually coarser than most of rice paddy field sizes. The mixed land cover types within MODIS pixels may affect the accuracy of land cover maps. Fine spatial resolution images, such as Landsat TM/ETM+ and FORMOSAT-2 images, were also used for rice paddy field mapping (Gao and Liu, 2011; Shiu et al., 2012). One or two images in a year with no cloud cover or a small amount of cloud cover were analyzed through visual interpretation or digital classification methods to map rice paddy (Li et al., 2012; Shiu et al., 2012). Because those issues associated with the long revisit cycle of Landsat (16-day), frequent clouds and cloud shadows, and crop calendar, selection of high-quality images in a year to map croplands is a very challenging task. Satellite images from two or more years are usually collected to map croplands.
Radar remote sensing, not affected by cloud cover, has been also used to map rice paddy, based on the significant backscatter differences between rice paddy fields and other land cover types (Chen and McNairn, 2006; LeToan et al., 1997; Shao et al., 2001). However, radar remote sensing is limited by data availability and the high cost for large-scale mapping of rice paddy (Bouvet and Thuy, 2011; Koppe et al., 2013; Torbick et al., 2011; Wang et al., 2009; Zhang et al., 2009).
Since 1970s the Landsat program has collected millions of images over the world. Landsat 8 images have been available since 2013, and are in an 8-day offset to Landsat 7 images. The combination of Landsat 7 (ETM+) and 8 (OLI) images in time series would increase the data availability for better tracking vegetation phenology and mapping different land cover types (e.g., rice paddy fields). The objectives of this study are (1) to evaluate the potential of Landsat 8 (OLI) and Landsat 7 (ETM+) time series images for mapping rice paddy; and (2) to evaluate the pixel- and phenology-based algorithm for mapping rice paddy in the cold temperate climate zone, where paddy rice is cultivated once a year (single crop cultivation). The resultant simple, robust, and automated algorithm will make it possible for timely mapping paddy rice planting area, using good-quality observations within individual pixels from time series Landsat images at the spatial resolution of 30 m. In this study we choose a pilot study area in Northeastern China (Path/row 114/27). To our knowledge, several studies have carried out to map the distribution of rice paddy fields in Northeastern China; however, these rice paddy fields maps were obtained using either MOD09A1 datasets (Shi et al., 2013) or visual interpretation of Landsat TM/ETM+ images (Gao and Liu, 2011; Zhang et al., 2011).
2. Materials and methods
2.1. Study area
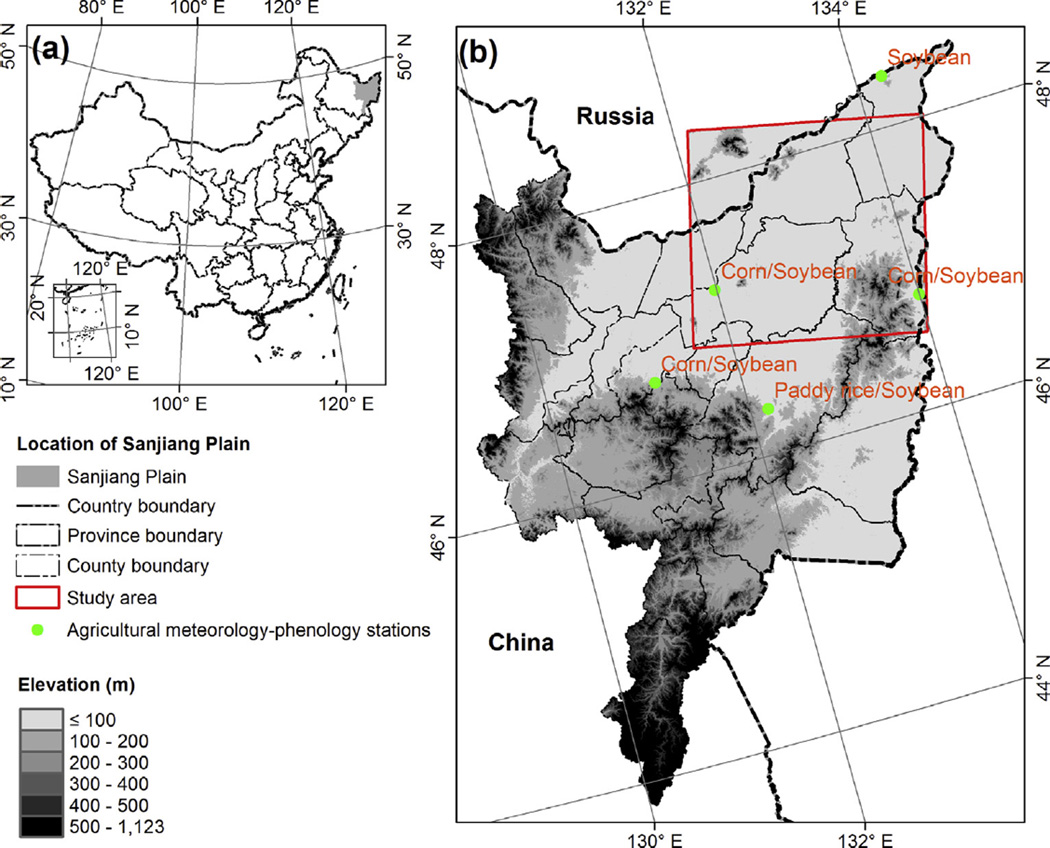
The Sanjiang Plain, located in Northeastern China (Fig. 1), is an alluvial plain and covers an area of ~10.9 × 10⁶ ha. Brown, black, white slurry, meadow, and marsh are the major soil types. The annual mean temperature, precipitation, and sunshine hours are approximately 4.0 °C, 548 mm, and 2431 h, respectively. The temperature is seasonally dynamic with small inter-annual fluctuations. Approximately 80% of the annual precipitation is concentrated in the summer and fall, with high inter-annual fluctuations.
Fig. 1.
The location of the study area in the Sanjiang Plain. The background in (b) is the 30-m Advanced Spaceborne Thermal Emission and Reflection Radiometer (ASTER) Digital Elevation Model (DEM). Each of the agricultural meteorology-phenology station records the cropping calendars of one or two crops (e.g., corn, soybean, rice), and these stations’ data are provided by the China Meteorological Data Sharing Service System. The red rectangle in (b) is the study area covered by Path (114)/Row (27). (For interpretation of the references to colour in this figure legend, the reader is referred to the web version of this article.)
2.2. Temperature-based plant growing seasons and crop calendar
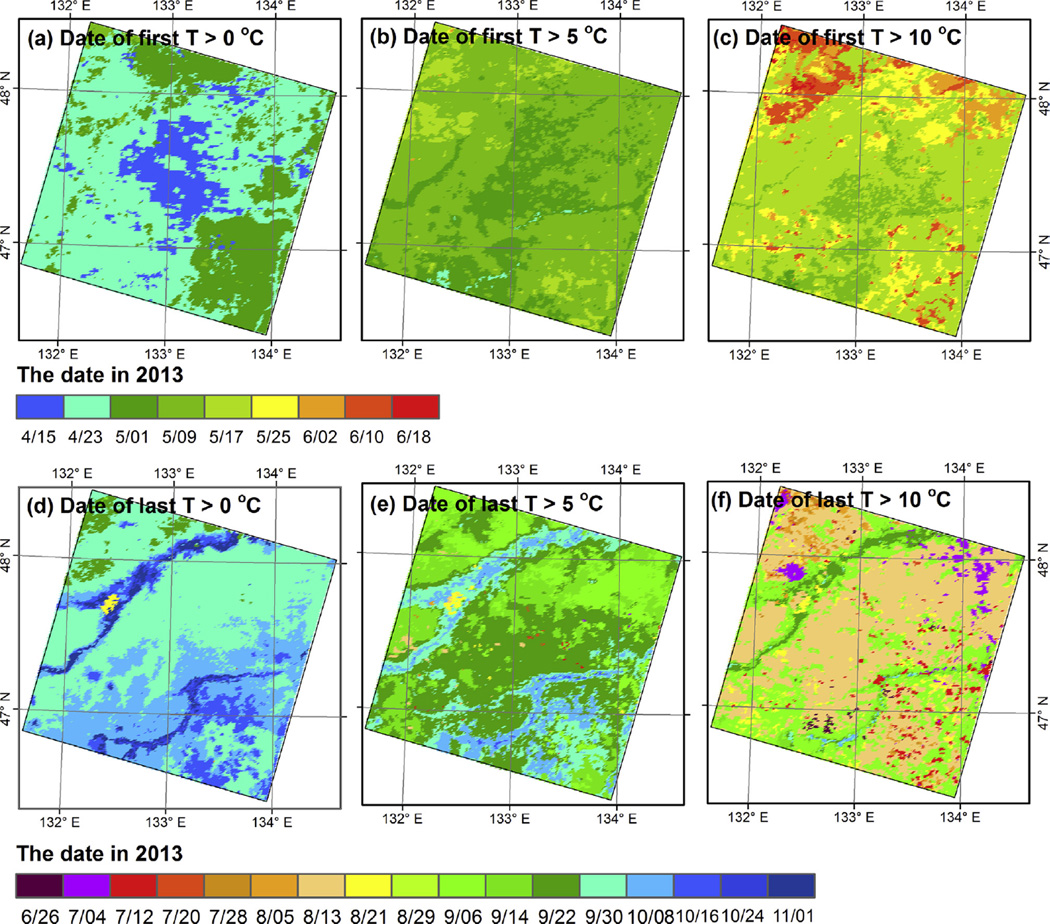
Temperature is one of the important factors that determines the plant growing season and the crop calendar. We downloaded an 8-day Land Surface Temperature data from MYD11A2 at the spatial resolution of 1 km from United States Geological Survey (USGS) in 2013. The plant growing season ranged from 105 to 305 Day of Year (DOY), according to the first date and last date of nighttime Land Surface Temperature (LSTnight) measurements greater than 0 °C (Fig. 2), which agreed well with the observed vegetation phenology (Fig. 3).
Fig. 2.
Spatio-temporal changes of LSTnight derived from MYD11A2 product in 2013, including the first date of LSTnight > 0°C (a), 5 °C (b), and 10 °C (c) in spring, and the last date of LSTnight > 0 °C (d), 5 °C (e) and 10 °C (f) in the fall. The border of the mapped area is based on Landsat scene, i.e., Path (114)/Row (27).
Fig. 3.
Phenology of different land cover types in the Sanjiang Plain, including paddy rice, corn, soybeans, deciduous and evergreen forests (Chen and Pan, 2002; Chen et al., 2001; Zhu et al., 1990), and natural wetlands (Jiang et al., 2009; Zhao et al., 2011). Paddy rice: 1 - Sowing, 2 - Seeding/Flooding, 3 - Transplanting, 4 - Reviving, 5 - Tillering, 6 - Booting, 7 - Heading, 8 - Milk stage, 9 - Mature and 10 - Harvest; Corn: 1 - Sowing, 2 - Seeding/Three leaves, 3 - Seven leaves, 4 - Stem elongation, 5 - Heading, 6 - Milk stage, 7 - Mature and 8 - Harvest; Soybeans: 1 - Sowing, 2 - Seeding, 3 - The 3rd true leaf, 4 - Flowing, 5 - Pod setting, 6 - Mature and 7 - harvest; Deciduous forests: 1 - Tree liquid flow; 2 - Budburst, 3 - leaf unfold, 4 - Total leaf expansion, 5 - Leaf coloration, and 6 - Defoliation; Evergreen forests: 1 - Tree liquid flow, 2 - Budburst, 3 - Bud unfold, 4 - Leaf expansion, 5 - Total leaf expansion, 6 - Leaf coloration and defoliation, 7 - Fruit from ripe to drop, and 8 - Dormancy; Natural wetlands (Deyeuxia angustifolia): 1 - Reviving, 2 - Stem elongation, 3 - Booting, 4 - Heading, 5 - Dough stage, 6 - Mature, and 7 - Defoliate.
The Sanjiang Plain is an important grain production base dominant by single crops, with a few dozen state-owned farms. Paddy rice, corn, and soybeans are the major crops, accounting for approximately 46%, 38%, and 11% of the total crop planting area, respectively (Heilongjiang Statistical Bureau, 2013). Paddy rice has a different cropping calendar from corn and soybeans (Fig. 3). Rice seeds are usually planted in small seedbed nurseries in mid-April, and rice seedling plants are transplanted to paddy fields after one month. Flooding is a key practice of paddy rice agriculture and usually takes place about two weeks before rice transplanting (Xiao et al., 2002a). Rice plant seedlings are transplanted between mid-May and early June. Rice plants are harvested from late September to early October. Corn and soybeans are planted in the field from mid- to late-May and mature at almost the same time as paddy rice. Evergreen forests, deciduous forests, and natural wetlands usually have longer growing seasons than do paddy rice, corn and soybean crops (Fig. 3).
2.3. Landsat ETM+ and OLI images and preprocessing
2.3.1. Landsat ETM+ and OLI images
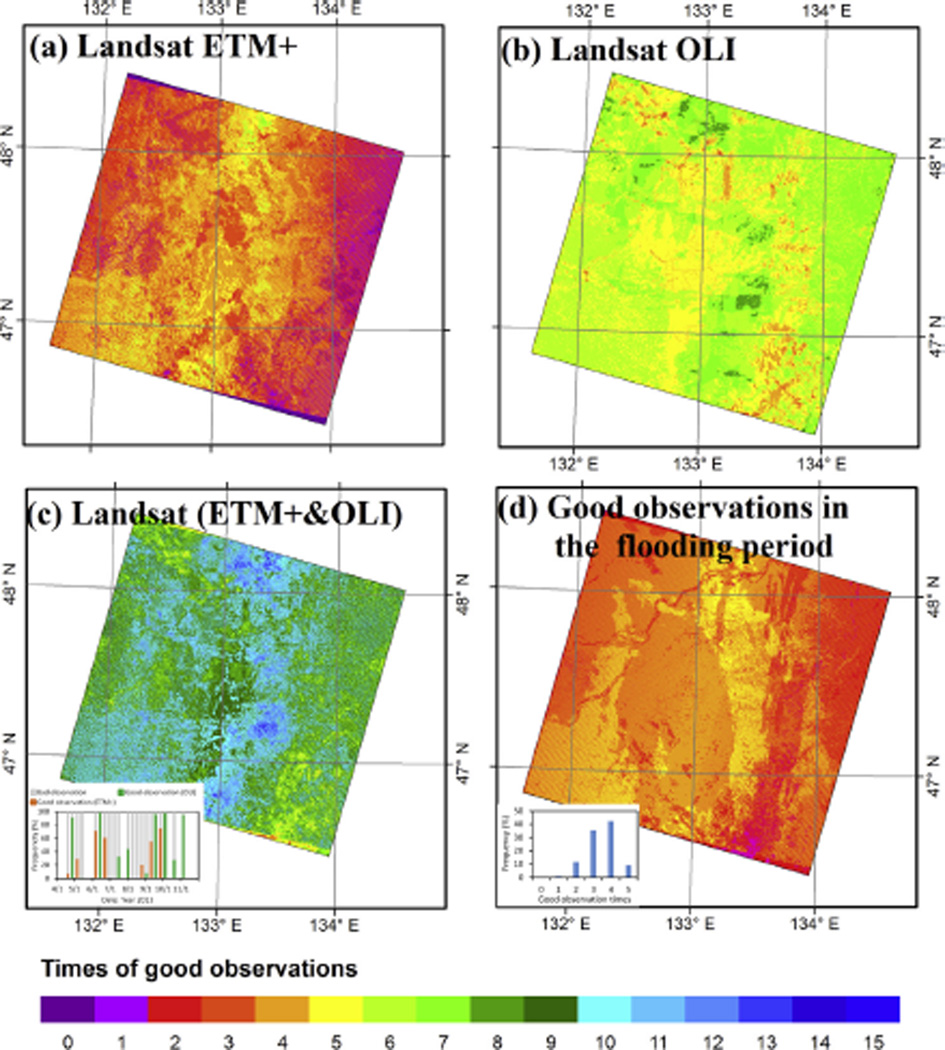
We downloaded all Landsat 7 (ETM+) and Landsat 8 (OLI) images available for the study area from April 19 to November 5, 2013 from USGS EarthExplorer data portal (http://earthexplorer.usgs.gov/), according to the growing season defined by MODIS LSTnight. A total of 21 Landsat images are collected (Fig. 4), including 9 Landsat ETM+ images and 12 Landsat OLI images. All these Landsat ETM+ and OLI images are level 1T data with terrain correction, referenced to the World Reference System-2.
Fig. 4.
Data availability of Landsat ETM+ and OLI images during the growing season in 2013. (a), (b), and (c) are the good observations of individual pixels for Landsat ETM+, OLI, and ETM+ and OLI, respectively; (d) is the good observations of individual pixels for Landsat ETM+ and OLI in the flooding period.
2.3.2. Atmospheric correction
We performed atmospheric corrections for all Landsat ETM+ and OLI images, using the FLAASH model (ITT Visual Information Solutions) in ENVI/IDL image processing software. The digital number values of the Landsat ETM+ and OLI images were first converted to radiance, and then the land surface reflectance was derived using the FLAASH model. We used the Sub-Arctic Summer standard atmospheric model with the rural aerosol model and 2-Band (K-T) for aerosol retrieval. Additionally, the initial scene visibility was assumed using approximate values for atmospheric correction, based on weather conditions, if the aerosol was not retrieved.
2.3.3. Clouds, cloud shadows and SLC-off strips
Clouds and shadows are a significant problem for time series analysis of Landsat imagery, and their detection is an initial step in most analyses. Land surface covered by cloud shadows only receives scattered sunshine and usually has low reflectance, which is similar to the spectral characteristics of water pixels. Two steps were used to identify clouds and cloud shadows. First, we used Fmask software to develop cloud and cloud shadow layers for each of the Landsat ETM+ and OLI images (Zhu and Woodcock, 2012). Second, considering the potential uncertainty (commission error) of the Fmask algorithm, we added LSWI (Land Surface Water Index) > 0 as an additional indicator to double-check the “cloud” pixels. The SLC-off strips in Landsat ETM+ images were identified as “no-observation” through Fmask software. Finally, we calculated good quality observations for each of the Landsat images after excluding the clouds, cloud shadows and SLC-off strips (Fig. 4).
2.3.4. Vegetation indices
For each Landsat image, we calculated the Normalized Difference Vegetation Index (NDVI; Eq. (1)), Enhanced Vegetation Index (EVI; Eq. (2)), LSWI (Eq. (3)), and Normalized Difference Snow Index (NDSI; Eq. (4)), using the land surface reflectance values of the blue (ρblue), green (ρgreen), red (ρred), NIR (ρnir), and SWIR (1570–1650 nm) (ρswir) bands.
| (1) |
| (2) |
| (3) |
| (4) |
2.3.5. Snow and ice covers
Snow and ice cover have high reflectance in the visible spectral bands and can potentially affect the values of vegetation indices, especially for LSWI and EVI. Here, we used the NDSI and reflectance of NIR (NDSI > 0.4 and NIR > 0.11) to generate snow/ice maps for each image (Hall et al., 1995, 2002). Snow and ice pixels were excluded from the data analysis.
2.4. Maps of non-cropland land cover types
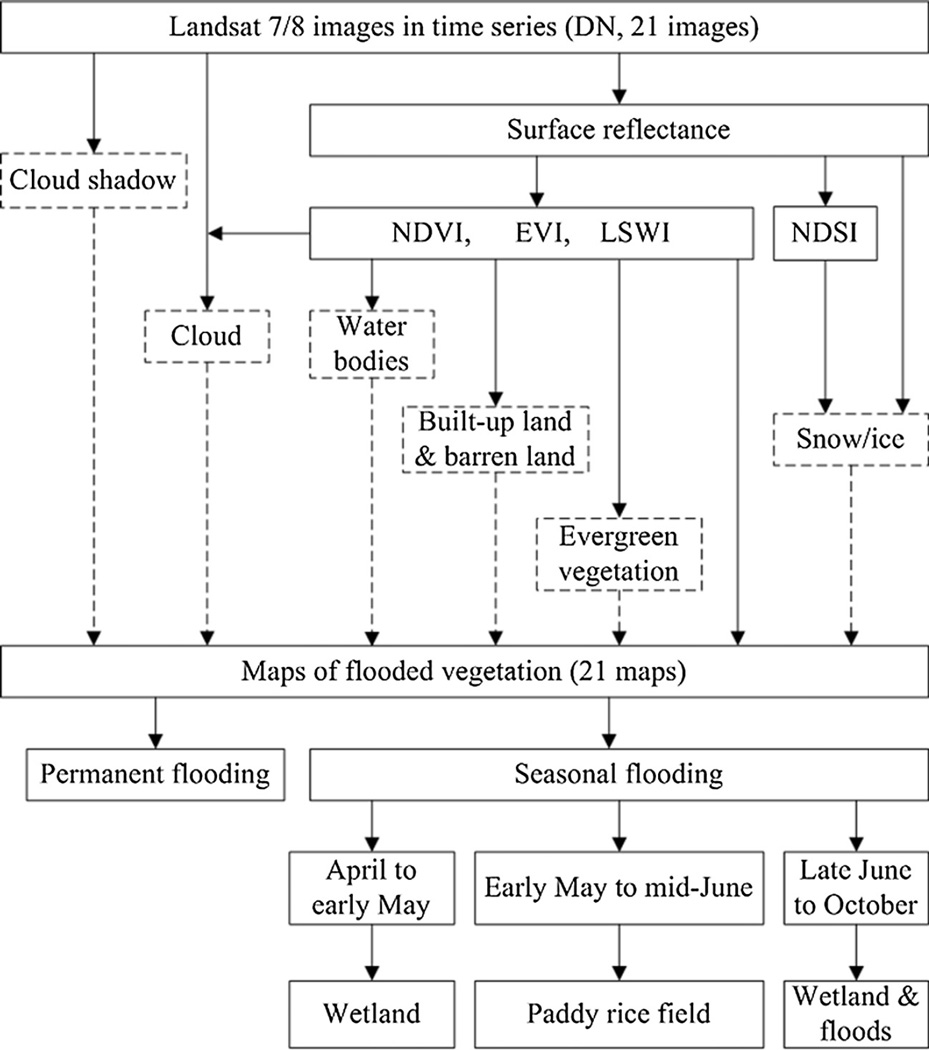
There are several non-cropland land cover types, including water bodies, built-up and barren land, evergreen vegetation, permanently flooded lands with open-canopy, and natural wetlands. We developed a procedure to mask these factors and minimize their potential impacts on the paddy rice planting area map (commission errors) (Figs. 5 and S. 1).
Fig. 5.
A schematic workflow illustrating the algorithm for mapping paddy rice planting area.
The Sanjiang Plain has abundant surface water bodies, such as Amur, Ussuri and Songhua Rivers. Water bodies usually have low NDVI and EVI values and high LSWI values. We extracted water bodies by identifying pixels with NDVI < 0.10 and LSWI > NDVI for each Landsat image (Xiao et al., 2006, 2005). The pixels were labeled as persistent water bodies if these pixels were always identified as water bodies in all good quality observations.
Built-up land and barren land are comprised of a variety of different materials; some of the materials have high reflectance in visible and SWIR bands and are thus characterized by LSWI < 0 (Zha et al., 2003). We counted the number of observations in which a pixel had LSWI < 0 out of all the good quality observations in time series and then divided it by the total number of good quality observations. A pixel with a ratio (frequency) value ⩾90% was then identified as built-up or barren land.
Evergreen vegetation (coniferous forests or shrubs) has green leaves all year long and has LSWI > 0 in all good quality observations (Xiao et al., 2009). Spring and late autumn are two critical periods for identifying evergreen vegetation, but there is no Landsat OLI image available in spring 2013. As an alternative, we used 130 Landsat TM/ETM+ images from 2006–2012 to map the distribution of evergreen vegetation, based on the criteria of LSWI > 0 (Dong et al., 2015). We counted the number of observations in which a pixel had LSWI > 0 out of all the good quality observations in Landsat 5/7 images then divided it by the total number of good quality observations. Pixels with a ratio (frequency) value of >95% were then identified as evergreen vegetation.
It is necessary to distinguish permanently flooded land (pixels) with open-canopy from seasonally flooded land (pixels) with open-canopy (e.g., paddy rice fields). Some pixels along the rivers are mixed with natural vegetation (grass, trees, or shrubs) and water (rivers, lakes, or ponds). The resultant spectral feature of flooded land with open-canopy may persist over the entire plant-growing season. We used the criteria LSWI-EVI ⩾ 0 or LSWI-NDVI ⩾ 0 to identify the flooded/open-canopy pixels for each Landsat image. If a pixel had the flooded/open-canopy signal for all good quality observations within the plant growing season, it was labeled as permanently flooded/open-canopy.
Natural wetlands in the Sanjiang Plain are formed through long-term waterlogging, and the main vegetation type is marsh meadow. Natural wetlands start flooding in early spring when air temperature rises above 0 °C and undergo several weeks of vegetation growth by the time paddy rice fields are flooded and transplanting begins (Fig. 3 and Tables S. 1–4). If a pixel was identified with the flooded/open-canopy signal after the date at which LSTnight > 0 °C and had a NDVI ⩾ 0.6 on the date at which LSTnight ⩾ 5 °C, it was categorized as a natural wetland.
2.5. Algorithm for identifying inundation and rice paddy fields
2.5.1. Physical features of rice paddy fields and mapping algorithm
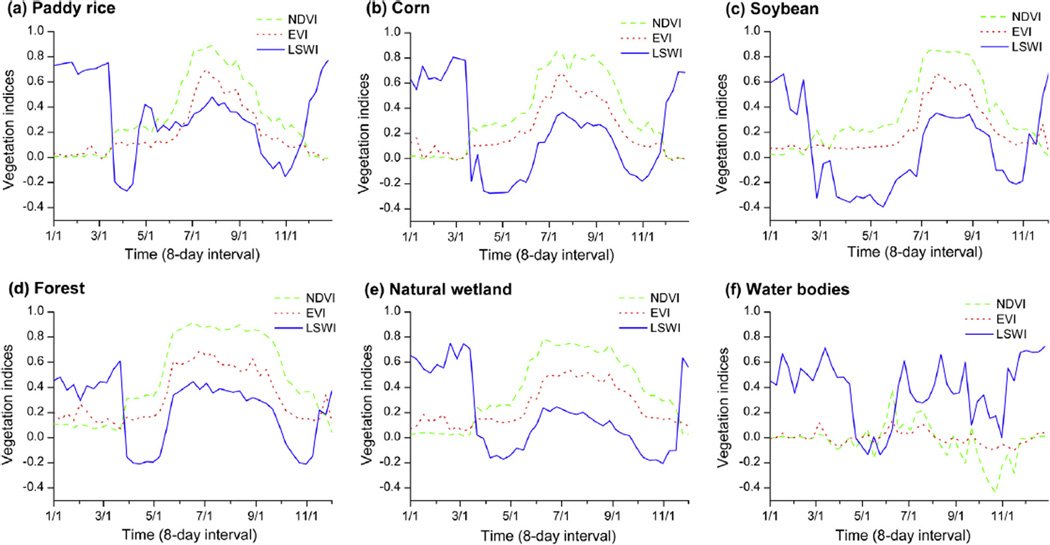
A unique physical feature of rice paddy fields is that rice plants are grown on flooded soils (Xiao et al., 2002a). From the perspective of canopy development, rice paddy fields can be described in terms of the (1) flooding phase (from the date of initial flooding to the date of rice transplanting, only water can be seen), (2) flooded/open-canopy phase (from the date of rice transplanting to the date of rice canopy closure, a mixture of water and rice plants), (3) closed canopy phase (only rice plant canopy can be seen; water is under the canopy and cannot be seen by sensors above the canopy), and (4) post-harvest phase (bare soils and rice plant residue). During the flooded/open-canopy period, rice paddy fields are a mixture of water and green rice plants, and LSWI values are larger than NDVI or EVI values (i.e., LSWI-NDVI ⩾ 0 or LSWI-EVI ⩾ 0) (Fig. 6a). After rice seedling transplanting, NDVI and EVI of the rice paddy fields increase and LSWI declines gradually. Approximately 50–60 days after transplanting, most of the rice paddy fields are fully covered by rice canopy, and LSWI values are lower than those of NDVI or EVI (i.e., LSWI-NDVI < 0 or LSWI-EVI < 0). It is important to note that other land cover types always have lower LSWI values than EVI or NDVI (i.e., LSWI-NDVI < 0 or LSWI-EVI < 0) throughout the entire plant-growing season (Fig. 6). The unique spectral feature during the flooded/ open-canopy period (i.e., LSWI-EVI ⩾ 0 or LSWI-NDVI ⩾ 0) serves as the spectral signal detection in the analysis of time series satellite images such as MODIS (Xiao et al., 2006, 2005).
Fig. 6.
The seasonal dynamics of NDVI, EVI and LSWI for the major land use types at selected sites, extracted from MOD09A1 product. (a) Paddy rice, (b) corn, (c) soybean, (d) forest, (e) natural wetland, and (f) water bodies, all sites were selected from the geo-referenced field photos taken in the Sanjiang Plain.
2.5.2. Landsat-based algorithm for paddy rice planting area mapping
With the time series Landsat ETM+ and OLI imagery, we also used the unique physical features of rice paddy fields as the basis for paddy rice planting area mapping. We selected Landsat images within the appropriate time period to map flooded/open-canopy pixels, using LSTnight-defined crop calendar. After LSTnight ⩾ 5 °C, snow and ice have melted in the fields, natural vegetation begins to grow quickly, and rice paddy fields are flooded (Fig. 2). We selected Landsat images within a time window from the first date of LSTnight ⩾ 5 °C in spring through the next 50 days before the rice paddy fields grew into a full and closed canopy (Xiao et al., 2002b).
2.6. Field survey data
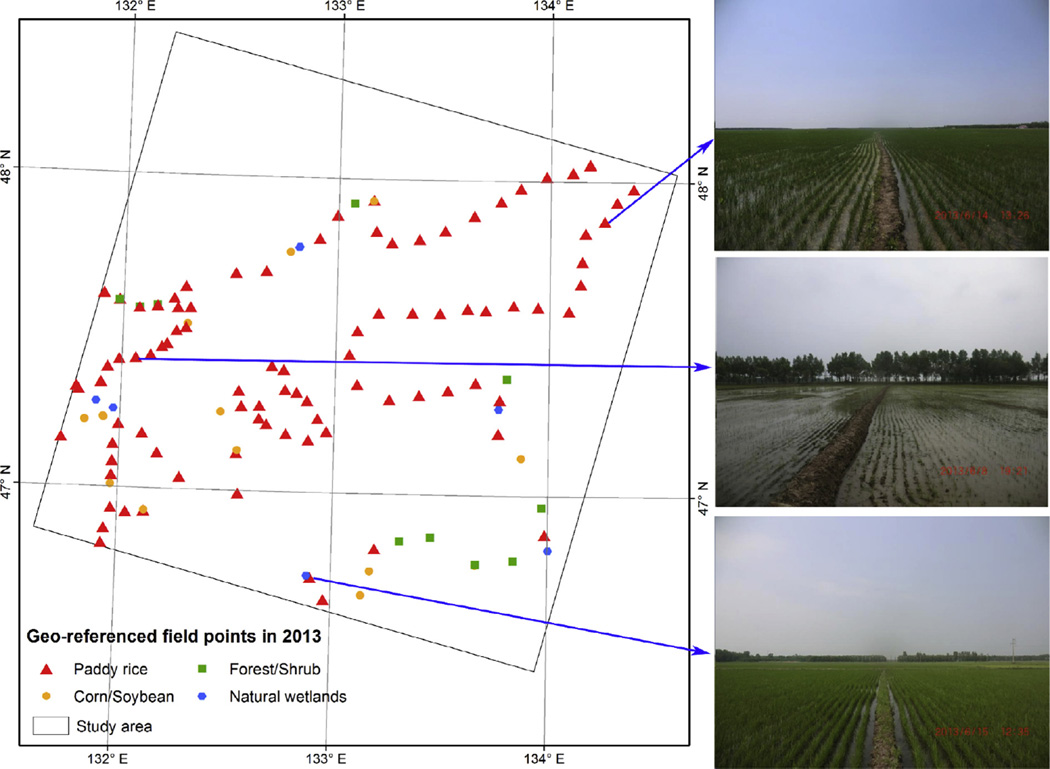
To assess the accuracy of the paddy rice planting area map, we conducted an extensive field survey in the Sanjiang Plain during the flooded/open-canopy period in 2013. We designed detailed field survey routes based on the major land use and land cover (LULC) types as shown in high spatial resolution Google Earth images from recent years and county road maps. We traveled along the designed routes taking geo-referenced photos at random field points using digital cameras. Photos were taken inside fields at a distance of 60 m or more away from the roads. Most of the field points were taken in areas of uniform LULC type that were longer than 60 m in each direction. At each point, photos were taken in at least five directions (east, south, west, north, and downwards), so the surrounding LULC conditions could be clearly identified. Along the field survey routes, adjacent points had a distance of approximately 8 km between them. A total of 1643 photos at 123 points were taken in the study area from June 5th to the 18th, 2013, including 1268 photos (92 points) for paddy rice, 183 photos (14 points) for upland crops (corn or soybeans), 109 photos (10 points) for forests and shrubs, and 83 photos (7 points) for water bodies and natural wetlands (Fig. 7). All photos are stored and managed in the Global Geo-referenced Field Photo Library (http://www.eomf.ou.edu/photos/), a global data portal that is open to the public and researchers (Xiao et al., 2011).
Fig. 7.
Spatial distribution of geo-referenced field survey sites in the study area.
2.7. Accuracy assessment
We converted the geo-referenced field photos into the points of interest (POIs) in kmz format that can be displayed in Google Earth. Then we used vector (polygon) patches drawn around or near the POIs which had the same land cover types as determined by referencing field photos and high spatial resolution images from Google Earth. 266 areas of interest (AOIs) (89,537 pixels) were generated and used for the accuracy assessment of the paddy rice planting area map. The high spatial resolution images were taken primarily during the paddy rice flooded/open-canopy period in 2012/2013. To get pure AOIs, the borders of all the AOIs maintained a distance of over 30 m from other land cover types.
2.8. Comparison with other available datasets of rice paddy fields
To further assess our paddy rice planting area map, we compared our results with the 2010 NLCD dataset, and the agricultural statistics of state farms from 2012. The 1-km NLCD dataset was produced mainly based on Landsat TM/ETM+ images (Zhang et al., 2014). First, the selected Landsat TM/ETM+ images were geo-referenced using ground control points on 1:50,000 relief maps, and the Root Mean Squared Error was less than 45 m. Then, vector patches of different LULC types were interpreted by computer-aided interactive procedures of visual interpretation and on-screen digitization. The resultant 1:100,000 vector data were intersected with a fishnet of 1-km × 1-km grid cells, and the area percentages of different LULC types were calculated and assigned to each cell. Finally, the vector data were converted to raster data. The NLCD dataset has six primary LULC types and 25 sub-types, including paddy land as one sub-type. Thousands of geo-referenced field photos were used to evaluate and verify the high accuracy of the NLCD dataset. The state farms have the same administrative level with counties and are the major units for agricultural activities in the Sanjian Plain. These state farms are located in or fall within different counties. Paddy rice planting area datasets were collected from state farms.
3. Results
3.1. Spectral signatures of flooded/open-canopy pixels and other land cover types
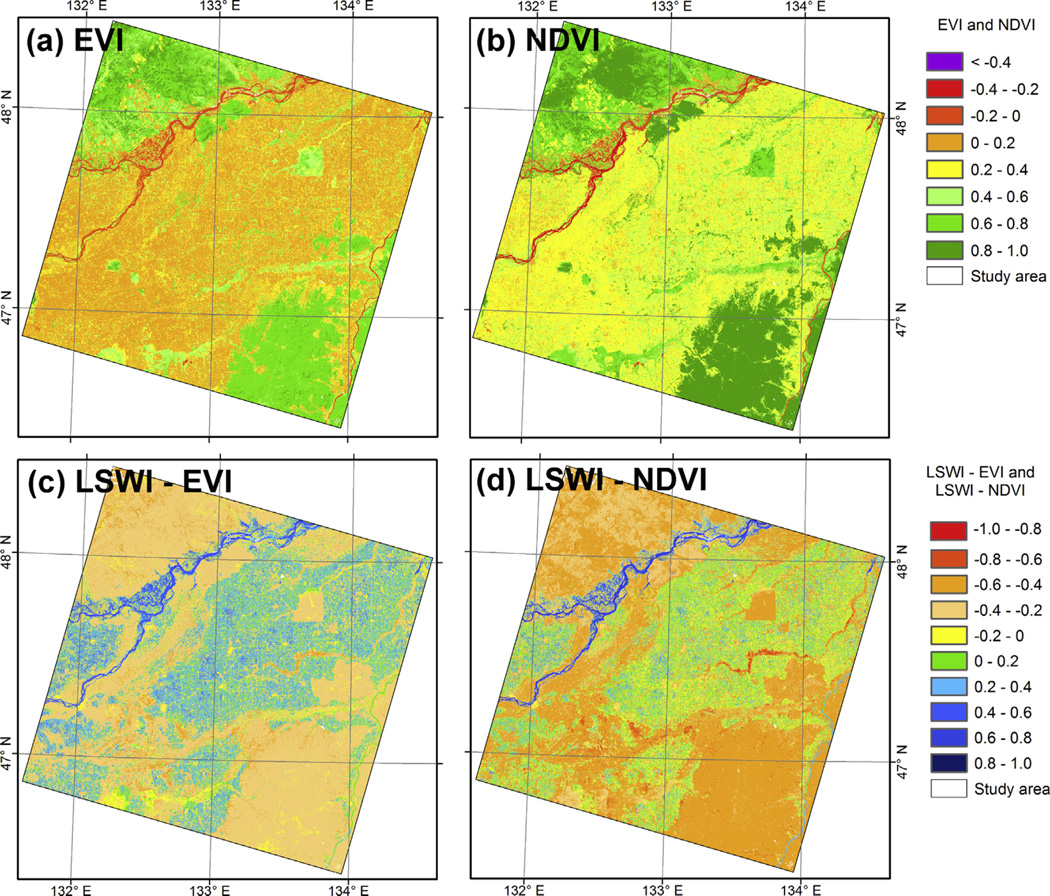
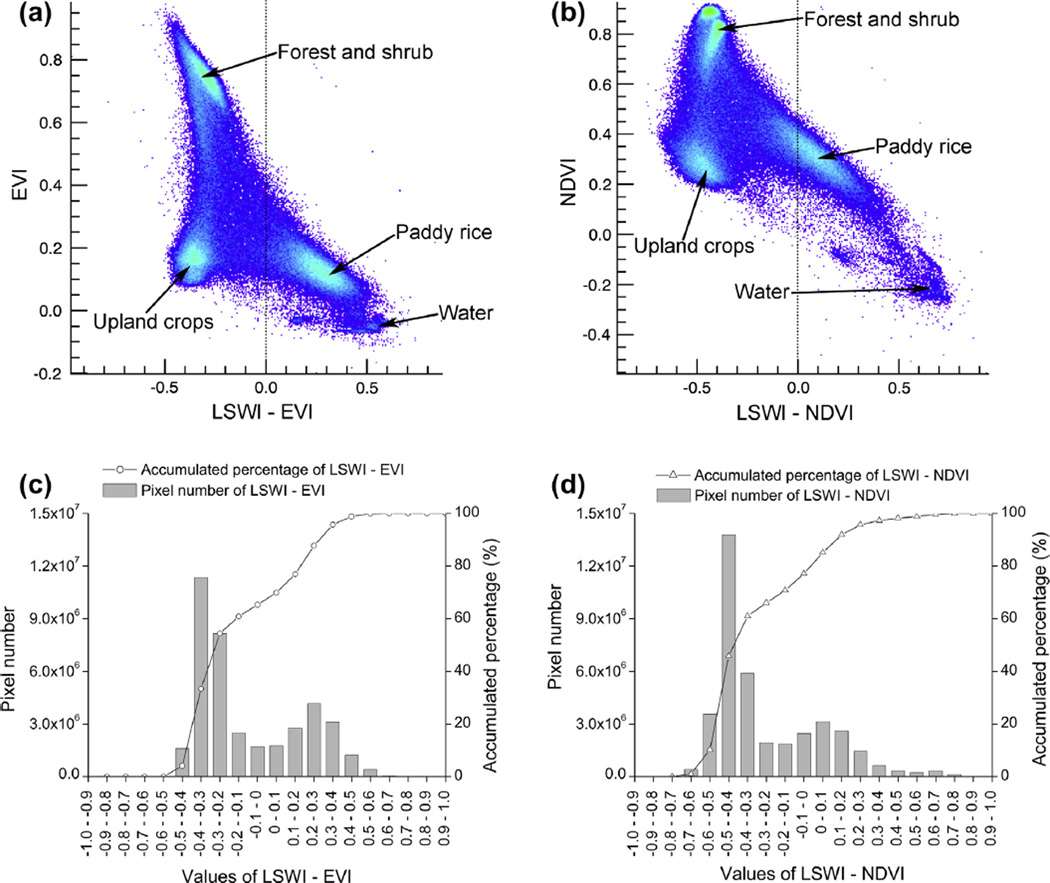
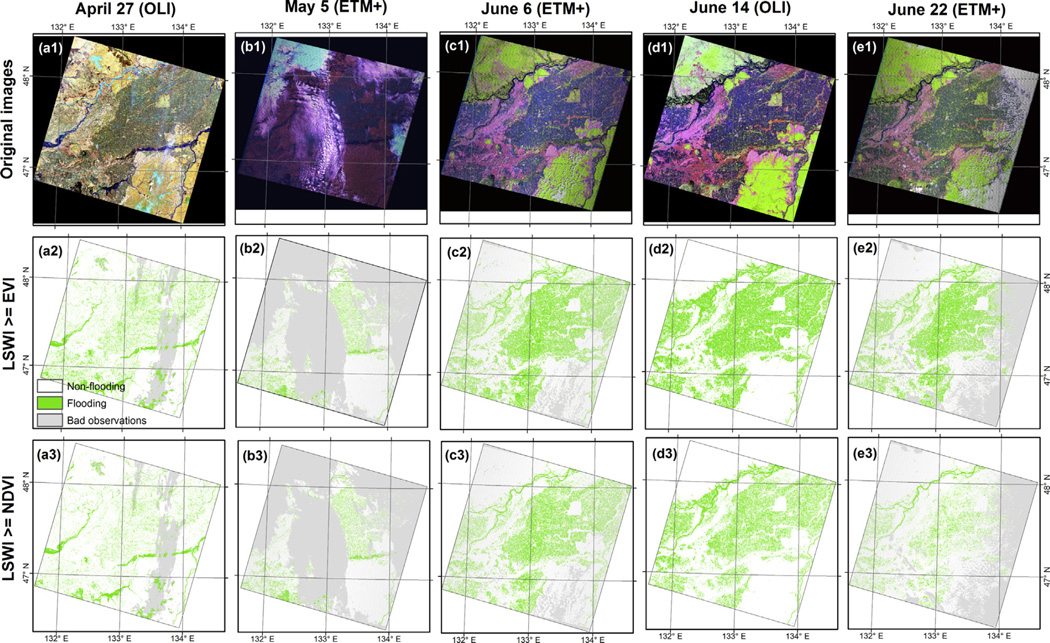
As an example, Fig. 8 shows the spatial distribution of EVI, NDVI, LSWI-EVI, and LSWI-NDVI values on June 14, 2013. Most rice paddy fields were not fully covered by plant canopies, and the flooded/open-canopy signals were clearly identifiable. The major land cover types presented quite distinguishable characteristics (Fig. 9a and b). The rice paddy fields had flooded/ open-canopy signals and low EVI (0–0.2) and NDVI (0.2–0.4) values. Water bodies also had flooding signals but with negative EVI and NDVI values. Upland croplands, which were mostly covered by soil, had low EVI and NDVI values and non-flooding signals. Forests and shrubs had high EVI and NDVI values and non-flooding signals. About 1.4 × 10⁷ flooded/open-canopy pixels (34.7% of the study area) were identified by the LSWI-EVI ⩾ 0 decision rule, which were much more than those (8.9 × 106 pixels, 22.9%) identified by LSWI-NDVI ⩾ 0 (Fig. 9c and d).
Fig. 8.
Spatial distributions of EVI (a), NDVI (b), LSWI-EVI (c), and LSWI-NDVI (d) derived from the Landsat OLI image on July 14, 2013.
Fig. 9.
2-D scatter plots of vegetation indices and the difference between two vegetation indices from the Landsat OLI image on July 14, 2013: (a) LSWI-EVI and EVI, (b) LSWI-NDVI and NDVI, and the frequency distribution (pixel number) of (c) LSWI-EVI and (d) LSWI-NDVI. Color density represents numbers of pixels. (For interpretation of the references to colour in this figure legend, the reader is referred to the web version of this article.)
3.2. Spatio-temporal dynamics of flooded/open-canopy pixels
The amount of flooded/open-canopy pixels, identified either by LSWI-EVI ⩾ 0 or by LSWI-NDVI ⩾ 0, increased first and then decreased (Fig. 10). On April 27th and May 5th, LSTnight began to rise above 0 °C and lower than 10 °C (Fig. 2), and the snow and ice melted gradually. Some farmers began to flood rice paddy fields and prepare the land for transplanting rice plants. On June 6th and 14th, the area of flooded/open-canopy pixels expanded substantially, as most rice plants had been transplanted to the fields, which were still not fully covered by plant canopies. On June 22th, paddy rice plants had obvious canopy growth but some of the rice paddy fields were identified with flooded/open-canopy signals. The flooded/open-canopy pixels were considered to be the potential paddy rice planting area.
Fig. 10.
Spatio-temporal dynamics of flooded/open canopy for rice paddy fields identified from Landsat ETM+ and OLI images on April 27, May 5, June 6, June 14, and June 22 in 2013, respectively. Landsat images are false composite displayed with red (SWIR), green (NIR) and blue (red). (For interpretation of the references to colour in this figure legend, the reader is referred to the web version of this article.)
3.3. Maps of the paddy rice planting area
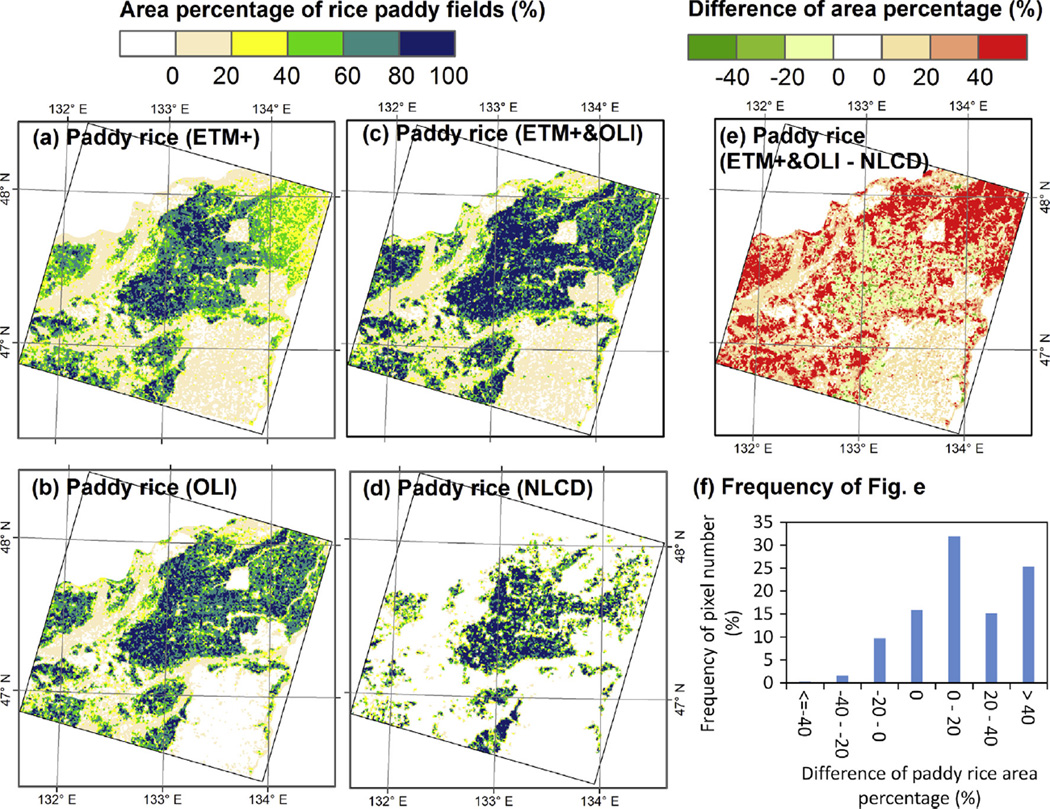
We generated three maps of the paddy rice planting area at 30-m spatial resolution, using (1) Landsat ETM+, (2) OLI, and (3) both ETM+ and OLI images, respectively, after the application of the above-mentioned masks (see Section 2.3). Most of the rice paddy fields were distributed at low elevations with flat terrain from the northeast to the southwest, and few were distributed in the low mountainous area (Fig. 11a-c). The paddy rice planting areas of state farms estimated from only Landsat ETM+ and OLI images were about 81.0% and 90.9% of that (75.79 × 10⁴ ha) estimated by both Landsat ETM+ and OLI images. Limited by data availability, data quality, and the spatial variability of cultivation time, Landsat ETM+ and OLI would miss some rice paddy fields; however, the combination of Landsat ETM+ and OLI can provide full coverage, as more data is available.
Fig. 11.
Spatial distributions of rice paddy fields estimated by Landsat ETM+ (a), OLI (b), ETM+ and OLI (c) in 2013, NLCD (d) in 2010, and the spatial difference of c-d (e), respectively within a 1-km grid cell. (f) is the frequency of pixel number of (e).
3.4. Accuracy assessment of the paddy rice planting area map
The AOIs were divided into two classes (rice paddy fields and non-rice paddy fields) and used to assess the accuracy of the resultant paddy rice planting area maps through the confusion matrixes (Tables 1–3). The paddy rice planting area maps estimated by Landsat OLI, and ETM+ and OLI have similar and high Kappa coefficients and accuracies, while the paddy rice planting area map estimated by Landsat ETM+ has lower Kappa coefficient (0.75) and overall accuracy (88.7%), and lower producer accuracy (72.8%) for rice paddy fields and user accuracy (85.5%) for non-rice paddy fields.
Table 1.
The confusion matrix between the Landsat (ETM+)-based paddy rice planting area map and areas of interest (AOIs).
| Class | Ground truth samples (pixels) |
Total classified pixels | User accuracy (%) | Commission error (%) | ||
|---|---|---|---|---|---|---|
| Paddy rice | Others | |||||
| Classification | Paddy rice | 24,787 | 868 | 25,655 | 96.62 | 3.38 |
| Others | 9279 | 54,603 | 63,882 | 85.47 | 14.53 | |
| Total ground truth pixels | 34,066 | 55,471 | 89,537 | |||
| Producer accuracy (%) | 72.76 | 98.44 | ||||
| Omission error (%) | 27.24 | 1.56 | ||||
| Overall accuracy (%) | 88.67 | Kappa coefficient = 0.75 | ||||
Table 3.
The confusion matrix between the Landsat ETM+ and OLI-based paddy rice planting area map and areas of interest (AOIs).
| Class | Ground truth samples (pixels) |
Total classified pixels | User accuracy (%) | Commission error (%) | ||
|---|---|---|---|---|---|---|
| Paddy rice | Others | |||||
| Classification | Paddy rice | 32,626 | 958 | 33,584 | 97.15 | 2.85 |
| Others | 1440 | 54,513 | 55,953 | 97.43 | 2.57 | |
| Total ground truth pixels | 34,066 | 55,471 | 89,537 | |||
| Producer accuracy (%) | 95.77 | 98.27 | ||||
| Omission error (%) | 4.23 | 1.73 | ||||
| Overall accuracy (%) | 97.32 | Kappa coefficient = 0.94 | ||||
3.5. Comparison to other available rice paddy field datasets
These 30-m paddy rice planting area maps were aggregated into a 1-km spatial resolution grid cell (Fig. 11a - c), and compared with the spatial distribution of the paddy land in the NLCD dataset (Fig. 11e and f). Although these two rice paddy field datasets were produced using different methods and images in different years, there was reasonable agreement on the spatial distribution of rice paddy fields. About 57.60% of pixels have a ±20% area percentage deviation of rice paddy fields. About 40.45% of pixels have 20% or even more rice paddy fields than that of the NLCD dataset, mainly in the northeast and the southwest. We analyzed high spatial resolution images in Google Earth and WorldView images at 0.5-m spatial resolution from 2012 to 2013, and a large area of the rice paddy fields was found in the increased paddy rice planting areas through the shape and texture features, which confirmed the accuracy of our Landsat-based map.
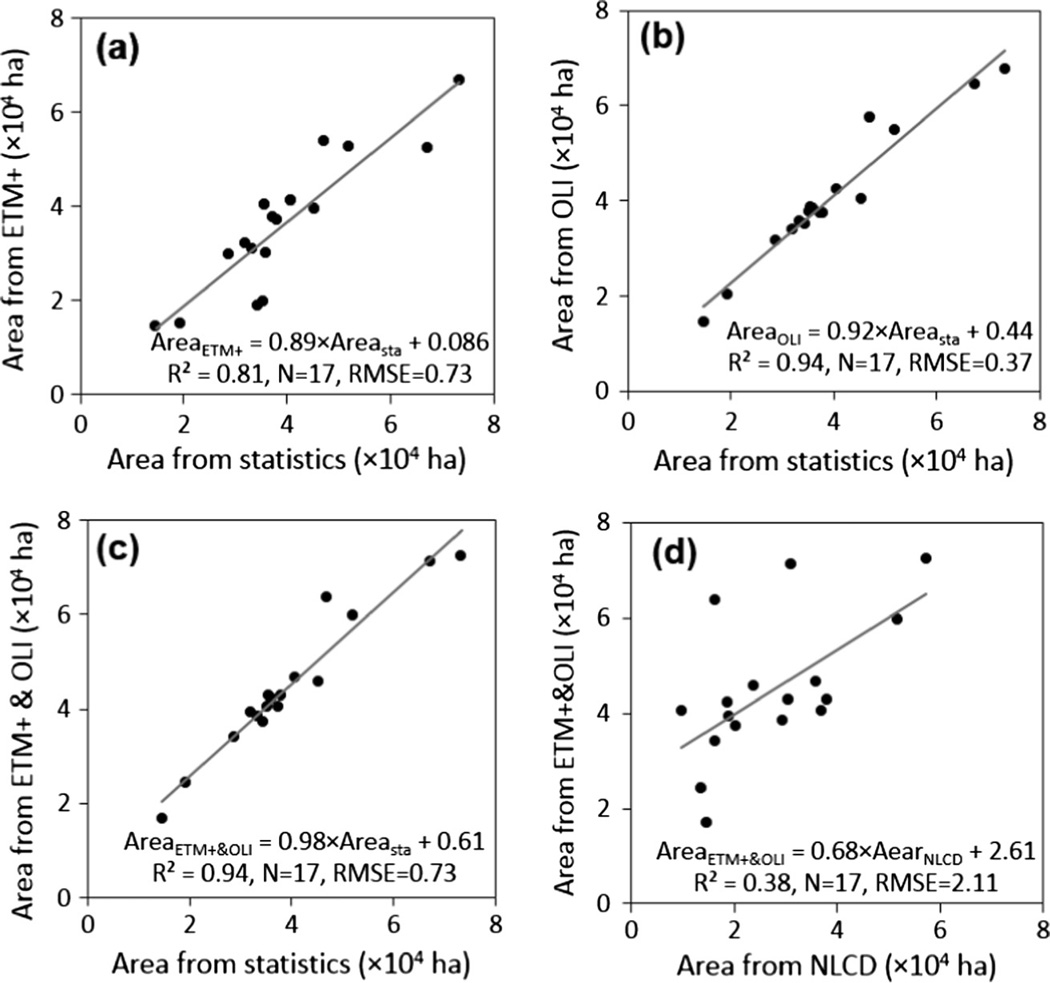
At the level of the state farms, we compared the paddy rice planting areas identified by Landsat ETM+, OLI, and ETM+ and OLI images with the agricultural statistical datasets and NLCD dataset (Fig. 12; Table 4). The results showed that these paddy rice planting areas had significant linear relationships with agricultural statistical datasets and NLCD dataset, indicating our mapping results were reasonable.
Fig. 12.
A comparison of paddy rice planting area estimates between Landsat ETM+, OLI, and ETM+ and OLI, NLCD, and official statistics in 17 state farms.
Table 4.
A comparison of paddy rice planting area (×104 ha) at the levels of state farm among ETM+-, OLI-, and combined ETM+ and OLI-based paddy rice planting area maps, NLCD dataset, and official statistics.
| State farms | ETM+ | OLI | ETM+ and OLI | NLCD | Statistics |
|---|---|---|---|---|---|
| Qixing | 6.70 | 6.77 | 7.25 | 5.74 | 7.33 |
| Two nine zero | 3.01 | 3.83 | 4.21 | 1.88 | 3.60 |
| Erdaohe | 1.91 | 3.52 | 3.74 | 2.03 | 3.43 |
| Chuangye | 3.78 | 3.74 | 4.05 | 3.70 | 3.73 |
| Qianshao | 1.99 | 3.78 | 4.04 | 0.98 | 3.53 |
| Qianjin | 5.29 | 5.49 | 5.97 | 5.17 | 5.20 |
| Qianfeng | 5.26 | 6.45 | 7.11 | 3.11 | 6.73 |
| Qindeli | 5.40 | 5.76 | 6.37 | 1.64 | 4.70 |
| Daxing | 3.96 | 4.05 | 4.57 | 2.39 | 4.53 |
| Honghe | 4.12 | 4.25 | 4.65 | 3.60 | 4.07 |
| Nongjiang | 4.03 | 3.88 | 4.27 | 3.06 | 3.55 |
| Hongwei | 3.71 | 3.74 | 4.28 | 3.80 | 3.80 |
| Hongqiling | 1.44 | 1.46 | 1.68 | 1.48 | 1.47 |
| Shengli | 3.23 | 3.39 | 3.93 | 1.90 | 3.20 |
| Qinglongshan | 3.10 | 3.57 | 3.84 | 2.96 | 3.33 |
| Raohe | 1.52 | 2.04 | 2.42 | 1.36 | 1.93 |
| Yalvjiang | 2.99 | 3.15 | 3.41 | 1.63 | 2.87 |
| Total area | 61.43 | 68.87 | 75.79 | 46.43 | 67.03 |
4. Discussion
4.1. The combination of Landsat ETM+ and OLI images
Availability of good-quality data is essential for regional land use/cover mapping through the phenology analysis. However, optical satellite images are often limited by bad observations (clouds, cloud shadows, and SLC-off strips, etc.) or missing data, which would affect the accuracy and stability of the algorithms. The potential paddy rice planting area map can be well generated using all the good observations of individual pixels from Landsat ETM+ and OLI images in the flooded/open-canopy period. The bad observation pixels caused by clouds, cloud shadows, and SLC-off strips in one image were filled by other images. It was estimated that over 98.8% pixels had two or more good observations in the flooding period (Fig. 4d). The combination of Landsat ETM+ and OLI images increases the good observation frequency (Fig. 4), which indicates more chance to track the phenology of paddy rice.
4.2. Algorithm comparison
Algorithms used to map croplands in previous studies (Friedl et al., 2010; Liu et al., 2005; Pittman et al., 2010; Shao et al., 2010; Zhong et al., 2014) with optical images can be categorized into three groups. The first group uses individual cloud-free images for statistical calculation and then uses unsupervised (e.g., ISODATA), supervised algorithms (e.g., maximum likelihood), or visual interpretation and digitalization to map croplands, including paddy rice fields (Liu et al., 2014; Pan et al., 2010; Shiu et al., 2012). The second group used multiple images for statistical calculation and supervised algorithms for cropland mapping (Friedl et al., 2010). The third group uses time series data for individual pixels and develops phenology-based algorithms to map paddy rice fields (Bridhikitti and Overcamp, 2012; Peng et al., 2011; Xiao et al., 2006, 2005). Given the influence of spectral heterogeneity, training sample selection, post-classification processing, and the abilities and experiences of interpreters, the first two groups of image-based algorithms often produce maps that are difficult to compare across different years, regions, and research groups. In comparison, the pixel- and phenology-based algorithms in the third group are less impacted by these problems. The phenology-based algorithm can track the growing profiles of different crops or vegetation and explore the unique signals of selective targets according to their differences in cropping calendar or management activities (Zhong et al., 2014, 2011). Higher observation frequency of images indicates more detailed growing profiles, which would increase the identification capability of targeted land covers. In this study, the unique flooding signals of rice paddy fields were investigated through the comprehensive analysis of the 8-day Landsat NDVI, EVI, and LSWI datasets.
4.3. Potential sources of uncertainty in the pixel- and phenology-based algorithms
Several factors can potentially affect the regional mapping of rice paddy fields from Landsat ETM+ and OLI images. The first factor is the availability of Landsat imagery. Due to instrument acquisition plan, five Landsat 7 and Landsat 8 images are missing in the growing season of 2013 (Fig. 4c), which result in a loss of good-quality observations for rice paddy field mapping. The second factor is image quality affected by clouds, cloud shadows, and SLC-off strips. It is estimated that approximately 50% of the land pixels are contaminated with clouds, cloud shadows, and SLC-off strips (Fig. 4c), which would further reduce the good quality observations. Clouds can be identified with high accuracy, but the identification of cloud shadows often has a relatively low accuracy (Zhu and Woodcock, 2012). Cloud shadow pixels often meet the threshold of LSWI-EVI > 0 and can potentially affect rice paddy field mapping. The third factor is the effect of mixed pixels of rice paddy fields and non-rice paddy fields (roads, agro-forests, etc.) at a 30-m spatial resolution, especially for the early flooded/open-canopy period. The fourth factor is inundation of land surface due to extreme precipitation event. In the late spring and early summer of 2013, heavy rainfall (400–730 mm) resulted in extensive flooding, which usually happens once in fifty to one hundred years.
4.4. Significance and implications
In the past, optical remote sensing images (e.g., Landsat TM/ ETM+)at a spatial resolution of a few tens of meters were only avail-able at a high price, making large-scale LULC mapping projects quite costly. The rice paddy field maps were mainly derived from individual cloud-free images using image-based algorithms. In this study, all the pixels in a time series of Landsat images, and a pixel- and phenology-based algorithm were used to produce a highly accurate rice paddy field map, demonstrating their potential for rice paddy field mapping. MODIS-based LSTnight images were quite helpful in defining the plant-growing season and selecting Landsat images for the rice paddy field mapping. This procedure of integrating time series MODIS and Landsat images has the potential to be extended to the similar climate regions without cropping calendar records. The application of this algorithm to other climate regions where paddy rice can be cultivated more than once (double- or triple cropping) should be carefully considered. Landsat TM/ETM+/OLI imagery and the automated algorithm can provide inter-annual paddy rice planting area maps at higher spatial resolution than those generated by MODIS datasets after 2000, especially in those regions of highly fragmented landscapes and agricultural land use.
In addition to Landsat ETM+ and OLI, a few optical sensors with similar spatial resolutions are or will be in operation, for example, Landsat TM, FORMOSAT-2, SPOT HRB/HRVIR, and Sentinel-2A/B. Data availability will be greatly improved when Sentinel-2 imagery becomes available in the near future, which has a 5-day revisit frequency. An increase in good quality observations could further increase the efficiency and stability of the algorithm for mapping rice paddy fields, and decrease the uncertainties of the resultant maps.
This 30-m rice paddy field map is more detailed and spatially resolved than the NLCD datasets at 1:100,000 scale (Liu et al., 2014; Zhang et al., 2014). The comparison between the NLCD and our mapping result shows those areas where rice paddy fields remain unchanged from 2010 to 2013, and where rice paddy fields differ (increase or decrease) too. Areas experienced a reduction in rice paddy fields can be attributed to either the commission error associated with the visual interpretation of Landsat images in the NLCD dataset or the expansion of built-up lands. Areas with an increase of rice paddy fields are mainly attributed to the expansion of rice paddy fields. The loss of rice paddy fields occur mostly around the built-up lands and they usually are good quality croplands. The expansion of rice paddy fields largely occur through conversion from upland croplands, driven by the comprehensive effects of economic interests, improved irrigation facilities, and national agricultural policies (Liu et al., 2014). Some of the newly converted rice paddy fields could be easily degraded into marginal and low-quality land, due to poor natural conditions and inappropriate agricultural management (Liu et al., 2005; Yan et al., 2009), and much attention is needed for their quality and sustainability.
5. Conclusions
A pixel- and phenology-based algorithm for mapping rice paddy fields has been developed, based on the unique spectral feature in the flooded/open-canopy period and Landsat ETM+/OLI images during the thermal growing season defined by MODIS LSTnight. All the pixels from 8-day Landsat images are used, and a high accuracy and updated paddy rice planting area map at the spatial resolution of 30 m is generated. Compared with rice paddy field maps based on coarse spatial resolution images such as MODIS, the effects of mixed pixels can be greatly decreased in this Landsat-based study. Compared with paddy rice field maps based on fine spatial resolution images and image-based algorithms, higher efficiency can be achieved in the algorithms reported in this study. The planting areas retrieved from the paddy rice planting area map have a strong linear relationship with the official statistics for the state farms. In addition, the 30-m rice paddy field map can provide the spatial distribution of rice paddy fields in detail.
Although this algorithm is tested in the Sanjiang plain, one of the emerging major rice production region in China, the algorithm should be applicable in the similar climate regions, as the obvious flooding signals occur in the flooded/open-canopy period for rice paddy fields. Data availability is the primary factor limiting the accuracy and stability for rice paddy field mapping. Multi-source satellite images with similar spatial resolution can be combined to increase observation frequency in the near future. The algorithm developed in this study is a very promising tool for rice paddy field mapping in cold temperate region, and further studies are needed in other climate zones.
Supplementary Material
Table 2.
The confusion matrix between the Landsat OLI-based paddy rice planting area map and areas of interest (AOIs).
| Class | Ground truth samples (pixels) |
Total classified pixels | User accuracy (%) | Commission error (%) | ||
|---|---|---|---|---|---|---|
| Paddy rice | Others | |||||
| Classification | Paddy rice | 31,740 | 124 | 31,864 | 99.61 | 0.39 |
| Others | 2326 | 55,347 | 57,673 | 95.96 | 4.04 | |
| Total ground truth pixels | 34,066 | 55,471 | 89,537 | |||
| Producer accuracy (%) | 93.16 | 99.78 | ||||
| Omission error (%) | 6.84 | 0.22 | ||||
| Overall accuracy (%) | 97.26 | Kappa coefficient = 0.94 | ||||
Acknowledgments
This study was supported by the research grants from the National Aeronautics and Space Administration (NASA) Land Cover and Land Use Change program (NNX11AJ35G, NNX14AD78G), the US National Science Foundation (NSF) EPSCoR program (IIA-1301789), and the National Institutes of Health (NIH) (1R01AI101028-01A1). We thank Melissa Scott and Sarah L. Xiao for their English editing of the manuscript.
Footnotes
Appendix A. Supplementary material
Supplementary data associated with this article can be found, in the online version, at http://dx.doi.org/10.1016/j.isprsjprs.2015.04.008.
References
- Barrett CB. Measuring food insecurity. Science. 2010;327:825–828. doi: 10.1126/science.1182768. [DOI] [PubMed] [Google Scholar]
- Biradar CM, Xiao XM. Quantifying the area and spatial distribution of double- and triple-cropping croplands in India with multi-temporal MODIS imagery in 2005. Int. J. Remote Sens. 2011;32:367–386. [Google Scholar]
- Bouman BAM, Humphreys E, Tuong TP, Barker R. Rice and water. Adv. Agron. 2007;92(92):187–237. [Google Scholar]
- Bouvet A, Thuy LT. !Use of ENVISAT/ASAR wide-swath data for timely rice fields mapping in the Mekong River Delta. Remote Sens. Environ. 2011;115:1090–1101. [Google Scholar]
- Bridhikitti A, Overcamp TJ. Estimation of Southeast Asian rice paddy areas with different ecosystems from moderate-resolution satellite imagery. Agr. Ecosyst. Environ. 2012;146:113–120. [Google Scholar]
- Chen C, McNairn H. A neural network integrated approach for rice crop monitoring. Int. J. Remote Sens. 2006;27:1367–1393. [Google Scholar]
- Chen H, Zhu QA, Peng CH, Wu N, Wang YF, Fang XQ, Jiang H, Xiang WH, Chang J, Deng XW, Yu GR. Methane emissions from rice paddies natural wetlands, lakes in China: synthesis new estimate. Global Change Biol. 2013;19:19–32. doi: 10.1111/gcb.12034. [DOI] [PubMed] [Google Scholar]
- Chen XQ, Pan WF. Relationships among phenological growing season, time-integrated normalized difference vegetation index and climate forcing in the temperate region of eastern China. Int. J. Climatol. 2002;22:1781–1792. [Google Scholar]
- Chen XQ, Xu CX, Tan ZJ. An analysis of relationships among plant community phenology and seasonal metrics of Normalized Difference Vegetation Index in the northern part of the monsoon region of China. Int. J. Biometeorol. 2001;45:170–177. doi: 10.1007/s004840100102. [DOI] [PubMed] [Google Scholar]
- Dong J, Xiao X, Kou W, Qin Y, Zhang G, Li L, Jin C, Zhou Y, Wang J, Biradar C, Liu J, Moore B., Iii Tracking the dynamics of paddy rice planting area in 1986–2010 through time series Landsat images and phenology-based algorithms. Remote Sens. Environ. 2015;160:99–113. [Google Scholar]
- FAO. How to Feed the World in 2050, Rome. 2009 [Google Scholar]
- FAOSTAT. 2009 < http://faostat3.fao.org/faostat-gateway/go/to/home/E>.
- Friedl MA, Sulla-Menashe D, Tan B, Schneider A, Ramankutty N, Sibley A, Huang XM. MODIS Collection 5 global land cover: algorithm refinements and characterization of new datasets. Remote Sens. Environ. 2010;114:168–182. [Google Scholar]
- Frolking S, Qiu JJ, Boles S, Xiao XM, Liu JY, Zhuang YH, Li CS, Qin XG. Combining remote sensing and ground census data to develop new maps of the distribution of rice agriculture in China. Global Biogeochem. Cy. 2002:16. [Google Scholar]
- Gao J, Liu YS. Climate warming and land use change in Heilongjiang Province, Northeast China. Appl. Geogr. 2011;31:476–482. [Google Scholar]
- Gilbert M, Xiao XM, Chaitaweesub P, Kalpravidh W, Premashthira S, Boles S, Slingenbergh J. Avian influenza, domestic ducks and rice agriculture in Thailand. Agr. Ecosyst. Environ. 2007;119:409–415. doi: 10.1016/j.agee.2006.09.001. [DOI] [PMC free article] [PubMed] [Google Scholar]
- Gilbert M, Xiao XM, Pfeiffer DU, Epprecht M, Boles S, Czarnecki C, Chaitaweesub P, Kalpravidh W, Minh PQ, Otte MJ, Martin V, Slingenbergh J. Mapping H5N1 highly pathogenic avian influenza risk in Southeast Asia. Proc. Natl. Acad. Sci. USA. 2008;105:4769–4774. doi: 10.1073/pnas.0710581105. [DOI] [PMC free article] [PubMed] [Google Scholar]
- Hall DK, Riggs GA, Salomonson VV. Development of methods for mapping global snow cover using moderate resolution imaging spectroradiometer data. Remote Sens. Environ. 1995;54:127–140. [Google Scholar]
- Hall DK, Riggs GA, Salomonson VV, DiGirolamo NE, Bayr KJ. MODIS snow-cover products. Remote Sens. Environ. 2002;83:181–194. [Google Scholar]
- Heilongjiang Statistical Bureau. Heilongjiang Statistical Yearbook. Beijing: China Statistical Publisher House; 2013. [Google Scholar]
- Stocker TF, Qin D, Plattner G-K, Tignor M, Allen SK, Boschung J, Nauels A, Xia Y, Bex V, Midgley PM, editors. IPCC. Climate Change 2013: The Physical Science Basis, Contribution of Working Group I Contribution to the Fifth Assessment Report of Intergovernmental Panel on Climate Change. Cambridge, United Kingdom and New York, NY, USA: Cambridge University Press; 2013. p. 1535. [Google Scholar]
- ITT Visual Information Solutions. Atmospheric Correction Module: QUAC and FLAASH User’s Guide [Google Scholar]
- Jiang CS, Wang YS, Hao QJ, Song CC. Effect of land-use change on CH4 and N2O emissions from freshwater marsh in Northeast China. Atmos. Environ. 2009;43:3305–3309. [Google Scholar]
- Koppe W, Gnyp ML, Hutt C, Yao YK, Miao YX, Chen XP, Bareth G. Rice monitoring with multi-temporal and dual-polarimetric TerraSAR-X data. Int. J. Appl. Earth Obs. 2013;21:568–576. [Google Scholar]
- Leff B, Ramankutty N, Foley JA. Geographic distribution of major crops across the world. Global Biogeochem. Cy. 2004:18. [Google Scholar]
- LeToan T, Ribbes F, Wang LF, Floury N, Ding KH, Kong JA, Fujita M, Kurosu T. Rice crop mapping and monitoring using ERS-1 data based on experiment and modeling results. IEEE Trans. Geosci. Remote. 1997;35:41–56. [Google Scholar]
- Li P, Feng ZM, Jiang LG, Liu YJ, Xiao XM. Changes in rice cropping systems in the Poyang Lake Region, China during 2004–2010. J. Geogr. Sci. 2012;22:653–668. [Google Scholar]
- Liu JY, Kuang WH, Zhang ZX, Xu XL, Qin YW, Ning J, Zhou WC, Zhang SW, Li RD, Yan CZ, Wu SX, Shi XZ, Jiang N, Yu DS, Pan XZ, CHi WF. Spatio-temporal characteristics, patterns, and causes of land-use changes in China since the late 1980s. J. Geogr. Sci. 2014;24:195–210. [Google Scholar]
- Liu JY, Liu ML, Tian HQ, Zhuang DF, Zhang ZX, Zhang W, Tang XM, Deng XZ. Spatial and temporal patterns of China’s cropland during 1990- 2000: an analysis based on Landsat TM data. Remote Sens. Environ. 2005;98:442–456. [Google Scholar]
- Matsumura K, Hijmans RJ, Chemin Y, Elvidge CD, Sugimoto K, Wu WB, Lee YW, Shibasaki R. Mapping the global supply and demand structure of rice. Sustain. Sci. 2009;4:301–313. [Google Scholar]
- Motohka T, Nasahara KN, Miyata A, Mano M, Tsuchida S. Evaluation of optical satellite remote sensing for rice paddy phenology in monsoon Asia using a continuous in situ dataset. Int. J. Remote Sens. 2009;30:4343–4357. [Google Scholar]
- Pan XZ, Uchida S, Liang Y, Hirano A, Sun B. Discriminating different landuse types by using multitemporal NDXI in a rice planting area. Int. J. Remote Sens. 2010;31:585–596. [Google Scholar]
- Peng DL, Huete AR, Huang JF, Wang FM, Sun HS. Detection and estimation of mixed paddy rice cropping patterns with MODIS data. Int. J. Appl. Earth Obs. 2011;13:13–23. [Google Scholar]
- Pittman K, Hansen MC, Becker-Reshef I, Potapov PV, Justice CO. Estimating global cropland extent with multi-year MODIS data. Remote Sens.-Basel. 2010;2:1844–1863. [Google Scholar]
- Sakamoto T, Van Nguyen N, Ohno H, Ishitsuka N, Yokozawa M. Spatio-temporal distribution of rice phenology and cropping systems in the Mekong Delta with special reference to the seasonal water flow of the Mekong and Bassac rivers. Remote Sens. Environ. 2006;100:1–16. [Google Scholar]
- Shao Y, Fan XT, Liu H, Xiao JH, Ross S, Brisco B, Brown R, Staples G. Rice monitoring and production estimation using multitemporal RADARSAT. Remote Sens. Environ. 2001;76:310–325. [Google Scholar]
- Shao Y, Lunetta RS, Ediriwickrema J, Liames J. Mapping cropland and major crop types across the great lakes basin using MODIS-NDVI data. Photogramm. Eng. Remote Sens. 2010;76:73–84. [Google Scholar]
- Shi JJ, Huang JF, Zhang F. Multi-year monitoring of paddy rice planting area in Northeast China using MODIS time series data. J. Zhejiang Univ.-Sci. B. 2013;14:934–946. doi: 10.1631/jzus.B1200352. [DOI] [PMC free article] [PubMed] [Google Scholar]
- Shiu YS, Lin ML, Huang CH, Chu TH. Mapping paddy rice agriculture in a highly fragmented area using a geographic information system object-based post classification process. J. Appl. Remote Sens. 2012:6. [Google Scholar]
- Son N-T, Chen C-F, Chen C-R, Duc H-N, Chang L-Y. A phenology-based classification of time-series MODIS data for rice crop monitoring in Mekong delta, Vietnam. Remote Sens.-Basel. 2014;6:135–156. [Google Scholar]
- Sun HS, Huang JF, Huete AR, Peng DL, Zhang F. Mapping paddy rice with multi-date moderate-resolution imaging spectroradiometer (MODIS) data in China. J. Zhejiang Univ.-Sci. A. 2009;10:1509–1522. [Google Scholar]
- Torbick N, Salas W, Xiao XM, Ingraham P, Fearon MG, Biradar C, Zhao DL, Liu Y, Li P, Zhao YL. Integrating SAR and optical imagery for regional mapping of paddy rice attributes in the Poyang Lake Watershed, China. Can. J. Remote Sens. 2011;37:17–26. [Google Scholar]
- Wang CZ, Wu JP, Zhang Y, Pan GD, Qi JG, Salas WA. Characterizing L-Band scattering of paddy rice in Southeast China with radiative transfer model and multitemporal ALOS/PALSAR imagery. IEEE Trans. Geosci. Remote. 2009;47:988–998. [Google Scholar]
- Xiao X, Boles S, Frolking S, Salas W, Moore B, Li C, He L, Zhao R. Observation of flooding and rice transplanting of paddy rice fields at the site to landscape scales in China using VEGETATION sensor data. Int. J. Remote Sens. 2002a;23:3009–3022. [Google Scholar]
- Xiao X, Dorovskoy P, Biradar C, Bridge E. A library of georeferenced photos from the field. EOS, Trans. Am. Geophys. Union. 2011;92:453–454. [Google Scholar]
- Xiao X, He L, Salas W, Li C, Moore B, Zhao R, Frolking S, Boles S. Quantitative relationships between field-measured leaf area index and vegetation index derived from VEGETATION images for paddy rice fields. Int. J. Remote Sens. 2002b;23:3595–3604. [Google Scholar]
- Xiao XM, Biradar CM, Czarnecki C, Alabi T, Keller M. A simple algorithm for large-scale mapping of evergreen forests in tropical America, Africa and Asia. Remote Sens.-Basel. 2009;1:355–374. [Google Scholar]
- Xiao XM, Boles S, Frolking S, Li CS, Babu JY, Salas W, Moore B. Mapping paddy rice agriculture in South and Southeast Asia using multi-temporal MODIS images. Remote Sens. Environ. 2006;100:95–113. [Google Scholar]
- Xiao XM, Boles S, Liu JY, Zhuang DF, Frolking S, Li CS, Salas W, Moore B. Mapping paddy rice agriculture in southern China using multi-temporal MODIS images. Remote Sens. Environ. 2005;95:480–492. [Google Scholar]
- Yan HM, Liu JY, Huang HQ, Tao B, Cao MK. Assessing the consequence of land use change on agricultural productivity in China. Global Planet. Change. 2009;67:13–19. [Google Scholar]
- Zha Y, Gao J, Ni S. Use of normalized difference built-up index in automatically mapping urban areas from TM imagery. Int. J. Remote Sens. 2003;24:583–594. [Google Scholar]
- Zhang Y, Su SL, Zhang F, Shi RH, Gao W. Characterizing spatio-temporal dynamics of methane emissions from rice paddies in Northeast China from 1990 to 2010. PLoS ONE. 2012:7. doi: 10.1371/journal.pone.0029156. [DOI] [PMC free article] [PubMed] [Google Scholar]
- Zhang Y, Wang CZ, Wu JP, Qi JG, Salas WA. Mapping paddy rice with multitemporal ALOS/PALSAR imagery in southeast China. Int. J. Remote Sens. 2009;30:6301–6315. [Google Scholar]
- Zhang Y, Wang YY, Su SL, Li CS. Quantifying methane emissions from rice paddies in Northeast China by integrating remote sensing mapping with a biogeochemical model. Biogeosciences. 2011;8:1225–1235. [Google Scholar]
- Zhang Z, Wang X, Zhao X, Liu B, Yi L, Zuo L, Wen Q, Liu F, Xu J, Hu S. A 2010 update of National Land Use/Cover Database of China at 1:100000 scale using medium spatial resolution satellite images. Remote Sens. Environ. 2014;149:142–154. [Google Scholar]
- Zhao GY, Liu JS, Wang Y. Effects of elevated atmospheric CO2 concentration and nitrogen addition on the growth of Calamagrostis angustifolia in Sanjiang Plain freshwater marsh. Chin. J. Appl. Ecol. 2011;22:1653–1658. [PubMed] [Google Scholar]
- Zhong LH, Gong P, Biging GS. Efficient corn and soybean mapping with temporal extendability: a multi-year experiment using Landsat imagery. Remote Sens. Environ. 2014;140:1–13. [Google Scholar]
- Zhong LH, Hawkins T, Biging G, Gong P. A phenology-based approach to map crop types in the San Joaquin Valley, California. Int. J. Remote Sens. 2011;32:7777–7804. [Google Scholar]
- Zhu N, Jiang H, Jin YY. A phenology study on the common tree species of natural secondary forests in Northeast China. Acta Phytoecologica Et Geobotanica Sinica. 1990;14:336–349. [Google Scholar]
- Zhu Z, Woodcock CE. Object-based cloud and cloud shadow detection in Landsat imagery. Remote Sens. Environ. 2012;118:83–94. [Google Scholar]
Associated Data
This section collects any data citations, data availability statements, or supplementary materials included in this article.


