Abstract
Evidence supports an important role of Ca2+ release-activated Ca2+ channel protein 1 (Orai1)-mediated Ca2+ entry in the development of renal fibrosis, a common pathologic feature of CKDs that lead to ESRD, but the molecular mechanisms remain unclear. We determined the role of Orai1 calcium channel in renal fibrosis induced by high-fat diet and by unilateral ureteral obstruction. Mouse kidneys with fibrosis had higher levels of Orai1 protein expression than did kidneys without fibrosis. In vivo knockdown of Orai1 with adenovirus harboring Orai1–short hairpin RNA or inhibition of Orai1 with SKF96365 dramatically prevented renal fibrosis and significantly decreased protein expression of fibronectin, α‑smooth muscle actin, and TGF‑β1 in the kidney cortex of ApoE–/– mice on a high-fat diet and in the obstructed kidneys of mice with unilateral ureteral obstruction. Compared with kidney biopsy specimens of patients with glomerular minimal change disease, those of patients with fibrotic nephropathy had higher expression levels of Orai1. In cultured human proximal tubule epithelial cells (HK2), knockdown of Orai1 Ca2+ channel with adenovirus–Orai1–short hairpin RNA markedly inhibited TGF-β1–induced intracellular Ca2+ influx and phosphorylation of smad2/3. Knockdown or blockade of the Orai1 Ca2+ channel in HK2 cells also prevented epithelial-to-mesenchymal transition induced by TGF‑β1. In conclusion, blockade of the Orai1 Ca2+ channel prevented progression of renal fibrosis in mice, likely by suppressing smad2/3 phosphorylation and TGF-β1–induced epithelial-to-mesenchymal transition. These results render the Orai1 Ca2+ channel a potential therapeutic target against renal fibrosis.
Keywords: Orai1, EMT, renal fibrosis
Diabetes and obesity-related kidney diseases are associated with mesangial extension, renal interstitial fibrosis, progressive decrease in GFR, and eventually lead to ESRD.1 Renal fibrosis is a common pathologic feature of progressive kidney disease due to a variety of conditions such as diabetes and obesity. It is characterized by the accumulation of fibroblasts and excessive deposition of extracellular matrix (ECM), along with a loss of functional nephrons.2
During the past decade, the contribution of fibroblasts deriving from renal tubular epithelium via epithelial-to-mesenchymal transition (EMT) to renal fibrosis has been recognized.2–6 EMT is characterized by loss of the epithelial marker E‑cadherin and the increased expression of myofibroblast markers, e.g., α‑smooth muscle actin (α‑SMA), vimentin, and S100A4 in tubular epithelia cells.7 Among the signaling pathways leading to renal fibrosis, TGF‑β1/smad signaling is a major and classic pathway,8–10 which results in the transcription of TGF‑β1 target genes when activated.5,11,12 TGF‑β1 may directly induce the production of ECM and the transdifferentiation of tubular epithelial cells to fibroblast.12
Ca2+ is a ubiquitous second messenger that is involved in regulating a variety of cellular functions.13,14 Increases in intracellular Ca2+ concentrations ([Ca2+]i) have been found to play important roles in the development of kidney diseases, including renal fibrosis.15–17 The role of voltage-dependent calcium channels in unilateral ureteral obstruction (UUO)-induced kidney fibrosis has been suggested in several recent studies.16,18
Notably, the store-operated Ca2+ (SOC) channel is the major route for Ca2+ entry in nonexcitable cells.19,20 Orai1 has been identified as a pore subunit of the SOC channel and mainly locates at the plasma membrane.21–24 The other component of SOC entry complex is STIM1 protein, which is a Ca2+ sensor in the endoplasmic reticulum. STIM1 is oligomerized and translocated to the plasma membrane during Ca2+ store depletion, thereby triggering Ca2+ entry via Orai1.25 The Orai1 Ca2+ channel plays an important role in regulating cell migration, proliferation, and gene expression, as well as intracellular calcium oscillation in the kidney.26–28 Orai1 protein expression in glomerular mesangial cells has been shown to increase in high glucose or diabetic conditions.29,30 Interestingly, Wu et al. demonstrated that Orai1 in mesangial cells negatively regulates ECM protein expression in the kidney, potentially serving as an endogenous renoprotective mechanism in diabetes.31 However, the role of Orai1 in the development of fibrotic nephropathy is not well defined.
In this study, we examined whether knockdown or inhibition of Orai1 improves interstitial fibrosis induced by high-fat diet (HFD) in ApoE knockout (ApoE–/–) mice and by UUO in C57/BL6 mice. In cultured human proximal tubular cells, we investigated whether the Orai1 Ca2+ channel is involved in TGF-β1–induced EMT.
Results
HFD Was Associated with Increased Protein and mRNA Expression of Orai1 in the Kidneys of ApoE–/– Mice
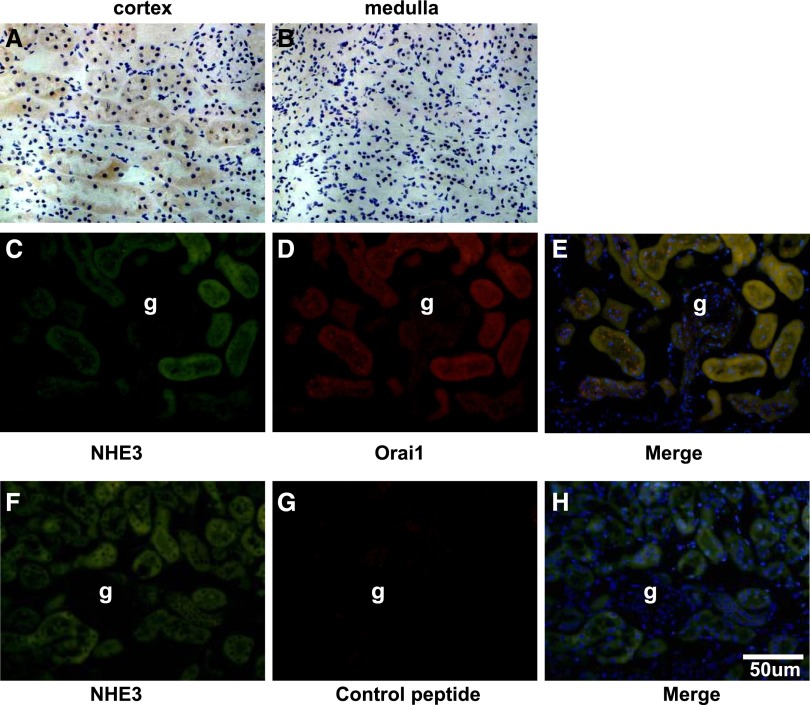
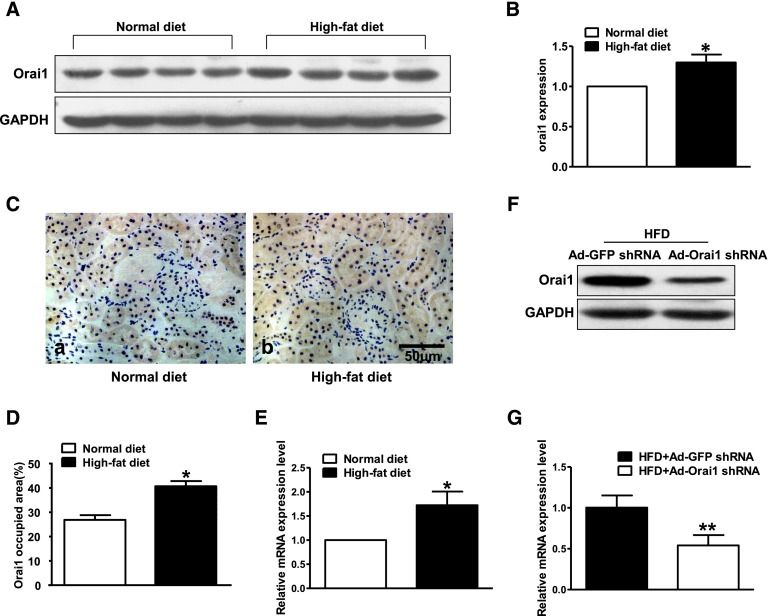
Immunohistochemistry demonstrated that Orai1 was mainly located in the proximal tubules in the cortex of the ApoE–/– mouse kidney; little labeling was found in the glomeruli or medullary tubules (Figure 1, A and B). Immunofluorescence showed a colocalization of Orai1 with sodium–hydrogen exchanger type 3, a well identified sodium transporter in the proximal tubular cells (Figure 1, C–E). Interestingly, the abundance of Orai1 protein and mRNA in the cortex was significantly increased in ApoE–/– mice fed with HFD when compared with controls (Figure 2, A–E).
Figure 1.
Localization of Orai1 in murine kidney. Representative samples of immunohistochemical staining of Orai1 in mouse kidney sections. Orai1 mainly expresses in the kidney cortex (A), but not in the medulla (B). (C–H) Representative immunofluorescent staining of sodium–hydrogen exchanger type 3 (NHE3; green, C and F) and Orai1 (red, D) in the mouse kidney cortex. Orai1 and NHE3 colocalize in the proximal tubules. (G) Kidney sections were preincubated with control peptides as a negative control. g, glomeruli.
Figure 2.
HFD was associated with increased expression of Orai1 in the kidneys of ApoE–/– mice. (A–D) Orai1 protein and (E) mRNA expression were significantly upregulated in the kidney cortex of ApoE–/– mice fed with HFD compared with controls by immunoblotting (A, B), immunohistochemistry (C, D), and quantitative real-time PCR (E). Values are means±SEM, n=4–6 in each group. *P≤0.05 versus normal diet. Ad‑Orai1–shRNA successfully inhibited (F) protein abundance and (G) mRNA levels of Orai1 in the kidney cortex of ApoE–/– mice fed with HFD. Values are means±SEM, n=10 in each group. **P≤0.01 versus HFD+Ad‑GFP–shRNA.
Inhibition of Orai1 Ca2+ Channel Prevented Fibrosis in the Kidney of ApoE–/– Mice Fed with HFD
To further investigate the role of Orai1 in kidney injury induced by HFD, adenovirus (Ad) short hairpin RNA (shRNA) was used to knockdown Orai1 in vivo. The successful inhibition of Orai1 in mouse kidney was detected by western blot and real-time RT-PCR (Figure 2, F and G).
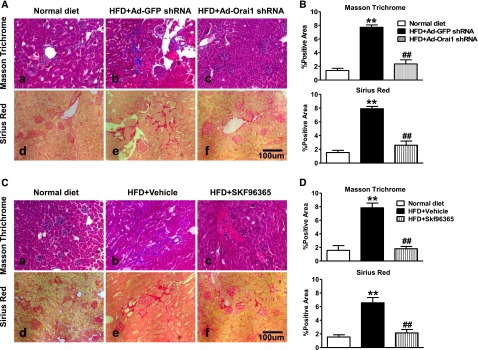
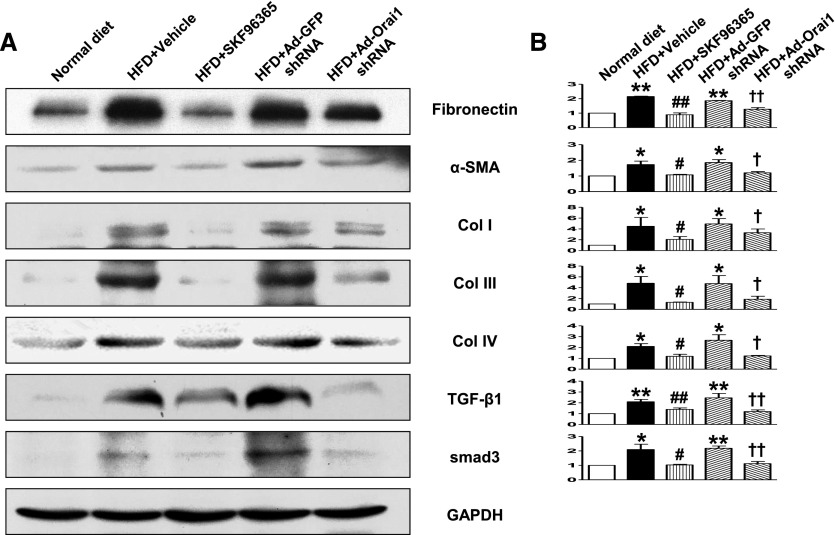
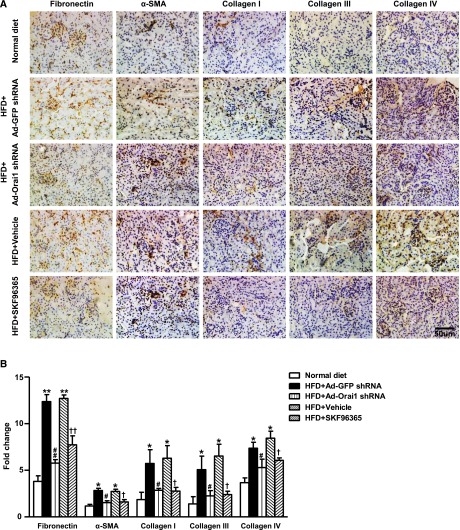
As seen in Figure 3, Masson Trichrome and Sirius Red staining showed marked fibrotic lesions in the kidneys of ApoE–/– mice fed with HFD when compared with controls. By contrast, knockdown of Orai1 by Ad‑Orai1–shRNA (Figure 3, A and B) or inhibition of Orai1 with Ca2+ channel blocker SKF96365 (Figure 3, C and D) showed less fibrosis in tubulointerstitial areas than in their respective controls. Western blotting (Figure 4) and immunohistochemistry (Figure 5) demonstrated that protein expression of the profibrotic markers fibronectin, α‑SMA, and collagens I, III, and IV was significantly upregulated in the cortex of kidneys of ApoE–/– mice fed with HFD compared with controls, whereas Ad‑Orai1–shRNA or SKF96365 treatment was associated with reduced protein expression of the above markers (Figures 4 and 5). TGF‑β/smad signaling is a typical pathway involved in the development of kidney fibrosis. HFD has been associated with significantly increased protein abundance of TGF‑β1 and smad3 in the kidney cortex, which was markedly suppressed by inhibition of Orai1 (Figure 4, A and B) by either Ad‑Orai1–shRNA or SKF96365.
Figure 3.
Inhibition of Orai1 Ca2+ channel by shRNA or SKF 96365 prevented renal fibrosis in ApoE–/– mice fed with HFD. (A, B) Representative images of (A) Masson Trichrome staining and Sirius Red staining of kidney sections from normal diet (a, d) and HFD (b, c, e, f) fed ApoE–/– mice treated by Ad‑Orai1–shRNA (c, f) or Ad‑GFP–shRNA (b, e) and (B) corresponding quantification. Values are mean±SEM, n=6 in each group. **P≤0.01 versus normal diet; ##P≤0.01 versus HFD+Ad‑GFP–shRNA. (C, D) Representative images of (C) Masson Trichrome staining and Sirius Red staining of kidney sections from normal diet (a, d) and HFD (b, c, e, f) fed ApoE–/– mice treated by vehicle (b, e) or SOC channel blocker SKF96365 (c, f) and (D) corresponding quantification. Values are mean±SEM, n=6 in each group. **P≤0.01 versus normal diet; ##P≤0.01 versus HFD+vehicle.
Figure 4.
Inhibition of Orai1 Ca2+ channel by shRNA or SKF96365 prevented increased protein abundance of profibrotic factors in the kidney of ApoE–/– mice fed with HFD. (A) Representative immunoblotting of fibronectin, α‑SMA, collagen I, collagen III, collagen IV, TGF‑β1, and smad3 levels in the protein extractions from kidney cortex of normal and HFD fed ApoE–/– mice treated with vehicle, SKF96365, Ad‑GFP–shRNA, or Ad‑Orai1–shRNA. (B) Quantitative analysis of profibrotic factor levels normalized to GADPH. Values are mean±SEM, n=6 in each group. *P≤0.05 or **P≤0.01 versus normal diet; #P≤0.05 or #P≤0.01 versus HFD+Ad‑GFP–shRNA; †P≤0.05 or ††P≤0.01 versus HFD+vehicle.
Figure 5.
Inhibition of Orai1 Ca2+ channel by shRNA or SKF96365 prevented increased protein abundance of profibrotic factors in the kidney of ApoE–/– mice fed with HFD. Representative immunohistochemical staining of fibronectin, α‑SMA, collagen I, collagen III, and collagen IV in kidney sections from normal diet and HFD fed ApoE–/– mice treated with Ad‑Orai1–shRNA, Ad‑GFP–shRNA, or SKF96365. (B) Quantitative analysis of α‑SMA, fibronectin, collagen I, collagen III, and collagen IV. n=6 in each group. Values are mean±SEM. *P≤0.05 or **P≤0.01 versus normal diet; #P≤0.05 or ##P≤0.01 versus HFD+Ad‑GFP–shRNA; †P≤0.05 or ††P≤0.01 versus HFD+vehicle.
Consistent with improvements in renal structure, knockdown or inhibition of Orai1 also prevented HFD-induced impaired renal function. Serum creatinine levels were increased in mice on HFD, which was attenuated by inhibition of Orai1. Importantly, HFD induced a significant elevation of albuminuria that was markedly improved by knockdown or inhibition of Orai1 (Table 1).
Table 1.
Metabolic data of mice fed normal diet or HFD
| Normal Diet | HFD+Ad‑GFP–shRNA | HFD+Ad‑Orai1–shRNA | HFD+Vehicle | HFD+SKF96365 | |
|---|---|---|---|---|---|
| Body wt (g) | 30.37±0.28 | 39.63±0.62a | 38.48±0.51a | 40.01±0.66a | 39.10±0.58a |
| Kidney weight (mg) | 323.5±3.1 | 398.7±5.6a | 395.2±6.8a | 402.3±11.4a | 395.6±6.3a |
| Serum creatinine (mg/dl) | 0.28±0.04 | 0.53±0.07a | 0.41±0.05ab | 0.56±0.06a | 0.38±0.04ab |
| UACR (mg/g) | 11.32±2.11 | 26.63±2.73a | 16.27±2.31ab | 24.12±2.93a | 16.35±2.62ab |
Values are mean±SEM, n=6–8 in each group. Statistical analyses were performed by one-way ANOVA. UACR, urine albumin-to-creatinine ratio.
P<0.05 versus mice on normal diet.
P<0.05 versus mice on HFD+Ad‑GFP–shRNA or HFD+vehicle.
Inhibition of Orai1 Ca2+ Channel Prevented Kidney Fibrosis Induced by UUO
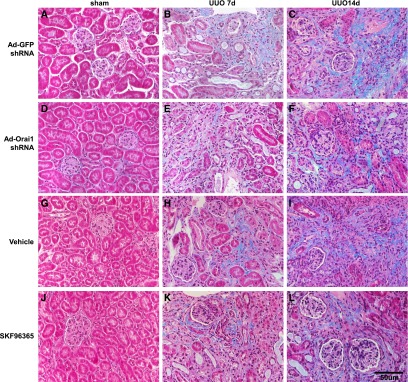
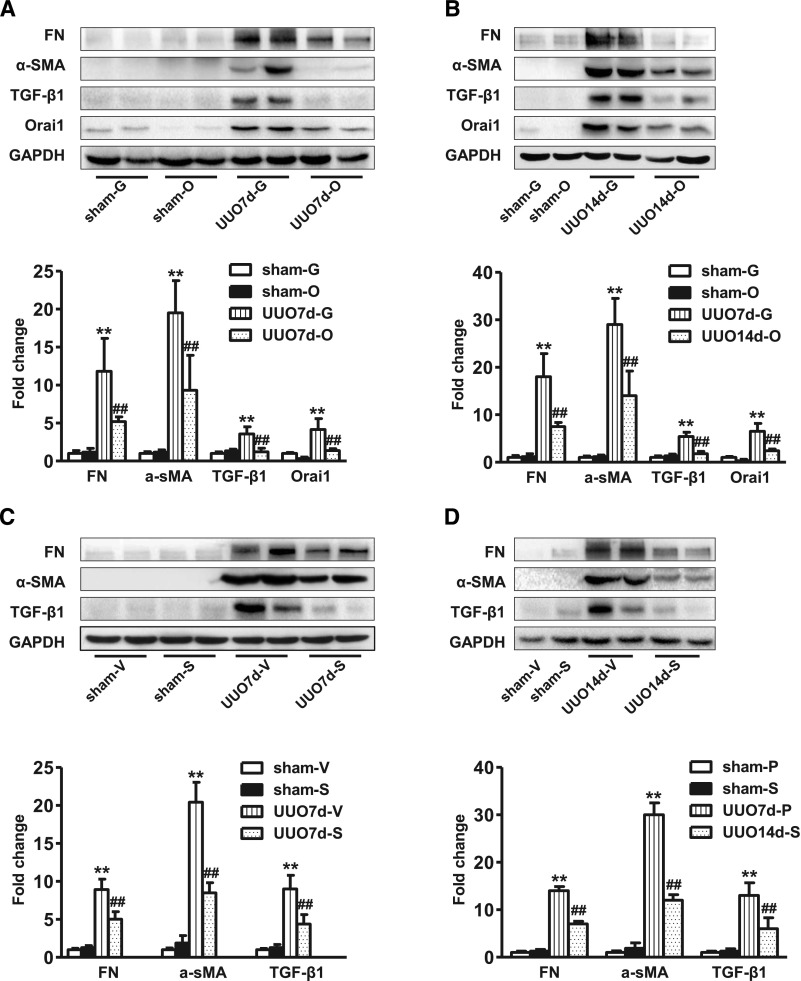
Next, UUO was carried out to further examine the role of Orai1 in kidney fibrosis. As seen in Figure 6, Masson Trichrome showed marked fibrotic lesions in the obstructed kidneys of UUO mice when compared with sham mice. By contrast, knockdown of Orai1 by Ad‑Orai1–shRNA (Figure 6, E and F) or inhibition of Orai1 with Ca2+ channel blocker SKF96365 (Figure 6, K and L) showed less fibrosis in tubulointerstitial areas than in their respective controls. UUO was associated with significantly increased abundance of Orai1 (Figure 7, A and B) and STIM1 expression (Supplemental Figure 1A). Western blotting (Figure 7) and immunohistochemistry (Supplemental Figures 2 and 3) demonstrated that protein expression of the profibrotic markers fibronectin, α‑SMA, TGF‑β1, and collagens I, III, and IV was significantly upregulated in the cortex of obstructed kidneys compared with sham mice, whereas Ad‑Orai1–shRNA or SKF96365 treatment was associated with reduced protein expression of the above markers (Figure 7).
Figure 6.
Inhibition of Orai1 Ca2+ channel by shRNA or SKF96365 prevented renal fibrosis in mice with UUO. Representative images of Masson Trichrome staining of kidney sections from sham-operated, 7-day UUO, and 14-day UUO mice treated with (A–C) Ad‑GFP–shRNA, (D–F) Ad‑Orai1–shRNA, (G–I) vehicle PBS, or (J–L) SOC channel blocker SKF96365.
Figure 7.
Inhibition of Orai1 Ca2+ channel by shRNA or SKF96365 prevented increased protein abundance of profibrotic factors in the kidney of mice with UUO. Representative immunoblotting of fibronectin, α‑SMA, TGF‑β1, and Orai1 levels in the protein extractions from kidney cortex of sham-operated mice and UUO mice treated with (A, B) Ad‑GFP–shRNA or Ad‑Orai1–shRNA; (C, D) vehicle PBS or SKF96365. Values are mean±SEM, n=6 in each group. **P≤0.01 versus sham; ##P≤0.01 versus UUO7d‑G or UUO7d‑V. Sham-G, sham-O, sham-V, sham-S: sham-operated mice treated with Ad‑GFP–shRNA, Ad‑Orai1–shRNA, vehicle PBS, or SKF96365. UUO7d-G, UUO7d-O, UUO7d-V, UUO7d-S: 7-day UUO mice treated with Ad‑GFP–shRNA, Ad‑Orai1–shRNA, vehicle PBS, or SKF96365. UUO14d‑G, UUO14d‑O, UUO14d‑V, UUO14d‑S: 14-day UUO mice treated with Ad‑GFP–shRNA, Ad‑Orai1–shRNA, vehicle PBS, or SKF96365.
Expression of Orai1 Was Increased in Human Kidneys with Fibrosis
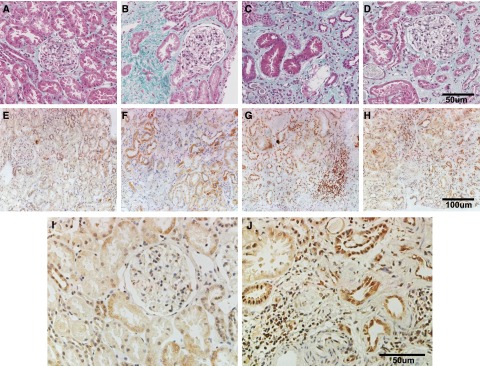
The basic characteristics of all patients are summarized in Table 2. Masson Trichrome staining showed fibrotic lesions in kidneys from patients with focal proliferative sclerosis and tubule-interstitial nephritis (Figure 8, B–D), but not in minimal change disease (Figure 8A). Immunocytochemistry demonstrated that Orai1 was expressed in tubular epithelia, glomerular cells, endothelia of blood vessels, and fibroblasts. The intensity of Orai1 immunostaining in the tubular epithelium was much higher in specimens from patients with fibrotic kidney diseases (Figure 8, F–H and J), compared with that from patients with glomerular minimal change diseases (Figure 8, E and I), indicating the involvement of Orai1 in the development of human kidney fibrosis.
Table 2.
Basic characteristics of patients
| Case No. | Age | Gender | P-creatinine (µmol/L) | Albuminuria (mg/24 h) |
|---|---|---|---|---|
| (1) Nephrotic syndrome, glomerular minimal change diseases, CKD | 17 | M | 63 | 6338 |
| (2) Chronic tubule-interstitial nephritis, CKD II | 38 | M | 152 | 5.8 |
| (3) Proliferative sclerotic IgA nephropathy | 31 | F | 223 | 2100 |
| (4) Focal proliferative sclerotic IgA nephropathy, IV | 25 | M | 257.6 | 744 |
IV, histological grade IV, the Lee classification of IgA nephropathy.
Figure 8.
Orai1 expression increased in biopsied human kidney specimens with fibrotic nephropathy. (A–D, case no. 1–4) Masson Trichrome staining of kidney sections from patients with kidney diseases. (E–H, case no. 1–4) Immunohistochemistry staining of Orai1 in human kidney specimens. (I, J) Case no. 1 and 4 with higher magnification. Information on patients is given in Table 2.
Knockdown of Orai1 Ca2+ Channel Reduced Calcium Entry, Limited Expression of Fibronectin and Collagen IV Induced by TGF‑β1 or Angiotensin II in HK2 Cells
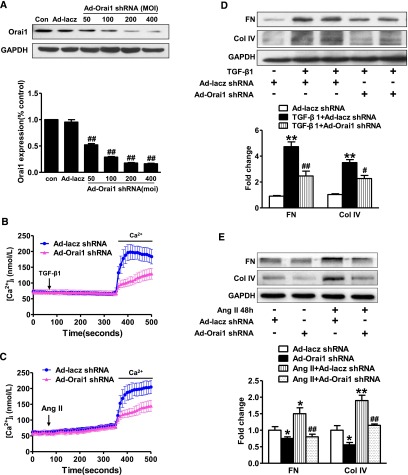
To determine whether the Orai1 Ca2+ channel is involved in TGF‑β1 or angiotensin II (AngII)–induced Ca2+ influx, HK2 cells were transfected with Ad-Orai1–shRNA to knockdown Orai1. As shown in Figure 9, the successful knockdown of Orai1 was confirmed by western blot with anti-Orai1 antibody (Figure 9A). TGF‑β1 (5 ng/ml) significantly increased [Ca2+]i in HK2 cells, knockdown of Orai1 (Figure 9B) or STIM1 (Supplemental Figure 1, B and C) significantly attenuated TGF-β1–evoked [Ca2+]i compared with control. Similarly, AngII–induced [Ca2+]i was also significantly prevented by Orai1 inhibition (Figure 9C). Interestingly, increased Ca2+ influx evoked by TGF‑β1 or AngII in HK2 cells was coincident with markedly increased expression levels of fibronectin and collagen IV, which was significantly attenuated by Orai1 inhibition (Figure 9, D and E). These data suggest that Orai1 mediates TGF-β1– and AngII–activated Ca2+ entry and ECM protein expression in HK2 cells.
Figure 9.
Inhibition of Orai1 Ca2+ channel by shRNA prevented TGF‑β1 or AngII–induced intracellular increase of Ca2+ in HK2 cells. (A) Immunoblotting and corresponding semiquantification showed that Orai1 shRNA transfection for 48 hours decreased Orai1 protein expression in HK2 cells. Values are mean±SEM, n=6. ##P≤0.01 versus scrambled shRNA (Ad‑lacz–shRNA). (B) Ad‑Orai1–shRNA transfection significantly inhibited increased intracellular Ca2+ induced by TGF‑β1 compared with controls. (C) Ad‑Orai1–shRNA transfection significantly inhibited increased intracellular Ca2+ induced by AngII compared with controls. Values are mean±SEM, n=6. (D, E) Orai1 inhibition by shRNA attenuated (D) TGF‑β1 or (E) AngII–induced increased expression of fibronectin and collagen IV. Values are mean±SEM, n=6 in each group. *P≤0.05 or **P≤0.01 versus Ad‑GFP–shRNA; #P≤0.05 or ##P≤0.01 versus TGF‑β1+Ad‑GFP–shRNA or AngII+Ad‑GFP–shRNA. Ad‑lacz, Ad‑lacz–shRNA.
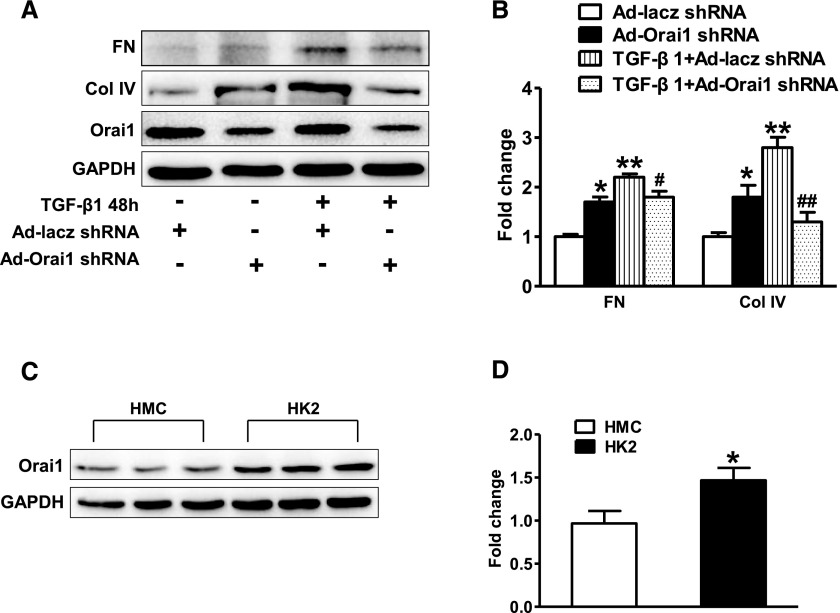
Activation of SOC with thapsigargin was indicated to inhibit TGF-β1–stimulated fibronectin expression in cultured human mesangial cells (HMC),31 so we investigated whether inhibition of Orai1 with shRNA in HMCs affected TGF-β1–induced ECM protein expression. Orai1 inhibition was associated with moderately increased fibronectin and collagen IV expression in HMCs (Figure 10, A and B), consistent with a previous report31; TGF‑β1 treatment increased both proteins’ expression to a level higher than that in untreated HMCs, however, Orai1 inhibition reduced TGF-β1–stimulated fibronectin and collagen IV expression when compared with noninhibition in HMCs (Figure 10, A and B). Interestingly, the abundance of Orai1 protein expression in cultured HMCs was significantly lower than that in HK2 cells (Figure 10, C and D), suggesting a potentially more important role for Orai1 in proximal tubule cells, but not mesangial cells in the progression of kidney fibrosis.
Figure 10.
Inhibition of Orai1 Ca2+ channel by shRNA prevented increase of fibronectin and collagen IV induced by TGF‑β1 in HMCs. (A, B) Orai1 inhibition by shRNA increased expression of fibronectin and collagen IV in cultured HMCs, but suppressed increase of fibronectin and collagen IV expression induced by TGF‑β1. Values are mean±SEM, n=6 in each group. *P≤0.05 or **P≤0.01 versus Ad‑GFP–shRNA; #P≤0.05 or ##P≤0.01 versus TGF‑β1+Ad‑GFP–shRNA. (C, D) Abundance of Orai1 protein expression in HK2 cells were more than that in mesangial cells. Values are mean±SEM, n=6 in each group. *P≤0.05 versus HMCs.
Knockdown or Inhibition of Orai1 Ca2+ Channel Prevented TGF-β1–Induced smad2/3 Phosphorylation in HK2 Cells
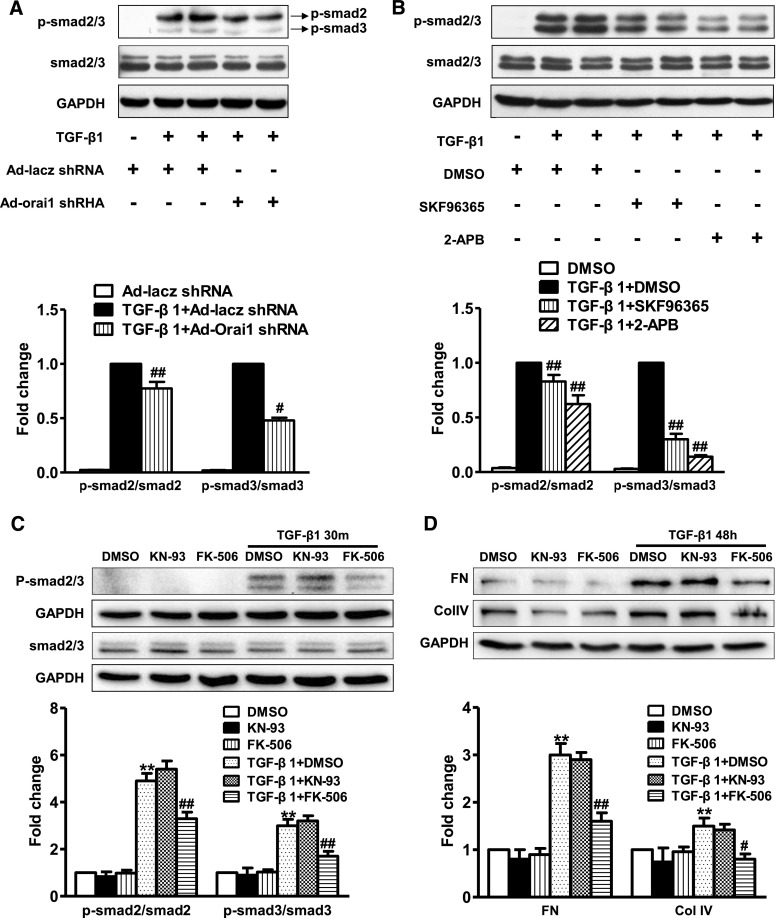
Treatment with TGF‑β1 significantly increased the protein abundance of phosphorylated smad2/3, whereas smad2/3 protein abundance was maintained in HK2 cells. Knockdown of Orai1 with Ad‑Orai1–shRNA remarkably suppressed the TGF-β1–induced increased expression level of phosphorylated smad2/3 (Figure 11, A and B). Similarly, SKF96365 or 2‑aminoethoxydiphenylborane (2‑APB; an inositol 1,4,5-triphosphate3 receptor antagonist) inhibited TGF-β1–induced increased phosphorylated smad2/3 protein expression (Figure 11, A and B). These results indicate that Orai1 Ca2+ channel is involved in TGF‑β1/smad signaling in HK2 cells.
Figure 11.
Inhibition of Orai1 Ca2+ channel prevented TGF-β1–induced smad2/3 phosphorylation in HK2 cells. (A) Representative immunoblotting and corresponding semiquantification of phosphorylated smad2/3 and smad2/3 protein abundance in response to TGF‑β1 treatment in HK2 cells. Knockdown of Orai1 by shRNA significantly suppressed phosphorylation of total smad2/3 induced by TGF‑β1. Values are mean±SEM, n=6. #P≤0.05 or ##P≤0.01 versus TGF‑β1+Ad‑lacz–shRNA. (B) Representative immunoblotting and corresponding semiquantification of phosphorylated smad2/3 and total smad2/3 protein abundance in response to TGF‑β1 in HK2 cells. Treatment with SOC channel blocker SKF96365 or IP3 receptor antagonist 2-APB inhibited smad2/3 phosphorylation induced by TGF‑β1. Values are mean±SEM, n=6. ##P≤0.01 versus TGF‑β1+DMSO. (C, D) Representative immunoblotting and corresponding semiquantification of phosphorylated smad2/3 and smad2/3 protein, fibronectin, and collagen IV abundance in response to TGF‑β1 in HK2 cells. Calcineurin inhibitor FK‑506 (10 µmol/L) but not CaMK II inhibitor KN‑93 (10 µmol/L) decreased phosphorylation of smad2/3 and expression of fibronectin and collagen IV induced by TGF‑β1. Values are mean±SEM, n=5. **P<0.01 versus nontreated group; #P<0.05 or ##P≤0.01 versus TGF‑β1+DMSO.
Ca2+/calmodulin-dependent kinases (CaMKs) and Ca2+/calmodulin-dependent phosphatase calcineurin are the two major downstream pathways following intracellular Ca2+ increase.14 To identify which pathway is involved in Orai1-mediated smad2/3 phosphorylation in TGF-β1–stimulated cells, we investigated the effects of pharmacologic inhibition of CaMK II and calcineurin on smad2/3 phosphorylation. The results showed that calcineurin inhibitor FK‑506, but not CaMK II inhibitor KN‑93, inhibited TGF-β1–stimulated smad2/3 phosphorylation (Figure 11C). Moreover, FK‑506, but not KN‑93, decreased TGF‑β1-stimulated fibronectin and collagen IV expression (Figure 11D). These findings indicate that Ca2+ calcineurin signaling contributes to TGF-β1–induced renal fibrosis.
Knockdown or Inhibition of Orai1 Ca2+ Channel Prevented TGF-β1–Induced EMT in HK2 Cells
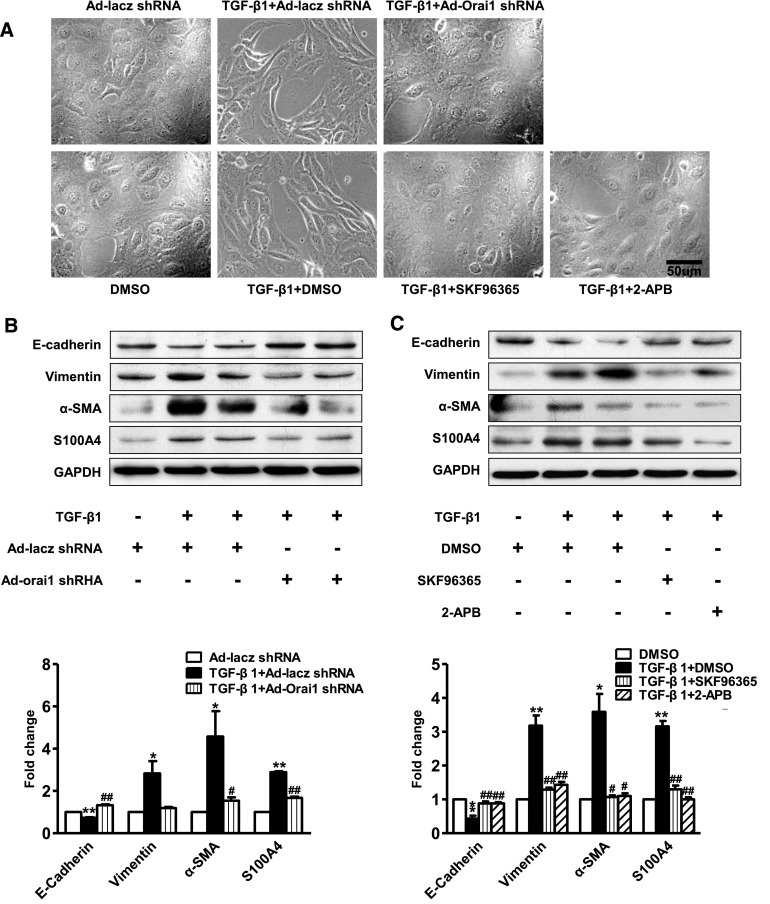
HK2 cells that were treated with DMSO alone exhibited the typical cobblestone morphology of epithelial cells. Treatment with TGF‑β1 was associated with morphologic changes, including elongation and hypertrophy, separation from neighboring cells (Figure 12A), and decreased protein expression of the epithelial marker E‑cadherin (Figure 12, B and C). At the same time, the protein abundance of α‑SMA, vimentin, and S100A4, as mesenchymal markers, was significantly upregulated in HK2 cells treated with TGF‑β1 (Figure 12, B and C).
Figure 12.
Inhibition of Orai1 prevented TGF-β1–induced EMT in cultured HK2 cells. (A) HK2 cells change from cobblestone-like shapes to spindle shapes, and to dispersed, loose contact arrays. Knockdown of Orai1 by shRNA or inhibition of Orai1 Ca2+ channel with SKF96365 or 2‑APB prevented morphologic changes induced by TGF‑β1 in HK2 cells. (B, C) Representative immunoblotting and corresponding semiquantification of E‑cadherin, vimentin, α‑SMA, and S100A4 protein abundance in (B) Ad‑Orai1–shRNA or Ad‑lacz–shRNA transfected HK2 cells, or (C) in HK2 cells treated with SKF96365 or 2‑APB. Inhibition of Orai1 Ca2+ channel was associated with reduced epithelial marker E‑cadherin protein abundance and with significantly increased vimentin, α‑SMA, and S100A4 protein expression. Values are mean±SEM, n=6. *P≤0.05 or **P≤0.01 versus Ad‑lacz–shRNA or DMSO; #P≤0.05 or ##P≤0.01 versus TGF‑β1+Ad‑lacz–shRNA or TGF‑β1+DMSO.
Knockdown or inhibition of the Orai1 channel markedly prevented morphologic changes induced by TGF‑β1 in HK2 cells (Figure 12A). Knockdown of Orai1 with Ad‑Orai1–shRNA reversed the effect of TGF‑β1 on EMT by restoring the protein expression of E‑cadherin and by attenuating the expression of α‑SMA, vimentin, and S100A4 in HK2 cells (Figure 12B). SKF96365 and 2‑APB showed similarly preventative effects on EMT markers in HK2 cells with TGF‑β1 treatment (Figure 12C). These data suggest a potential role of the Orai1 Ca2+ channel in renal EMT induced by TGF‑β1.
Discussion
In this study, we demonstrated an upregulation of Orai1 protein expression levels in the kidney cortex of ApoE–/– mice fed with HFD and of mice with UUO. Increased expression of Orai1 protein was also found in biopsies of patients with fibrotic nephropathy. Orai1 knockdown or inhibition significantly attenuated renal fibrosis associated with HFD treatment and UUO. In vitro data showed that inhibition of Orai1 reduced TGF-β1– or AngII–induced Ca2+ influx, smad phosphorylation, and EMT in cultured HK2 cells.
Lipid accumulation in the kidney after a HFD exposure leads to impairment of tubular cell structure and is associated with inflammation and fibrosis.32–36 In this study, HFD treatment was associated with increased expression of Orai1 protein and mRNA in proximal tubular epithelial cells, indicating that Orai1 is at least partially involved in dyslipidemia-induced kidney tubular injury. A recent report showed increased Orai1 protein expression in kidney cortex of rats treated with streptozotosin injection and fed with HFD, in which increase of Orai1 protein abundance was attributed to increased mesangial cells.30 However, considering the ratio of mesangial cells in the cortex, the observed increase in Orai1 is mostly likely attributed to other cell types in this region of the kidney. In addition, we found that Orai1 expression in cultured HK2 cells is nearly 1.5‑fold more than in cultured HMC. Strong labeling of Orai1 in proximal tubular cells, but not in glomerular cells, supports a conception that it is proximal tubule cells, but not mesangial cells, that contribute to increased Orai1 expression found in the kidney cortex after HFD treatment.
Interstitial fibrosis is a characteristic feature of CKD in the later stage. Indeed, HFD was associated with marked renal fibrosis in ApoE–/– mice, as seen in Sirius Red and Masson Trichrome staining, which detect the deposition of collagen fibrils. HFD also induced significant increases in the protein expression of several profibrotic factors including fibronectin, α‑SMA, collagen I, III, IV, and TGF‑β1, in agreement with previous studies.37–40 Importantly, Orai1 knockdown with shRNA or inhibition with SOC blockers markedly improved renal fibrosis and significantly decreased protein levels of these profibrotic factors in both HFD and UUO models. Notably, in biopsies from patients with fibrotic nephropathy, increased Orai1 expression was also observed in the cortex, particularly in tubular cells. Taken together, these studies likely suggest a profound involvement of Orai1 in the development of kidney fibrosis.
Although the role of EMT in renal fibrosis has been argued recently,41 it is generally accepted that interstitial fibroblasts, which are primarily responsible for ECM accumulation, may originate from tubular epithelial cells via EMT in the fibrotic kidney.42,43 Overwhelming evidence suggests that TGF‑β1 plays a critical role in EMT.5,7,12,44 Given the universal upregulation of TGF‑β1 in the fibrotic kidney, TGF-β1–induced EMT has particular relevance to the development of kidney fibrosis, in which smad proteins mediate signals.
In our studies, when incubated with TGF‑β1, HK2 cells underwent phenotypic conversion, which was characterized by morphologic changes to a fibroblastic appearance from the epithelial type. This transition in cellular morphology was accompanied by alterations in protein expression, manifest as the loss of epithelial proteins including E‑cadherin and acquisition of new mesenchymal markers such as vimentin, α‑SMA, and S100A4. Interestingly, knockdown or inhibition of Orai1 markedly attenuated TGF-β1–induced expression of mesenchymal markers. Meanwhile, Orai1 inhibition prevented reduced expression of E‑cadherin protein and maintained HK2 morphology as an epithelial tubular cell after TGF‑β1 treatment. Changes in morphology and protein abundance after TGF‑β1 treatment were accompanied by intracellular calcium oscillation in cultured HK2 cells. TGF‑β1 treatment evoked increased calcium entry in HK2 cells, which was fully blocked when Orai1 was knocked down, indicating a potential involvement of Orai1 and Orai1-mediated calcium influx in TGF-β1–induced EMT. Furthermore, TGF-β1–induced increased expression and phosphorylation of smad2/3 were also attenuated when Orai1 was knocked down or inhibited in HK2 cells. Increased TGF‑β1 and smad3 protein expression in the kidneys of mice fed with HFD were shown to decrease when Orai1 was inhibited, suggesting a role of Orai1 in the development of kidney fibrosis. Interestingly, we found that Ca2+ calcineurin, but not the calmodulin signaling pathway appears to mediate TGF-β1–induced smad2/3 phosphorylation and fibrosis.
Increased Orai1 expression has been observed in the diabetic kidney cortex.31 Our data showed that Orai1 expression is increased in kidney cortex of mice fed with HFD. Of note, however, recent works demonstrated that knockdown of Orai1 increased fibronectin expression in cultured HMC and increased ECM protein expression in the renal cortex, as well as mesangial expansion in the glomerulus.30,31 In our study, knockdown of Orai1 in mesangial cells indeed increased fibronectin and collagen IV expression, consistent with a previous study by Wu et al.; however, TGF‑β1 treatment was actually associated with reduced expression of these two proteins after Orai1 knockdown, which was not performed in the Wu et al. study.31 Nevertheless, these studies indicate a complicated role of Orai1 in mesangial cells and probably also in glomerular sclerosis. Mesangial expansion usually occurs at the early stage in diabetic nephropathy, and interstitial fibrosis appears to be a feature of late diabetic nephropathy. It is therefore possible that renal Orai1 may function differently in mesangial cells from tubular cells in response to high glucose or lipid challenge at different stages.
It should be noted that in vivo inhibition of Orai1 in this study was performed by using shRNA and inhibitors of SOC, which may have systemic effects. To better understand the role of Orai1 in kidney fibrosis, tubular cell–specific knockdown of Orai1 would be expected to provide definite answers; more studies are therefore warranted.
In summary, renal fibrosis induced by HFD or UUO was associated with increased expression of Orai1 in the kidney cortex. Orai1 inhibition attenuated expression of renal profibrotic factors, and prevented EMT via a TGF‑β1/smad–dependent pathway. This study indicates that inhibition of Orai1 in proximal tubular epithelial cells may protect the kidney from fibrotic injuries. Our findings highlight the important role of Orai1 Ca2+ channel activation in the development of renal fibrosis, suggesting that blockade of the Orai1 Ca2+ channel is likely a promising therapeutic option to limit the progress of kidney fibrosis.
Concise Methods
Materials and Reagents
DMEM/F12 medium, 1640 medium, and FBS were from Gibco (Carlsbad, CA). SKF96365, 2‑APB, recombination human TGF‑β1, EGTA, Fura‑2/AM, KN‑93, FK‑506, and AngII were from Sigma-Aldrich (St. Louis, MO). Orai1 antibody was purchased from Alomone (Jerusalem, Israel) for western blotting or from Santa Cruz Biotechnology (San Diego, CA) for immunohistochemistry. TGF‑β1 antibody and sodium–hydrogen exchanger type 3 antibody were purchased from Santa Cruz Biotechnology. GAPDH antibody was purchased from Signalway Antibody (Baltimore, MD). Phosphorylated smad2 (Ser465/467)/smad3 (Ser423/425), smad2/3, smad3, E‑cadherin, vimentin, and S100A4 antibodies were purchased from Cell Signaling Technology (Danvers, MA). Collagens I, III, and IV, and STIM1 antibodies were purchased from Abcam, Inc. (Cambridge, MA). Fibronectin and α‑SMA antibodies were purchased from Boster (Wuhan, China). Histostain-plus kit was purchased from ZSGB (ZSGB-Bio Origene, China).
Animals
ApoE–/– mice were obtained from the Laboratory Animal Center of Sun Yat-Sen University. ApoE–/– mice (8 weeks old) were fed a western-type HFD containing 1.25% cholesterol for 12 weeks. After a HFD for 8 weeks, the mice were injected with Ad expression of Orai1 shRNA (Ad‑Orai1–shRNA, 5×10⁹ plaque-forming units/mouse) or Ad expression of GFP shRNA (Ad‑GFP–shRNA, 5×10⁹ plaque-forming units/mouse) via the tail vein and the animals were maintained on HFD for another 4 weeks. Another group of ApoE–/– mice had pellets subcutaneously implanted (Innovative Research of America, Sarasota, FL) constantly releasing Orai1 blocker SKF96365 (10 mg/kg per day, Sigma-Aldrich) or vehicle for another 4 weeks prior to harvesting kidneys. The control group was fed with normal diet.
C57/BL6 male mice were anesthetized and ureteral obstruction was performed by the double ligation of the left ureter with 4–0 silk via a midline abdominal incision. Sham-operated mice had their ureters exposed and manipulated, but not ligated. The mice were injected with Ad‑Orai1–shRNA or Ad‑GFP–shRNA via the tail vein at day 1 and day 3 after UUO. Another group of mice had subcutaneously implanted pellets constantly releasing SKF96365 or vehicle PBS after UUO. The kidneys were harvested at day 7 and day 14 after UUO, respectively.
shRNA sequences for mouse Orai1 were 5′‑CCGGTCGTCTTTGCTGTTCACTTCTCAAGAGAAAGTGAACAGCAAAGACGATTTTTTG‑3′.
All animal experimental procedures were performed in accordance with the policies of the Sun Yat-Sen University Animal Care and Use Committee and conformed to the “Guide for the Care and Use of Laboratory Animals” of the National Institutes of Health in China.
Blood and Urine Chemistry
Urine was collected and clearance studies were performed during 24-hour periods throughout the study. At the end of each protocol, blood samples were collected into heparinized tubes for the measurement of plasma creatinine when the mice were euthanized. The plasma concentrations of creatinine was determined by using an EIA kit according to the manufacturer’s instructions (BioAssay Systems). Urinary albumin was measured by using a urine protein test kit (Nanjing Jianchen Bioengineering Institute, China) according to the manufacturer’s instructions.
Patients and Tissue Samples
Kidney biopsy samples were collected from patients who had been pathologically interpreted as having renal fibrosis at the Department of Nephrology, Guangdong General Hospital, Guangdong Academy of Medical Sciences. The acquisition of specimens was approved by the Medical Research Committee of Guangdong General Hospital, Guangdong Academy of Medical Sciences. Informed consent was obtained from all patients and experiments were conducted according to the principles of the Declaration of Helsinki.
Quantitative Real-Time PCR
Total RNA was extracted from the kidney cortex according to the manufacturer’s instructions for Trizol reagent (Invitrogen, Carlsbad, CA). Briefly, total RNA (500 ng) was used for reverse transcription using PrimeScript RT reagent Kit Perfect Real Time kit (Takara Bio Inc., Tokyo, Japan). The cDNA was used for quantitative real-time PCR analysis using SYBR Premix Ex Taq (Perfect Real Time) (Takara Bio Inc.). Target mRNA was determined using the comparative cycle threshold method of relative quantitation. The calibrator sample was selected from PBS-treated tissue samples, and GAPDH was used as an internal control. Primer sequences for Orai1: forward: 5′‑GGCTCGGGGACAAAACACTA‑3′; reverse: 5′‑TAGCCCCAGCAACACAGTTT‑3′; for GAPDH: forward: 5′‑TGACCTCAACTACATGGTCTACA‑3′; reverse: 5′‑CTTCCCATTCTCGGCCTT‑3′.
Western Blotting
Western blotting was performed as previously described.45,46
Histology, Immunohistochemistry, and Immunofluorescent Staining
Histology was performed on paraffin-embedded kidney tissues for Masson Trichrome staining and Sirius Red staining. Immunohistochemistry and immunofluorescent staining were performed as previously described.45,46 The quantification of all raw images were performed using Image-Pro Plus 5.0 software.
Cell Culture and Treatment
Immortalized HK2 were cultured in DMEM/F12 containing 10% FBS, 1.20 g/L sodium bicarbonate, 100 U/ml penicillin, and 100 μg/ml streptomycin at 37°C in 5% CO2. In order to induce phosphorylated smad2/3 expression, the cells were treated with TGF‑β1 (5 ng/ml) in fresh free serum media for 30 minutes before protein extraction. For EMT experiments, HK2 cells were first cultured in free serum DMEM/F12 for 24 hours, then the media was changed to fresh DMEM/F12 with free FBS containing TGF‑β1 (5 ng/ml) for another 48 hours, accompanied with Ad‑lacz–shRNA or Ad‑Orai1–shRNA. Cells were pretreated with DMSO, SKF96365 (20 μM), or 2‑APB (100 μM) for 2 hours before TGF‑β1 treatment. The HMC were cultured in RPMI 1640 containing 10% FBS, 2.0 g/L sodium bicarbonate, 100 U/ml penicillin, and 100 μg/ml streptomycin at 37°C in 5% CO2.
Ad Transfection and small interfering RNA Transfection
The shRNA Ad against Orai1 genes (Shanghai Sunbio Medical Biotechnology Co., Ltd) were continuously transfected into HK2 or HMC cells. A scrambled shRNA Ad (Ad‑lacz–shRNA) (Shanghai Sunbio Medical Biotechnology Co., Ltd.) was used as a negative control. shRNA Ad against Orai1 genes or scrambled shRNA Ad were added into cells with DMEM/F12 or RPMI 1640 containing 2% FBS (Gibco). The final concentration of Ad-Orai1–shRNA was 200 multiplicity of infection per cell. After incubation for 6 hours at 37°C, transfection complexes were replaced with normal DMEM/F12 or RPMI 1640 containing 10% FBS. Forty-eight hours later, HK2 or HMC cells were applied to relevant experiments. HMCs were transfected with STIM1 small interfering RNA (siRNA) (Qiagen, Germany) or negative siRNA using the HiPerFect Transfection Reagent (Qiagen) for 2 hours in FBS-free medium, and then cultured in 10% FBS medium for 48 hours. Sequences of shRNA for human Orai1 were 5′‑CCGGGAGCAACGTGCACAATCTCAACTCGAGTTGAGATTGTGCACGTTGCTCTTTTTTG‑3′. Sequences of siRNA for human STIM1 have been previously described.28
Measurement of [Ca2+]i
[Ca2+]i was monitored using a RF‑5301 fluorescence spectrophotometer (Shimadzu, Tokyo, Japan), modified as previously described.46 Briefly, HK2 cells, adjusted to a cell density of 106 cells/ml, were loaded with 2μM fura-2/AM for 45min at 37°C. The medium containing fura-2/AM was removed after incubation, and the cells in suspensions were measured at 37°C in a cuvette placed in a Spectrophotometer. The fluorescence was monitored at 340- and 380-nm excitation wavelengths, and the emission wavelength was 510nm. [Ca2+]i was calculated using the software following the manufacturer's instructions (Shimadzu, Japan).
Morphologic Assessment of HK2 Cell
HK2 cells were grown in six-well plates, followed by appropriate treatments. The cells were photographed using an Olympus microscope connected to a digital camera with a macro conversion lens.
Statistical Analyses
All data were represented as mean±SEM. Statistical analysis was determined by an unpaired two-tailed t test or one-way ANOVA followed by Bonferroni multiple comparison post hoc test with a 95% confidence interval. Values of P<0.05 were considered significant.
Disclosures
None.
Supplementary Material
Acknowledgments
This work was supported by the National Natural Science Foundation of China (nos. 81525025, 81273500, 81473206, 81471132, and 81230082), Guangdong University Pearl-river Scholar Funds (2013), the National Research Foundation for the Doctoral Program of Higher Education of China (no. 20120171110058), and the Natural Science Foundation of Guangdong Province (no. S2013010015263).
Footnotes
Published online ahead of print. Publication date available at www.jasn.org.
This article contains supplemental material online at http://jasn.asnjournals.org/lookup/suppl/doi:10.1681/ASN.2015080889/-/DCSupplemental.
References
- 1.Declèves AE, Sharma K: Obesity and kidney disease: differential effects of obesity on adipose tissue and kidney inflammation and fibrosis. Curr Opin Nephrol Hypertens 24: 28–36, 2015 [DOI] [PMC free article] [PubMed] [Google Scholar]
- 2.Woo YM, Pereira BJ, Gill JS: Chronic kidney disease progression in native and transplant kidneys. Curr Opin Nephrol Hypertens 13: 607–611, 2004 [DOI] [PubMed] [Google Scholar]
- 3.Iwano M, Plieth D, Danoff TM, Xue C, Okada H, Neilson EG: Evidence that fibroblasts derive from epithelium during tissue fibrosis. J Clin Invest 110: 341–350, 2002 [DOI] [PMC free article] [PubMed] [Google Scholar]
- 4.He J, Xu Y, Koya D, Kanasaki K: Role of the endothelial-to-mesenchymal transition in renal fibrosis of chronic kidney disease. Clin Exp Nephrol 17: 488–497, 2013 [DOI] [PubMed] [Google Scholar]
- 5.Liu Y: New insights into epithelial-mesenchymal transition in kidney fibrosis. J Am Soc Nephrol 21: 212–222, 2010 [DOI] [PMC free article] [PubMed] [Google Scholar]
- 6.Park SH, Choi MJ, Song IK, Choi SY, Nam JO, Kim CD, Lee BH, Park RW, Park KM, Kim YJ, Kim IS, Kwon TH, Kim YL: Erythropoietin decreases renal fibrosis in mice with ureteral obstruction: role of inhibiting TGF‑beta-induced epithelial-to-mesenchymal transition. J Am Soc Nephrol 18: 1497–1507, 2007 [DOI] [PubMed] [Google Scholar]
- 7.Liu Y: Epithelial to mesenchymal transition in renal fibrogenesis: pathologic significance, molecular mechanism, and therapeutic intervention. J Am Soc Nephrol 15: 1–12, 2004 [DOI] [PubMed] [Google Scholar]
- 8.Lan HY: Diverse roles of TGF‑β/Smads in renal fibrosis and inflammation. Int J Biol Sci 7: 1056–1067, 2011 [DOI] [PMC free article] [PubMed] [Google Scholar]
- 9.Massagué J, Wotton D: Transcriptional control by the TGF‑beta/Smad signaling system. EMBO J 19: 1745–1754, 2000 [DOI] [PMC free article] [PubMed] [Google Scholar]
- 10.Cui W, Maimaitiyiming H, Qi X, Norman H, Wang S: Thrombospondin 1 mediates renal dysfunction in a mouse model of high-fat diet-induced obesity. Am J Physiol Renal Physiol 305: F871–F880, 2013 [DOI] [PMC free article] [PubMed] [Google Scholar]
- 11.Roberts AB, Tian F, Byfield SD, Stuelten C, Ooshima A, Saika S, Flanders KC: Smad3 is key to TGF‑beta-mediated epithelial-to-mesenchymal transition, fibrosis, tumor suppression and metastasis. Cytokine Growth Factor Rev 17: 19–27, 2006 [DOI] [PubMed] [Google Scholar]
- 12.Meng XM, Tang PM, Li J, Lan HY: TGF‑β/Smad signaling in renal fibrosis. Front Physiol 6: 82, 2015 [DOI] [PMC free article] [PubMed] [Google Scholar]
- 13.Leybaert L, Sanderson MJ: Intercellular Ca(2+) waves: mechanisms and function. Physiol Rev 92: 1359–1392, 2012 [DOI] [PMC free article] [PubMed] [Google Scholar]
- 14.Petersen OH, Michalak M, Verkhratsky A: Calcium signalling: past, present and future. Cell Calcium 38: 161–169, 2005 [DOI] [PubMed] [Google Scholar]
- 15.Yang D, Yang D: Role of intracellular Ca2+ and Na+/Ca2+ exchanger in the pathogenesis of contrast-induced acute kidney injury. BioMed Res Int 2013: 678456, 2013 [DOI] [PMC free article] [PubMed] [Google Scholar]
- 16.Mishima K, Maeshima A, Miya M, Sakurai N, Ikeuchi H, Hiromura K, Nojima Y: Involvement of N-type Ca(2+) channels in the fibrotic process of the kidney in rats. Am J Physiol Renal Physiol 304: F665–F673, 2013 [DOI] [PubMed] [Google Scholar]
- 17.Saliba Y, Karam R, Smayra V, Aftimos G, Abramowitz J, Birnbaumer L, Farès N: Evidence of a role for fibroblast transient receptor potential canonical 3 Ca2+ channel in renal fibrosis. J Am Soc Nephrol 26: 1855–1876, 2015 [DOI] [PMC free article] [PubMed] [Google Scholar]
- 18.Matsuda H, Mori T, Kurumazuka D, Kitada K, Hayashi T, Nagatoya K, Inoue T, Ukimura A, Matsumura Y, Ishizaka N, Kitaura Y: Inhibitory effects of T/L-type calcium channel blockers on tubulointerstitial fibrosis in obstructed kidneys in rats. Urology 77: 249.e9–249.e15, 2011 [DOI] [PubMed] [Google Scholar]
- 19.Lewis RS: The molecular choreography of a store-operated calcium channel. Nature 446: 284–287, 2007 [DOI] [PubMed] [Google Scholar]
- 20.Parekh AB, Penner R: Store depletion and calcium influx. Physiol Rev 77: 901–930, 1997 [DOI] [PubMed] [Google Scholar]
- 21.Prakriya M, Feske S, Gwack Y, Srikanth S, Rao A, Hogan PG: Orai1 is an essential pore subunit of the CRAC channel. Nature 443: 230–233, 2006 [DOI] [PubMed] [Google Scholar]
- 22.Vig M, Peinelt C, Beck A, Koomoa DL, Rabah D, Koblan-Huberson M, Kraft S, Turner H, Fleig A, Penner R, Kinet JP: CRACM1 is a plasma membrane protein essential for store-operated Ca2+ entry. Science 312: 1220–1223, 2006 [DOI] [PMC free article] [PubMed] [Google Scholar]
- 23.Yeromin AV, Zhang SL, Jiang W, Yu Y, Safrina O, Cahalan MD: Molecular identification of the CRAC channel by altered ion selectivity in a mutant of Orai. Nature 443: 226–229, 2006 [DOI] [PMC free article] [PubMed] [Google Scholar]
- 24.Zhang SL, Yu Y, Roos J, Kozak JA, Deerinck TJ, Ellisman MH, Stauderman KA, Cahalan MD: STIM1 is a Ca2+ from the Ca2+ sensor that activates CRAC channels and migrates store to the plasma membrane. Nature 437: 902–905, 2005 [DOI] [PMC free article] [PubMed] [Google Scholar]
- 25.Parekh AB: Store-operated CRAC channels: function in health and disease. Nat Rev Drug Discov 9: 399–410, 2010 [DOI] [PubMed] [Google Scholar]
- 26.Kim JH, Lkhagvadorj S, Lee MR, Hwang KH, Chung HC, Jung JH, Cha SK, Eom M: Orai1 and STIM1 are critical for cell migration and proliferation of clear cell renal cell carcinoma. Biochem Biophys Res Commun 448: 76–82, 2014 [DOI] [PubMed] [Google Scholar]
- 27.Shen B, Zhu J, Zhang J, Jiang F, Wang Z, Zhang Y, Li J, Huang D, Ke D, Ma R, Du J: Attenuated mesangial cell proliferation related to store-operated Ca2+ entry in aged rat: the role of STIM 1 and Orai 1. Age (Dordr) 35: 2193–2202, 2013 [DOI] [PMC free article] [PubMed] [Google Scholar]
- 28.Almirza WH, Peters PH, van Zoelen EJ, Theuvenet AP: Role of Trpc channels, Stim1 and Orai1 in PGF(2α)-induced calcium signaling in NRK fibroblasts. Cell Calcium 51: 12–21, 2012 [DOI] [PubMed] [Google Scholar]
- 29.Wang Y, Chaudhari S, Ren Y, Ma R: Impairment of hepatic nuclear factor-4α binding to the Stim1 promoter contributes to high glucose-induced upregulation of STIM1 expression in glomerular mesangial cells. Am J Physiol Renal Physiol 308: F1135–F1145, 2015 [DOI] [PMC free article] [PubMed] [Google Scholar]
- 30.Chaudhari S, Wu P, Wang Y, Ding Y, Yuan J, Begg M, Ma R: High glucose and diabetes enhanced store-operated Ca(2+) entry and increased expression of its signaling proteins in mesangial cells. Am J Physiol Renal Physiol 306: F1069–F1080, 2014 [DOI] [PMC free article] [PubMed] [Google Scholar]
- 31.Wu P, Wang Y, Davis ME, Zuckerman JE, Chaudhari S, Begg M, Ma R: Store-operated Ca2+ Channels in Mesangial Cells Inhibit Matrix Protein Expression. J Am Soc Nephrol 26: 2691–2702, 2015 [DOI] [PMC free article] [PubMed] [Google Scholar]
- 32.Ruan XZ, Varghese Z, Moorhead JF: An update on the lipid nephrotoxicity hypothesis. Nat Rev Nephrol 5: 713–721, 2009 [DOI] [PubMed] [Google Scholar]
- 33.de Vries AP, Ruggenenti P, Ruan XZ, Praga M, Cruzado JM, Bajema IM, D’Agati VD, Lamb HJ, Pongrac Barlovic D, Hojs R, Abbate M, Rodriquez R, Mogensen CE, Porrini E ERA-EDTA Working Group Diabesity : Fatty kidney: emerging role of ectopic lipid in obesity-related renal disease. Lancet Diabetes Endocrinol 2: 417–426, 2014 [DOI] [PubMed] [Google Scholar]
- 34.Declèves AE, Mathew AV, Cunard R, Sharma K: AMPK mediates the initiation of kidney disease induced by a high-fat diet. J Am Soc Nephrol 22: 1846–1855, 2011 [DOI] [PMC free article] [PubMed] [Google Scholar]
- 35.Declèves AE, Zolkipli Z, Satriano J, Wang L, Nakayama T, Rogac M, Le TP, Nortier JL, Farquhar MG, Naviaux RK, Sharma K: Regulation of lipid accumulation by AMP-activated kinase [corrected] in high fat diet-induced kidney injury. Kidney Int 85: 611–623, 2014 [DOI] [PMC free article] [PubMed] [Google Scholar]
- 36.Odermatt A: The Western-style diet: a major risk factor for impaired kidney function and chronic kidney disease. Am J Physiol Renal Physiol 301: F919–F931, 2011 [DOI] [PubMed] [Google Scholar]
- 37.Sun SF, Zhao TT, Zhang HJ, Huang XR, Zhang WK, Zhang L, Yan MH, Dong X, Wang H, Wen YM, Pan XP, Lan HY, Li P: Renoprotective effect of berberine on type 2 diabetic nephropathy in rats. Clin Exp Pharmacol Physiol 42: 662–670, 2015 [DOI] [PubMed] [Google Scholar]
- 38.Dai Y, Palade P, Wang X, Mercanti F, Ding Z, Dai D, Mehta JL: High fat diet causes renal fibrosis in LDLr-null mice through MAPK-NF-κB pathway mediated by Ox-LDL. J Cardiovasc Pharmacol 63: 158–166, 2014 [DOI] [PubMed] [Google Scholar]
- 39.Danda RS, Habiba NM, Rincon-Choles H, Bhandari BK, Barnes JL, Abboud HE, Pergola PE: Kidney involvement in a nongenetic rat model of type 2 diabetes. Kidney Int 68: 2562–2571, 2005 [DOI] [PubMed] [Google Scholar]
- 40.Jiang T, Wang Z, Proctor G, Moskowitz S, Liebman SE, Rogers T, Lucia MS, Li J, Levi M: Diet-induced obesity in C57BL/6J mice causes increased renal lipid accumulation and glomerulosclerosis via a sterol regulatory element-binding protein-1c-dependent pathway. J Biol Chem 280: 32317–32325, 2005 [DOI] [PubMed] [Google Scholar]
- 41.Kriz W, Kaissling B, Le Hir M: Epithelial-mesenchymal transition (EMT) in kidney fibrosis: fact or fantasy? J Clin Invest 121: 468–474, 2011 [DOI] [PMC free article] [PubMed] [Google Scholar]
- 42.Yamashita S, Maeshima A, Nojima Y: Involvement of renal progenitor tubular cells in epithelial-to-mesenchymal transition in fibrotic rat kidneys. J Am Soc Nephrol 16: 2044–2051, 2005 [DOI] [PubMed] [Google Scholar]
- 43.Yang J, Dai C, Liu Y: A novel mechanism by which hepatocyte growth factor blocks tubular epithelial to mesenchymal transition. J Am Soc Nephrol 16: 68–78, 2005 [DOI] [PubMed] [Google Scholar]
- 44.Hills CE, Squires PE: The role of TGF‑β and epithelial-to mesenchymal transition in diabetic nephropathy. Cytokine Growth Factor Rev 22: 131–139, 2011 [DOI] [PubMed] [Google Scholar]
- 45.Wang M, Yang H, Zheng LY, Zhang Z, Tang YB, Wang GL, Du YH, Lv XF, Liu J, Zhou JG, Guan YY: Downregulation of TMEM16A calcium-activated chloride channel contributes to cerebrovascular remodeling during hypertension by promoting basilar smooth muscle cell proliferation. Circulation 125: 697–707, 2012 [DOI] [PubMed] [Google Scholar]
- 46.Yang H, Huang LY, Zeng DY, Huang EW, Liang SJ, Tang YB, Su YX, Tao J, Shang F, Wu QQ, Xiong LX, Lv XF, Liu J, Guan YY, Zhou JG: Decrease of intracellular chloride concentration promotes endothelial cell inflammation by activating nuclear factor-κB pathway. Hypertension 60: 1287–1293, 2012 [DOI] [PubMed] [Google Scholar]
Associated Data
This section collects any data citations, data availability statements, or supplementary materials included in this article.


