Abstract
Novel therapies in autosomal dominant polycystic kidney disease (ADPKD) signal the need for markers of disease progression or response to therapy. This study aimed to identify disease-associated proteins in urinary extracellular vesicles (uEVs), which include exosomes, in patients with ADPKD. We performed quantitative proteomics on uEVs from healthy controls and patients with ADPKD using a labeled approach and then used a label-free approach with uEVs of different subjects (healthy controls versus patients with ADPKD versus patients with non-ADPKD CKD). In both experiments, 30 proteins were consistently more abundant (by two-fold or greater) in ADPKD-uEVs than in healthy- and CKD-uEVs. Of these proteins, we selected periplakin, envoplakin, villin-1, and complement C3 and C9 for confirmation because they were also significantly overrepresented in pathway analysis and were previously implicated in ADPKD pathogenesis. Immunoblotting confirmed higher abundances of the selected proteins in uEVs from three independent groups of patients with ADPKD. Whereas uEVs of young patients with ADPKD and preserved kidney function already had higher levels of complement, only uEVs of patients with advanced stages of ADPKD had increased levels of villin-1, periplakin, and envoplakin. Furthermore, all five proteins correlated positively with total kidney volume. Analysis in kidney tissue from mice with kidney-specific, tamoxifen-inducible Pkd1 deletion demonstrated higher expression in more severe stages of the disease and correlation with kidney weight for each protein of interest. In summary, proteomic analysis of uEVs identified plakins and complement as disease-associated proteins in ADPKD. These proteins are new candidates for evaluation as biomarkers or targets for therapy in ADPKD.
Keywords: ADPKD, complement, cytoskeleton, genetic renal disease
Autosomal dominant polycystic kidney disease (ADPKD) is the most common inherited kidney disease, affecting approximately 4 in 10,000 individuals.1 It is caused by mutations in the PKD1 or PKD2 gene, encoding for polycystin-1 and polycystin-2 proteins.2 Both proteins are associated with primary cilia and are thought to play a role in stretch-activated signaling. Loss of function of polycystins results in the development of fluid-filled cysts, ultimately leading to disruption of the normal kidney parenchyma. In the last decade, urinary extracellular vesicles (uEVs, which also include the so-called exosomes)3 have emerged as promising markers for kidney disease.4–6 These nanosized vesicles are released by direct shedding or by fusion of multivesicular bodies with the plasma membrane.7 Their content comprises proteins and nucleic acids, both of which have been explored as biomarkers.5 More specifically, uEVs appear to mirror the cellular make-up of renal epithelial cells. For example, we previously showed that aldosterone increased the sodium chloride cotransporter in both the kidney and uEVs.8 Twenty percent to 60% of renal cysts in ADPKD remain connected with the parent nephron,9,10 so that a substantial portion of uEVs in ADPKD may be derived from cyst epithelial cells. Studying uEVs in ADPKD may address the pathophysiology of the disease because uEVs contain polycystins and interact with primary cilia.11 We therefore hypothesized that studying uEVs in ADPKD is more advantageous than studying whole urine. Accordingly, the aims of this study were to (1) compare the proteome of whole urine with the proteome of uEVs and (2) identify disease-associated proteins in uEVs from patients with ADPKD.
Results
Characteristics of Participants
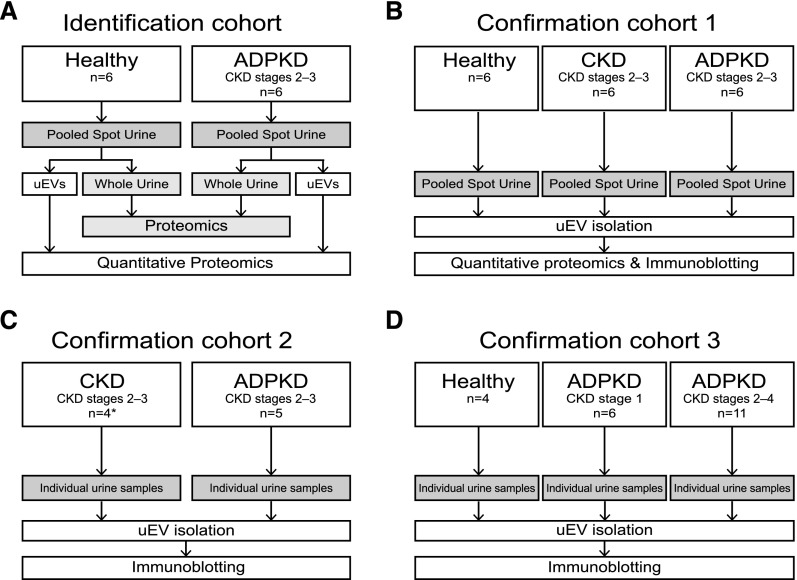
uEVs were isolated in four groups of patients with ADPKD due to a PKD1 mutation in order to identify and confirm disease-associated proteins (Figure 1, Supplemental Table 1, and Table 1). (1) In the identification cohort, we used labeled proteomics to identify proteins with higher or lower abundance in uEVs of patients with ADPKD. We also analyzed the proteome of whole urine to compare it with the uEV proteome. (2) In confirmation cohort 1, we used label-free proteomics, included different patients with ADPKD, and also included patients with non-ADPKD CKD. Patients with CKD were matched by age, sex, and eGFR, and this group was used to exclude proteins that may be related to impaired kidney function in general. The reason to use both labeled and label-free proteomics techniques is that the two approaches complement each other in terms of quantitation (labeled) and sensitivity (label-free). (3) In confirmation cohort 2, uEVs were isolated and compared with the uEVs of the patients with CKD from the validation cohort. (4) Finally, confirmation cohort 3 consisted of healthy control subjects, young patients with ADPKD who have preserved renal function (CKD stage 1) and those with more progressive disease (CKD stages 2–4).
Figure 1.
Sample collection, processing, and analysis in the four study groups. (A and B) Identification and confirmation cohorts used for proteomic analysis. Quantitative proteomics was performed using dimethyl labeling in the identification cohort and label-free methods in confirmation cohort 1 (see Concise Methods). (C and D) Confirmation cohorts 2 and 3 were used for the immunoblotting analysis. *Patients from validation cohort.
Table 1.
Characteristics of patients and healthy persons
| Cohort | Participants | Age (yr) | Men (%) | CKD Stages | eGFR (ml/min per 1.73 m2) | HtTKV | UAlb |
|---|---|---|---|---|---|---|---|
| Identification cohort | Healthy (n=6) | 49.2±5.1 | 50 | – | NM | – | 2.2±1.2 |
| ADPKD (n=6) | 48.7±5.5 | 50 | 2–3 | 47.5±4.2 | 1101±346 | 3.0±1.4 | |
| Confirmation cohort 1 | Healthy (n=6) | 49.7±3.5 | 50 | – | NM | – | 0.5±0.1 |
| CKDa (n=6) | 48.8±3.2 | 50 | 3 | 45.7±3.5 | – | 8.2±4.8 | |
| ADPKD (n=6) | 50.3±3.1 | 50 | 2–3 | 49.8±4.5 | 1481±223 | 2.3±0.4 | |
| Confirmation cohort 2 | CKD (n=4) | 44.3±2.1 | 75 | 3 | 48.5±4.6 | – | 6.5±6.0 |
| ADPKD (n=5) | 47.6±3.3 | 60 | 2–3 | 44.2±10.9 | 1258±355 | 6.0±2.8 | |
| Confirmation cohort 3 | Healthy (n=4) | 30.0±0.7 | 50 | – | NM | – | 6.3±1.8 |
| ADPKD (n=6) | 27.8±2.0 | 50 | 1 | 109.8±4.3 | 622.3±48.2 | 7.5±2.0 | |
| ADPKD (n=11) | 43.6±1.8 | 45 | 2–4 | 45.1±3.8 | 1475±297.4 | 2.7±1.3 |
The eGFR was calculated by the four-variable Modification of Diet in Renal Disease formula. HtKTV, height-adjusted total kidney volume; UAlb, urinary albumin; –, not applicable; NM, not measured.
CKD due to hypertensive nephropathy in all patients.
Qualitative Comparison of the Urinary Proteome: Whole Urine versus uEVs
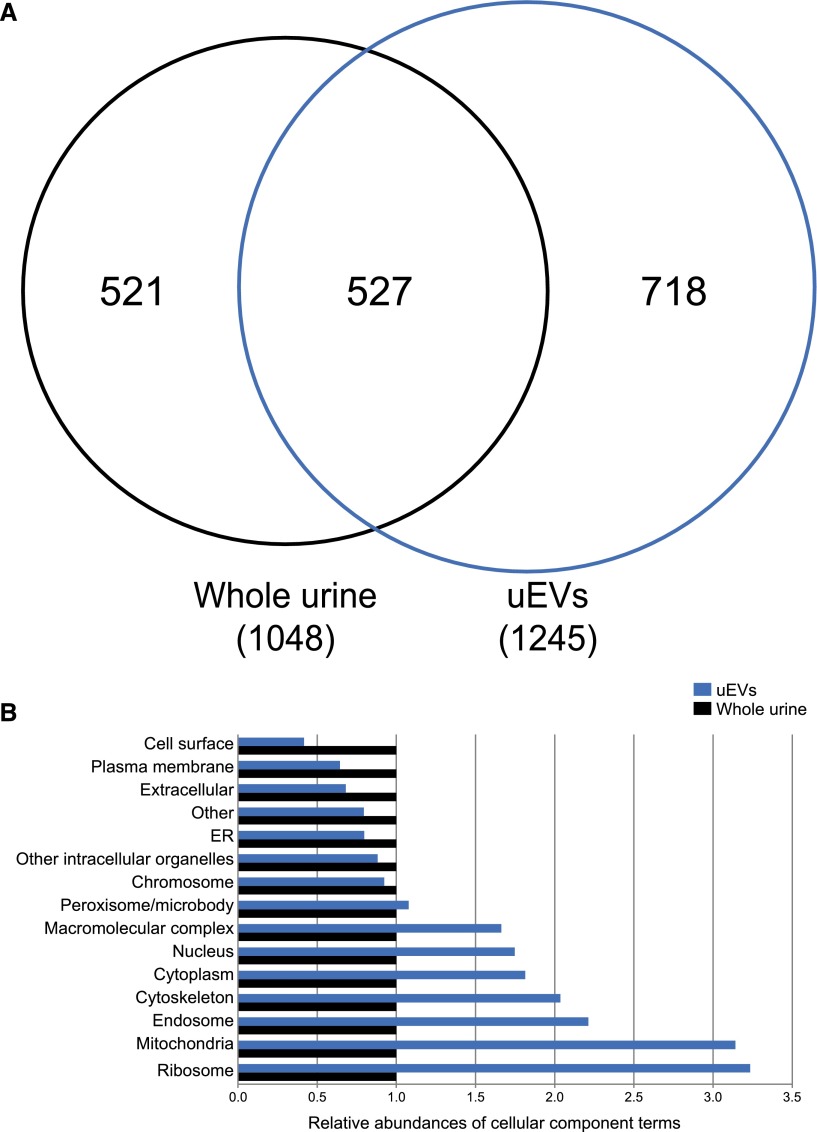
Figure 2A shows that 1048 proteins were identified in whole urine and 1245 proteins were identified in uEVs, of which 527 overlapped (see www.proteomexchange.org, identifier PXD003298, for a list of all proteins). The total number of identified proteins in urine was therefore 1766. Of interest, although whole urine still contained uEVs, 718 proteins were identified only in uEVs. This suggests that isolation of uEVs results in a different set of proteins not found in whole urine. Figure 2B characterizes how the unique proteins distribute to the different cellular components. Whole urine showed more cell surface, plasma membrane, and extracellular proteins, whereas uEVs showed more cytoplasmic, cytoskeletal, endosomal, and mitochondrial proteins. Of the 517 unique proteins in whole urine, the majority (389 proteins [75%]) had a molecular mass below the cutoff for glomerular filtration (<70 kDa).12 We also performed a qualitative comparison to identify over-represented pathways in whole urine and uEVs of patients with ADPKD (Table 2).13 Using the Database for Annotation, Visualization, and Integrated Discovery (DAVID) annotation tool (National Institute of Allergy and Infectious Diseases, Bethesda, MD),14 we identified that significantly over-represented pathways in ADPKD-uEVs consisted of actin-related processes and immune system processes, including complement activation. The latter finding was confirmed by an analysis using the Kyoto Encyclopedia of Genes and Genomes (KEGG), which also indicated that "complement and coagulation cascades" (hsa04610) were over-represented in ADPKD (37 proteins; P=0.01).
Figure 2.
Number of identified proteins and their cellular localization. (A) Venn diagram showing that uEVs contained a different set of unique proteins compared with whole urine. (B) Comparison of the cellular components to which the unique proteins identified whole urine (n=521) and uEVs (n=718) belong. For comparison, whole urine is set at a relative abundance of 1. ER, endoplasmic reticulum.
Table 2.
Gene Ontology biologic process terms overrepresented in uEVs and whole urine of patients with ADPKD
| Biologic Process | GO Numbersa | No. of Proteins |
|---|---|---|
| Urinary extracellular vesicles | ||
| Actin filament-based process | 0030029, 0030832, 0030036, 0008064, 0030833 | 60 |
| Lymphocyte-mediated immunity | 0002449 | 25 |
| Activation of plasma proteins involved in acute inflammatory response | 0002541 | 24 |
| Adaptive immune response | 0002250, 0002460 | 24 |
| Complement activation | 0006956 | 23 |
| Oxidation reduction | 0055114 | 81 |
| Positive regulation of hydrolase activity | 0051345 | 22 |
| Regulation of protein polymerization | 0032271 | 22 |
| Whole urine | ||
| Innate immune response | 0045087, 0006955, 0050778, 0002252 | 107 |
| Programmed cell death | 0012501, 0016265, 0008219 | 48 |
| Response to extracellular stimulus | 0009991, 0031667 | 29 |
| Carbohydrate catabolic process | 0016052 | 28 |
| Proteolysis | 0006508 | 93 |
P≤0.05 for all GO-terms as calculated by DAVID annotation tool.14 P≤0.05 is considered strongly enriched. GO, Gene Ontology.
Several GO terms were combined if processes were similar and directly linked.
Quantitative Proteomics of ADPKD-uEVs
We performed quantitative proteomics in the identification cohort and confirmation cohort 1 in order to select proteins that were consistently higher or lower in uEVs of patients with ADPKD and not related to CKD (Figure 1). Table 3 shows the 30 proteins with consistently higher abundance in ADPKD-uEVs and the four proteins with lower abundance, including the ratios for the mean ion intensities (ratios were not calculated if proteins in one of the control groups were absent or not very abundant). Among the identified proteins were the actin-modulating protein villin-1, as well as plakins such as envoplakin and periplakin. Complement-related proteins, including complement C3 and C9, were also more abundant in ADPKD-uEVs.
Table 3.
Proteins more and less abundant in uEVs of patients with ADPKD
| Group/Protein | Group 1 (versus Healthy)a | Group 2 (versus Healthy)a | Group 2 (versus CKD)a |
|---|---|---|---|
| More abundant | |||
| Plakins | |||
| Desmoplakin | 4.4 | NC | NC |
| Envoplakinb,c | 12.7 | 2.2 | NC |
| Periplakinb | 10.8 | 2.0 | NC |
| Complement | |||
| Complement C3b | 2.5 | 13.8 | 7.4 |
| Complement C5 | 3.9 | NC | 74.8 |
| Complement C4-B | 3.1 | 5.9 | 4.3 |
| Complement C9b | 7.5 | 10.2 | 5.8 |
| Complement factor B | 13.7 | 20.3 | 8.5 |
| Complement C1q subcomponent subunit A | 2.0 | NC | NC |
| Glycoproteins | |||
| Protein tweety homolog 3c | 2.2 | 2.1 | 2.5 |
| Isoform 2 of solute carrier family 22 member 13c | 5.4 | 2.2 | N.C. |
| V-set domain-containing T cell activation inhibitor 1 | 3.1 | 2.45 | 3.09 |
| Retinoic acid-induced protein 3c | 6.6 | 2.15 | 3.45 |
| Pigment epithelium-derived factor | 6.0 | 5.23 | 8.27 |
| Heparin cofactor 2 | 2.1 | 30.32 | NC |
| Inter-α-trypsin inhibitor heavy chain H1 | 3.2 | NC | 21.69 |
| Miscellaneous | |||
| Villin-1b,c | 3.0 | 2.4 | 11.8 |
| Tyrosine-protein phosphatase nonreceptor type 13c | 2.6 | 2.36 | NC |
| Soluble of catechol O-methyltransferasec | 2.1 | 4.10 | 2.98 |
| Protein crumbs homolog 3c | 2.6 | NC | NC |
| Aconitate hydratase, mitochondrialc | 3.0 | 3.05 | NC |
| Apolipoprotein A-IVc | 2.6 | 4.30 | 2.82 |
| Cysteine-rich C-terminal protein 1c | 15.8 | 13.05 | NC |
| Glycogen phosphorylase, brain form | 4.1 | 2.03 | NC |
| Angiotensinogen | 10.5 | 11.70 | 9.95 |
| Calpain-5c | 2.3 | 2.1 | 9.0 |
| EH domain-containing protein 4 | 2.6 | 2.2 | 15.1 |
| γ-synuclein | 2.2 | 3.4 | NC |
| Prothrombin | 6.0 | 3.96 | 2.82 |
| Plasminogen | 23.6 | 4.84 | 2.77 |
| Less abundant | |||
| Annexin A2 | 0.12 | 0.41 | 0.49 |
| Contactin-1 | 0.43 | 0.26 | 0.14 |
| Syndecan-4c | 0.40 | 0.08 | 0.19 |
| Granulins OS | 0.34 | 0.50 | 0.23 |
NC, not calculated; EH, EPS15 homology.
Mean ion intensities were compared and are reported as ratios. No ratio was calculated (NC) if the protein was identified in patients with ADPKD but was absent in the healthy persons or patients with non-ADPKD CKD (or identified at very low levels).
These proteins were selected for confirmation and further characterization.
These proteins were not identified in whole urine.
Confirmation of Plakins and Complement in ADPKD-uEVs
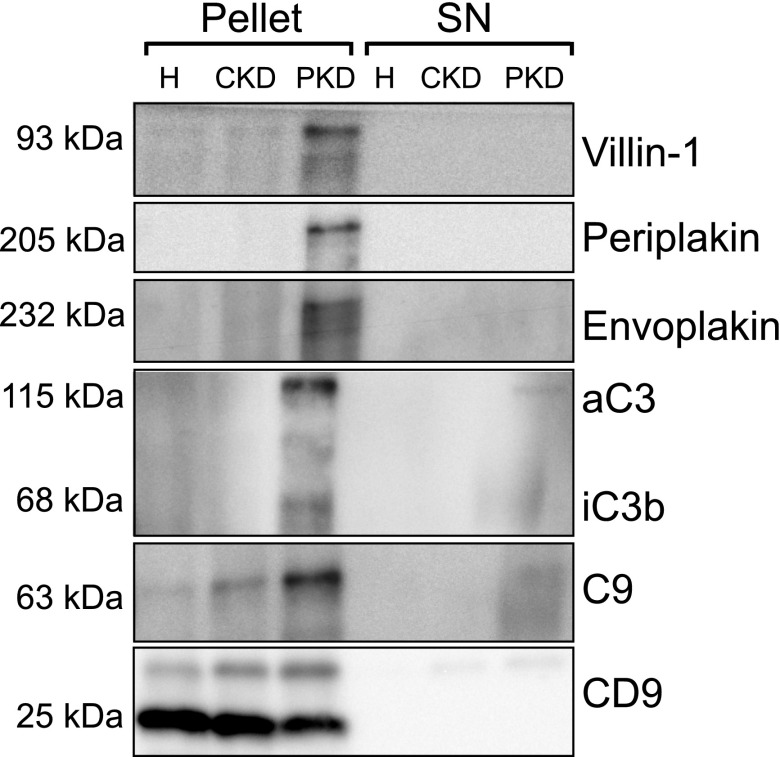
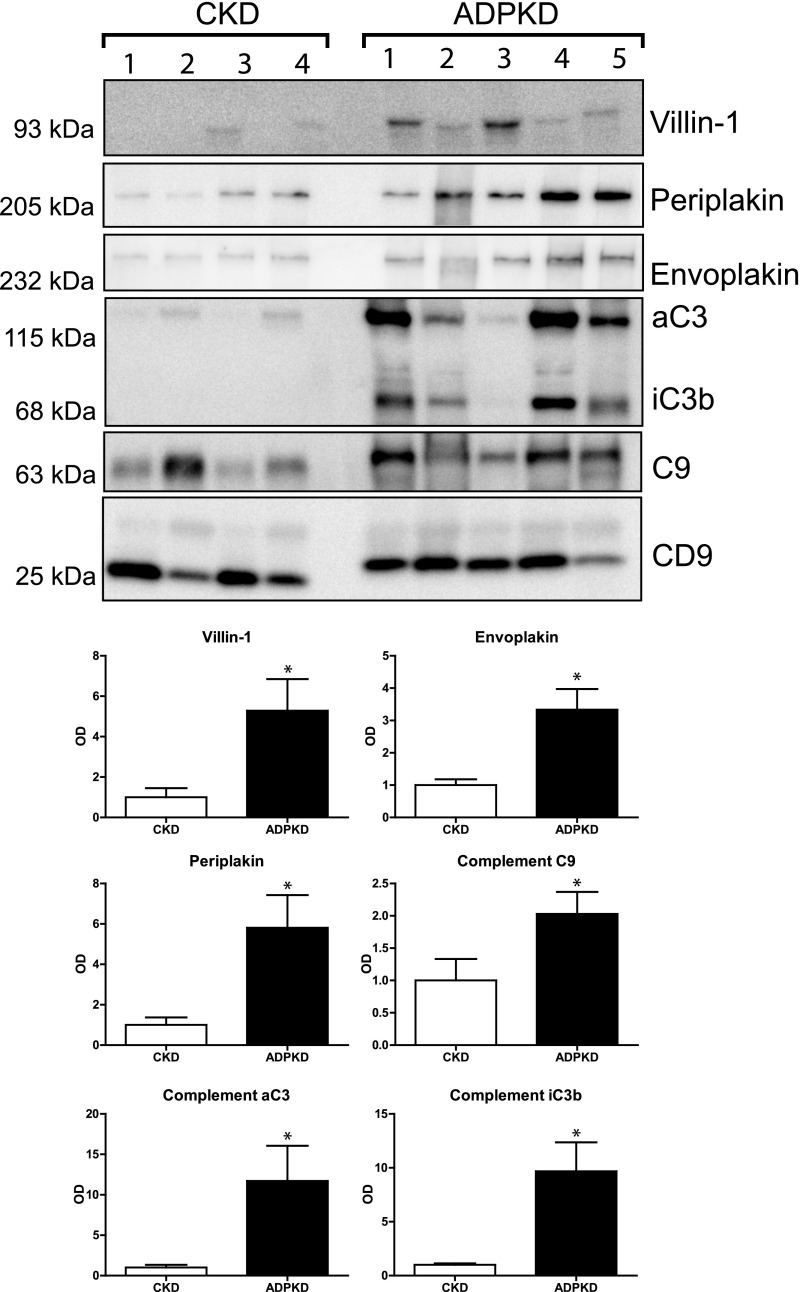
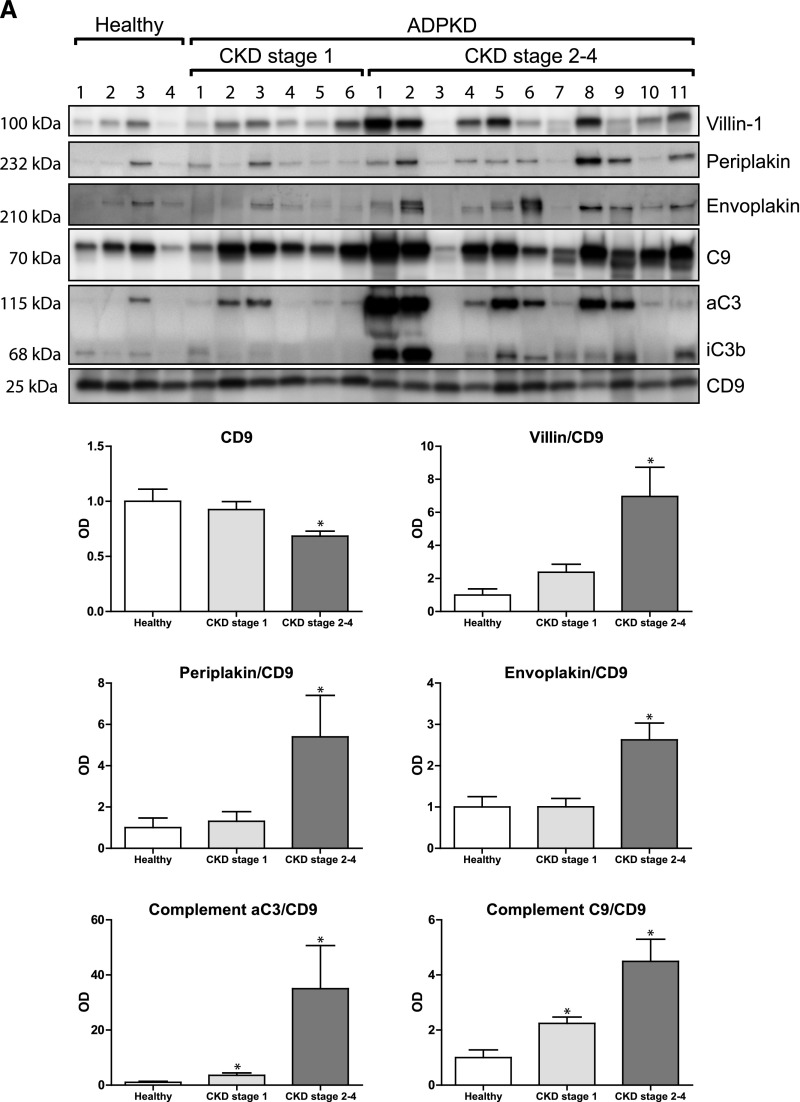
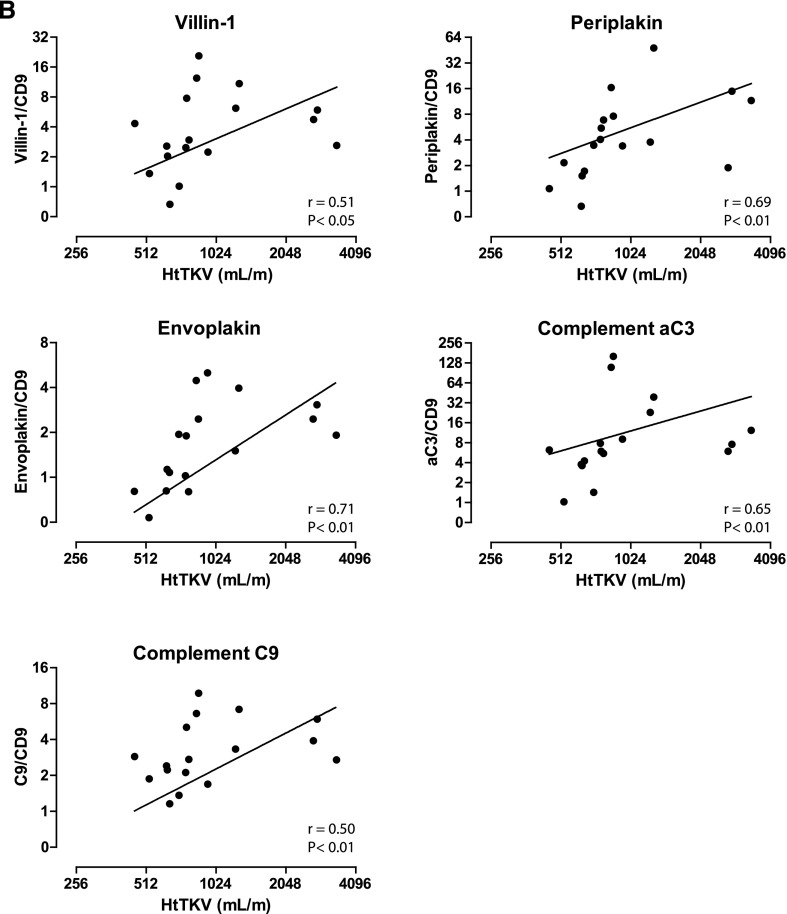
Five proteins that were more abundant in uEVs of patients with ADPKD were selected for confirmation and further characterization according to the pathway analysis and their possible involvement in the pathophysiology of ADPKD.15–19 These proteins included villin-1, envoplakin, periplakin, C3, and C9 (Table 3). To confirm the quantitative proteomics results, we immunoblotted the five proteins using the same pooled uEV samples as were used for the proteomics studies (Figures 1B and 3). Indeed, the abundance of all five proteins was higher for the ADPKD group than for the two other groups. Similar abundances of CD9 suggested similar number of vesicles in the three groups.20 The five proteins of interest were subsequently analyzed in uEVs from a third group of patients with ADPKD (Figure 1C) and compared with those from the CKD group (Figure 4). Again, this analysis confirmed the higher abundance of the five selected proteins in ADPKD-uEVs, but now also on an individual basis. Because our identification and confirmation cohorts 1 and 2 consisted of older patients who had ADPKD with CKD stages 2–3, we also analyzed our proteins of interest in a third confirmation cohort (Figure 1D) consisting of younger patients with ADPKD and preserved renal function and additional patients with APDKD who had CKD stages 2–4 (Figure 5). Because CD9 declined with progressive CKD, we analyzed the ratio between uEV protein abundance and CD9. Villin-1, periplakin, and envoplakin were increased only in progressive CKD, whereas complement was already increased in uEVs from patients with ADPKD who had preserved renal function. In addition, all five proteins correlated with height-adjusted total kidney volume (Figure 5B).
Figure 3.
Immunoblot confirmation of five candidate proteins. Immunoblot analysis of the five selected proteins using the same pooled urine as was used for quantitative proteomics in the validation group. The first three rows show results for isolated uEVs (pellet), while the last three rows show results for the supernatant (SN), which was used as negative control. Anti-complement C3 antibody recognizes the C3 α chain (aC3) and its split product, iC3b. H, healthy persons; PKD, polycystic kidney disease.
Figure 4.
Immunoblot analysis of proteins of interest in confirmation cohort 2. Immunoblot analysis comparing the proteins of interest between individual patients with CKD and ADPKD. uEVs were isolated from individual spot urine samples of patients with CKD and ADPKD (confirmation cohort 2). Anti-complement C3 antibody recognizes the C3 α chain (aC3) and its split product, iC3b. Error bars, SEM. *P<0.05.
Figure 5.
Immunoblot and total kidney volume analysis of proteins of interest in confirmation cohort 3. (A) Immunoblot analysis comparing the proteins of interest in uEVs from individual healthy persons, young patients with ADPKD and preserved renal function, and patients with ADPKD and CKD stages 2–4. (B) Correlations of abundance of the uEV proteins of interest compared with height-adjusted total kidney volume (HtTKV). Spearman Rho S and P values are shown. Error bars, SEM. *P<0.05.
Characterization of Plakins and Complement in uEVs
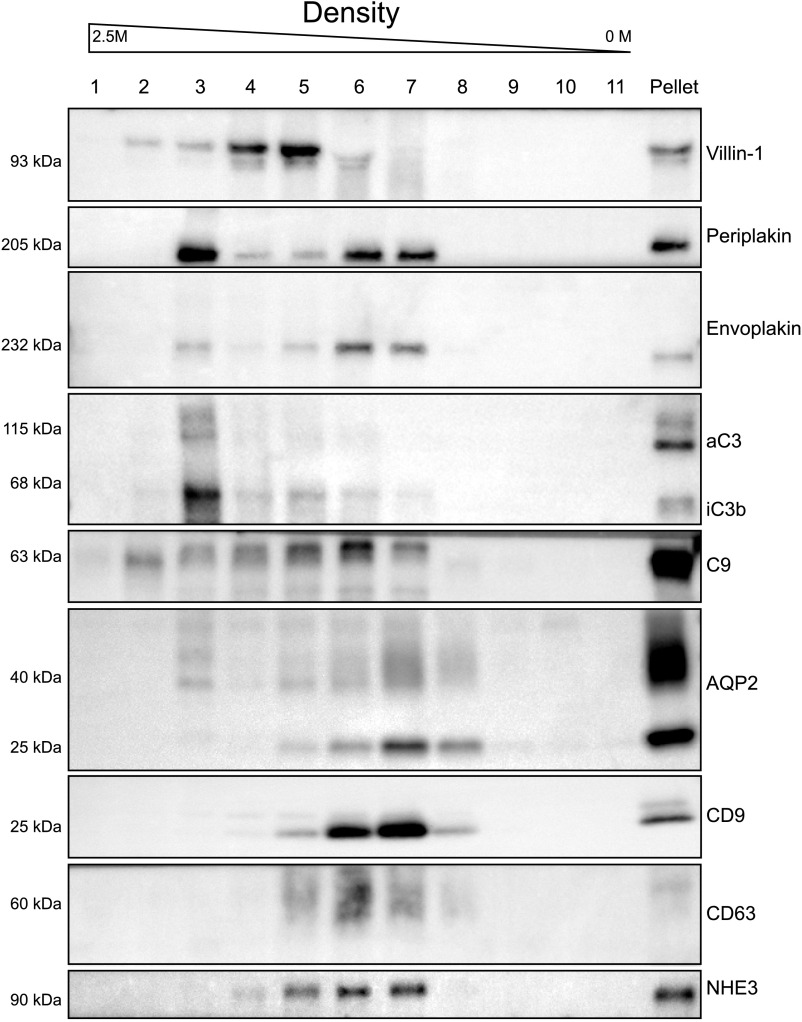
We further characterized the five proteins by density-based fractionation using sucrose (Figure 6). This was done to analyze the type of vesicles with which the proteins associate, using CD9 and CD63 as markers for exosomes20 and NHE3 and AQP2 as markers for vesicles derived from the proximal tubule or collecting duct, respectively. An additional advantage of density-based fractionation is that protein complexes and large protein aggregates may be coisolated during ultracentrifugation but do not float on a sucrose gradient.21 This analysis suggested the presence of two populations of vesicles. More specifically, periplakin, envoplakin, villin-1, and C9 were detected in CD9- and CD63-positive fractions, suggesting their presence in exosomes.20 All six proteins were also detected in the fractions representing denser vesicles (fractions 2–4). The presence of AQP2 in these denser vesicles (mainly in fraction 3) suggests that some of these vesicles are derived from the collecting duct.22
Figure 6.
Sucrose gradient fractionation. Sucrose gradient fractionation was performed to analyze the type of vesicles with which the identified proteins associate. Fraction 1 represents the most dense fraction. In addition to the six proteins of interest, we also analyzed CD9 and CD63 (markers for urinary exosomes) and NHE3 and AQP2 (markers for proximal tubule and collecting duct). "Pellet" refers to a part of the pooled ultracentrifugation pellet used for direct immunoblotting (positive control). Anti-complement C3 antibody recognizes the C3 α chain (aC3) and its split product, iC3b.
Increased Plakins and Complement in ADPKD Mouse Models
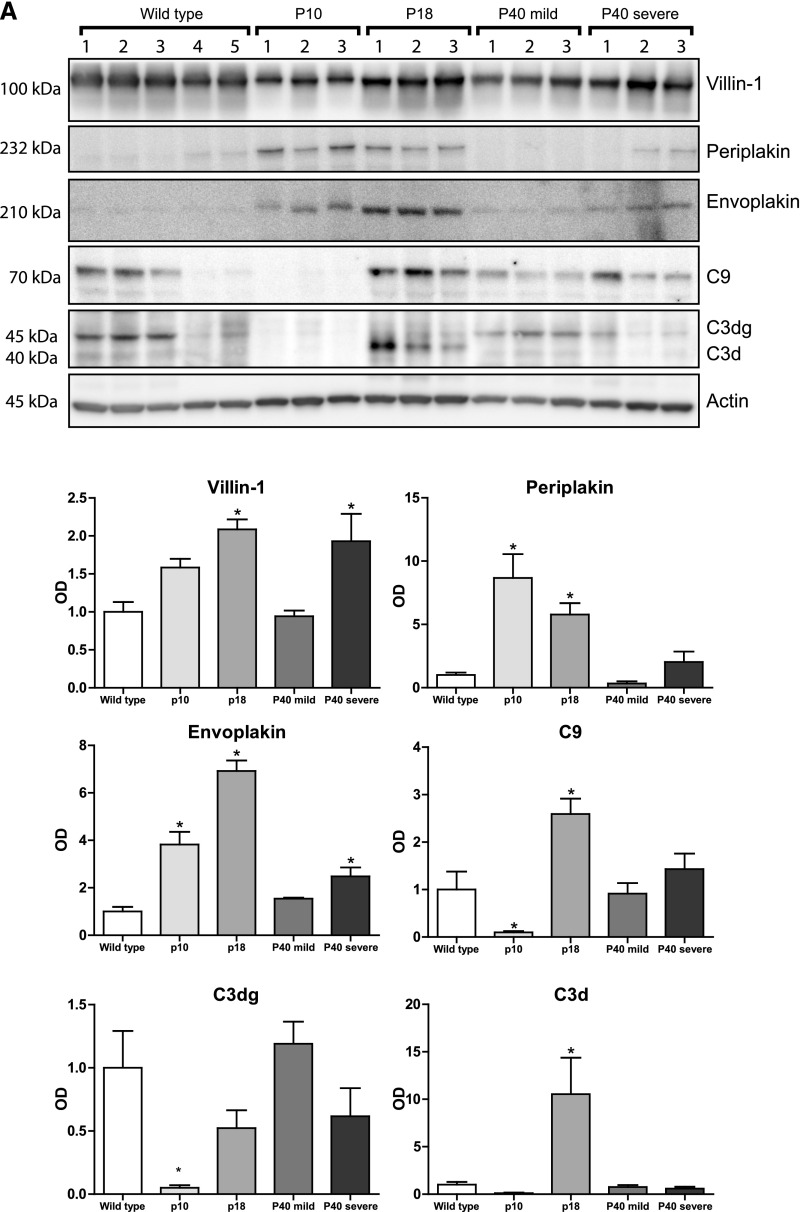
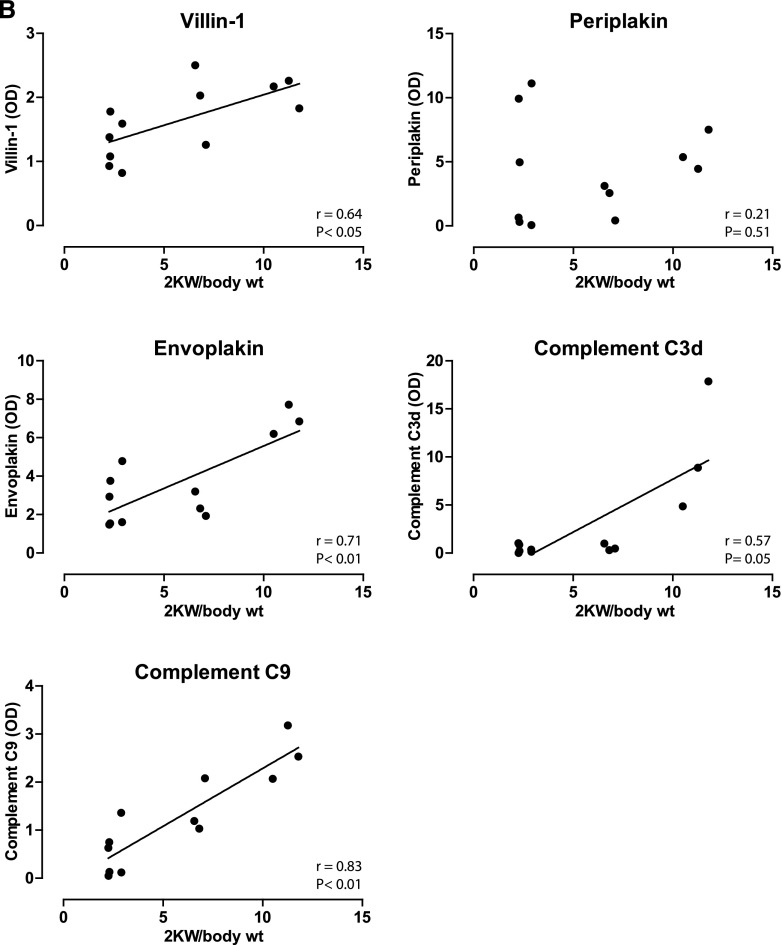
To analyze whether the proteins of interest were also more abundant in polycystic kidneys, we used three variants of kidney-specific-tamoxifen-inducible Pkd1-deletion (iKsp-Pkd1del) mice (Supplemental Table 2).23 Pkd1 inactivation in these mice was induced at postnatal day (P) 10, 18, or 40, which results in distinct PKD phenotypes. The P10 model rapidly develops cysts primarily from distal tubules and collecting ducts,24 whereas the P40 model has a much slower progression, with cysts derived primarily from the proximal part of the nephron and to a lesser extent from distal tubules and collecting ducts.25 The P40 mice were euthanized after 117 or 140 days, resulting in a mild (normal blood urea) or severe (elevated blood urea) phenotype. In addition, P18- iKsp-Pkd1del mice make up an adult onset model with cysts from all different tubular segments (W.N. Leonhard, D.J. Peters, unpublished observations). The abundance of both periplakin and envoplakin was significantly higher in the P10, P18, and, to a lesser extent, P40 severe models (Figure 7A). Villin-1 was increased in P18 and P40. Complement C3d (the final breakdown product of activated C3) and C9 were increased in the P18 model but decreased in P10. Of note, the lower abundances of C3d and C9 may be related to age rather than to ADPKD (wild-type mice 4 and 5 were younger than the other wild-type mice but had the same age as the P10 mice) (Supplemental Table 2). No changes in C3 and C9 were found in the P40 models. Furthermore, we found that protein abundance correlated positively with total kidney weight for villin-1, envoplakin, and complement C3d and C9 (Figure 7B).
Figure 7.
Immunoblot analysis of proteins of interest in mouse model of ADPKD. (A) Immunoblot analysis comparing the proteins of interest in kidney homogenates of three inducible ADPKD mouse models. "P" indicates the postnatal day at which the Pkd1 gene was inactivated with tamoxifen. The P40 mice were euthanized at two different time points, producing a mild (normal blood urea) or severe (elevated blood urea) phenotype. Each ADPKD group was compared with wild type. (B) Correlations between kidney weights and kidney abundances of villin-1, envoplakin, periplakin, and complements C3d and C9. Spearman Rho and P values are shown. *P<0.05. 2KW/body wt, 2 kidney weight–to–body weight ratio.
Discussion
uEVs are increasingly used to identify noninvasive markers of disease, including ADPKD. Here, we show higher abundances of complement-related proteins (C3 and C9) and cytoskeletal proteins (villin-1 and plakins) in ADPKD-uEVs and suggest that these proteins may be used as disease markers. Complement C3 and C9 increased early in the disease, whereas the cytoskeletal proteins increased with more progressive disease. Proteomic analyses of uEVs should be interpreted critically because many aspects of uEVs remain unclear.5 However, we believe the strengths of the approach in this study were as follows: (1) Two complementary proteomics approaches were used to identify proteins of interest, (2) the proteins of interest were higher in four independent groups of patients with ADPKD, (3) results were compared with non-ADPKD CKD-uEVs to exclude proteins related to kidney function decline in general, (4) the proteins of interest correlate to total kidney volume, and (5) the proteins of interest were also increased in mouse models of ADPKD.
The identification of villin-1, plakins, and complement in uEVs of patients with ADPKD may be biologically plausible. Villin-1 is an actin-modifying protein involved in cell morphology, actin reorganization, and cell motility; in the kidney, it is mainly expressed in the brush border of the proximal tubules.26 Polycystin-1 is implicated in the regulation of actin cytoskeleton organization, migration, and cell adhesion.27 Defects in polycystin-1 results in cell-polarity defects28 and aberrant cell growth,29 which may explain the increase of villin-1.
The desmosomal plaque consists of several transmembrane proteins belonging to the cadherin family (also called plakins30). Desmosomes form an adhesive junction at the basolateral membrane and are vital for stabilizing the epithelial sheet. Polycystin-1 is associated with desmosomal proteins and is required for the establishment of cell polarity.19,31 In ADPKD, polycystin-1 no longer colocalizes with desmosomes, leading to mispolarization of desmosomal proteins from the basolateral side to the apical domain.17 This may explain why we found higher abundances of plakins in uEVs of patients with ADPKD.
Complement activation has previously been implicated in both autosomal recessive polycystic kidney disease and ADPKD.15,16,18 Gene expression analysis in cpk mice, a model for polycystic kidney disease, identified the innate immune response to be highly activated, specifically complement factors such as C3.16 In humans, cyst epithelial cells produce complement components, including C3 and C9, as shown in immunohistochemical staining.15,18 Many of the complement components are abundantly present in human ADPKD kidney cyst fluid.32,33 Furthermore, inhibition of the complement system by rosmarinic acid in Pkd1−/− mice and Han:SPRD Cy/+ rats reduced cyst growth,18 suggesting that the complement pathway is involved in the pathogenesis of ADPKD. We identified nearly all complement proteins in uEVs, both from the classic (C1q, C2, and C4) and alternative (complement factors B and D) pathways, along with inhibitors of this system (plasma protease C1 inhibitor, C4-binding protein, and complement factor B). Complement C9 colocalized with the exosomal markers CD9 and CD63, suggesting its presence in exosomes. However, complement C3 was mainly identified in a denser fraction, as was previously demonstrated.34 Other studies also reported the presence of complement in uEVs34–36 and circulating EVs.37,38
It is unclear why complement is isolated in ultracentrifuged urine and whether complement is physically associated with uEVs. In theory, complement may be filtered from plasma and end up nonspecifically attached to uEVs. However, most complement proteins are large (the majority exceeding 70 kDa) and therefore unlikely to be filtered. A more plausible explanation is the local production and excretion of complement by renal epithelial cells,39 possibly to opsonize pathogens as a defense mechanism for urinary tract infections.40,41 The higher abundance of components of the complement system in uEVs of patients with ADPKD may reflect increased production by renal cyst epithelial cells.
Recently, Hogan et al. also studied uEVs as a source of biomarkers for ADPKD.42 In patients with a PKD1 mutation, they found polycystin-1 and polycystin-2 to be decreased and transmembrane protein 2 (TMEM2) to be increased. The ratios between the two polycystins and TMEM2 allowed differentiation between patients with ADPKD and healthy persons. In our study, polycystins were not identified in our first quantitative proteomics experiment (identification cohort) and therefore were not selected for further confirmation. In the second analysis (confirmation cohort 1), polycystin-2 was identified and was 83% lower in patients with ADPKD than in healthy persons, but it was not identified in the CKD group. Polycystin-1 was identified only in the control group, and TMEM2 was not identified at all.
We propose the following explanations for these differences. First, to analyze the complete spectrum of vesicles, we did not fractionate uEVs, whereas Hogan et al. isolated polycystin-positive uEVs.42 This difference in isolation methods may explain why polycystin-1 and polycystin-2 were five- to seven-fold more abundant in the study by Hogan et al.42 Second, our patients with ADPKD had a lower eGFR. In addition to the mutation, the decreasing eGFR may explain why we observed a larger decrease in polycystin-2 and failed to identify polycystin-1 in patients with ADPKD.
The reason to focus on uEVs is illustrated by the comparison of the urinary proteome of whole urine with that of uEVs (Figure 2). The proteins identified in whole urine by mass spectrometry primarily consisted of extracellular proteins with low molecular weight and were therefore most likely plasma derived.12 Although whole urine still contained uEVs, the isolation of uEVs yielded a set of 718 unique proteins that were primarily of intracellular origin. These differences underscore that the isolation of uEVs increases the identification rate of low-abundant proteins that are likely derived from renal epithelial cells. These proteins were not identified in whole urine, probably because they were masked by more abundant plasma-derived proteins. To our knowledge, only one study has compared these two proteomes, using less sensitive mass spectrometers (<100 identified proteins in each fraction).43 Gradient fractionation showed that all proteins were present in CD9+ and CD63+ vesicles, compatible with exosomes, but also revealed their presence in denser vesicles. These might be ectosomes from the glomerulus,34 but electron microscopy would be necessary to confirm this. The distinction in vesicle subtype is relevant because polycystin 1 and 2 are excreted in exosomes. This implies that selectively isolating CD9, CD63, or polycystin-positive vesicles may be a useful strategy to more specifically analyze disease-associated proteins.42
Our study has a number of limitations. Pooled urine was used for proteomics analysis to increase homogeneity, but this did not allow statistical analysis of the proteomics results. This was addressed by analyzing the candidate proteins in individual patients from a separate ADPDK group (Figures 4 and 5). Although the inclusion of two proteomics studies reduced the list of candidate proteins, we believe this approach excluded proteins related to intersubject variation and non-ADPKD CKD. It is unlikely that uEV-markers will be used as a diagnostic tool in ADPKD because the diagnosis can usually be established by family history, ultrasonography, or computed tomography.2 Therefore, to be clinically useful, uEV markers should correlate with disease progression or response to therapy. The proteins identified in this study should therefore be considered candidate markers and require further evaluation in larger prospective studies using serial urine samples.44 Unlike the complement proteins, villin-1 and the plakins appear unsuitable for early monitoring of ADPKD. They may be evaluated in more advanced stages of ADPKD, for example, for monitoring therapeutic response. Importantly, kidney injury unrelated to ADPKD may also increase complement in uEVs, although several studies have indicated that complement may play a more specific role in the disease.15,18 These aspects should be considered in future evaluation of the candidate proteins identified in this study.
In conclusion, we have demonstrated the advantage of uEVs to enrich the urinary proteome. We explored uEVs as potential biomarkers for ADPKD and identified several classes of proteins to be specifically increased, including plakins and components of the complement system. These findings warrant further investigation of these proteins as potential biomarkers in a larger prospective cohort.
Concise Methods
Participants and Isolation of uEVs
The Medical Ethics Committee of the Erasmus Medical Center approved this study (MEC-2012–313 and MEC-2013–370). Patients with ADPKD were recruited from the ongoing Developing Interventions to Halt Progression of ADPKD (DIPAK) 1 and DIPAK observational studies, which include patients with ADPKD who have preserved renal function as well as those with CKD stages 2–4.45 Genetic analysis was performed for all patients. To increase homogeneity, we included only patients with a confirmed PKD1 mutation (Supplemental Table 1). Two patients with a negative PKD2 mutation and an ADPKD phenotype were also considered to have a PKD1 mutation.46 Each individual patient was matched for age and sex to a healthy control (identification cohort) or matched for age, sex, and eGFR to a patient with CKD (confirmation cohorts 1 and 2). Additional inclusion criteria for the patients with CKD were the absence of ADPKD and minimal proteinuria (<1 g/10 mmol creatinine).
Previously, we successfully used spot urines for uEV analysis (normalized by urinary creatinine) and prefer this over 24-hour urine to limit protein degradation and the risk of incomplete collections.8 Therefore, second-morning spot urines were collected, a protease inhibitor (cOmplete, Roche Diagnostics, Indianapolis, IN) was added, and samples were immediately stored at −80°C until further processing. uEVs were isolated using high-speed centrifugation and ultracentrifugation (see Supplemental Data for complete protocol).8 Our protocol differed from a recent uEV study in ADPKD,42 which used density gradient fraction to enrich for PKD-positive uEVs. We did not use this approach because we were interested in all uEVs. A recent study compared different uEV isolation protocols and concluded they were comparable.47 Dithiothreitol was used in our protocol because this disrupts uromodulin, which may entrap uEVs,20 although it may also cause loss of certain uEV proteins. Obtained pellets were processed for mass spectrometry or solubilized in Laemmli buffer for immunoblot analysis. Supplemental Figure 2 shows a representative SDS-PAGE gel for three uEV samples stained with Coomassie blue.
Mass Spectrometry
Samples were prepared for mass spectrometry as described previously. Briefly, uEVs and acetone-precipitated whole urine were lysed and trypsinized. Tryptic peptides were fractionated by hydrophilic interaction liquid chromatography, and each fraction was then analyzed by liquid chromatography/mass spectrometry (MS). For quantitative dimethyl labeling of uEVs (identification cohort), desalting and reductive dimethylation were performed on the solid-phase extraction cartridge (as described elsewhere48) before peptide fractionation by hydrophilic interaction liquid chromatography. All liquid chromatography/tandem MS (MS/MS) analyses were performed on a Q Exactive mass spectrometer (Thermo Fisher Scientific, Rockford, IL). Each data collection cycle in the Q Exactive consisted of one full MS scan (300–1750 m/z) followed by 15 data-dependent tandem MS scans. The proteomics data have been submitted to the ProteomeXchange Consortium via the PRIDE PRoteomics IDEntifications partner repository with the dataset identifier PXD003298.49
Bioinformatics
Raw data files were processed and analyzed using Proteome Discoverer 1.4 (Thermo Fisher Scientific) or MaxQuant.50 MS/MS spectra were searched against the Uniprot database (taxonomy: Homo sapiens) with the following search parameters: 15-ppm precursor ion tolerance and 0.02-Da fragment ion tolerance, fully tryptic digestion, up to two missed cleavages allowed, posttranslational static modifications of 57.02146 Da on cysteine (carbamidomethyl), and dynamic modifications of 15.99491 Da on methionine (oxidation). For dimethylation-labeled uEV samples, 28.031 Da on lysine and the peptide N-terminus (light) and 32.056 Da on lysine and the peptide N-terminus (heavy) were added to the search parameters. The resulting data were analyzed using the DAVID bioinformatics tool to determine which Gene Ontology terms are overrepresented relative to the complete set of identified proteins. For this analysis, we excluded pathways that were similarly enriched in healthy persons or the CKD group. Gene Ontology terms were retrieved by the software tool for rapid annotation of proteins (STRAP, version 1.5.0.0).51
Immunoblotting and Sucrose Gradient Fractionation
The solubilized uEV pellet was preheated at 60°C for 15 minutes. SDS-PAGE was carried out on a 4%–20% gradient gel, and proteins were transferred to Trans-Blot Turbo (Bio-Rad, Hercules, CA). The membranes were blocked in 5% milk and were probed overnight at 4°C with the antibody of choice. The following antibodies were used: envoplakin (1:200; Santa Cruz Biotechnology, Santa Cruz, CA), periplakin (1:2000; Abcam, Inc., Cambridge, MA), complement C3 (1:1000; Abcam, Inc.), complement C9 (1:1000; Abcam, Inc.), villin-1 (anti-human: 1:10,000 [Abcam, Inc.]; anti-mouse: 1:1000 [Cell Signaling Technology, Danvers, MA]), CD9 (1:200; Santa Cruz Biotechnology) and CD63 (1:500; BD Biosciences, San Jose, CA), NHE3 (1:10,000; Stressmarq), and AQP2 (1:1000; Stressmarq). The antibodies against mouse C3dg, C3d, and C9 were generated by one of the investigators (C.V.K.).52 After three washes (3×10 minutes in TBS-Tween 20), membranes were incubated with the secondary antibody in 5% milk (1:3000; Thermo Fisher Scientific) for 1 hour and washed again. For visualization, blots were exposed to Pierce enhanced chemiluminescent substrate and measured by Uvitec Alliance 2.7 (Cambridge, United Kingdom). Chemiluminescence was quantified using ImageQuant TL (Life Sciences, version 8.1), background was subtracted, and ratios were measured in Excel (Microsoft Corp., Redmond, WA). For the sucrose gradient fractionation, we used spot urine samples from four patients with ADPKD. After pooling the samples and obtaining the uEV pellets, we ultracentrifuged uEVs overnight on top of a 2.5–0.25-M sucrose gradient, corresponding to a density of 1.32–1.03 g/m3. Each fraction was carefully removed, diluted in PBS, and ultracentrifuged again to obtain the pellet. Fractions were solubilized in Laemmli buffer for immunoblot analysis.
Mouse Models of ADPKD
The local animal experimental committee of the Leiden University Medical Center and the Commission Biotechnology in Animals of the Dutch Ministry of Agriculture approved the animal experiments. The generation of the iKsp-Pkd1del mice and tamoxifen administration to these mice were described previously.23 On 3 consecutive days the mice received a tamoxifen dosage of 6 mg/kg at P10–12, 150 mg/kg at P18–20, or 200 mg/kg at P40-P42 (Supplemental Table 2). The P10 mice were euthanized at 33 days of age, at which point the mice have relatively severe PKD. The P18 and the P40 mice were euthanized at the onset of renal failure (defined as a blood urea level > 20 mmol/L, as assessed by Reflotron technology; Kerkhof Medical Service). An additional time point with mild PKD of the P40 mice (11 weeks after tamoxifen) was included. Protein extraction from these kidneys was performed as described previously.25
Statistical Analyses
Immunoblotting results were analyzed by t test or Mann–Whitney U test, as appropriate. A P value ≤0.05 was considered to represent a statistically significant difference. Gene ontology enrichment was calculated by the DAVID bioinformatic tool, which applies the Fisher exact test (P≤0.05 is considered strongly enriched).
Disclosures
None.
Supplementary Material
Acknowledgments
We thank Steven A. van der Schoot and Ngaisah Klar for their technical assistance.
E.J.H. is supported by grants from the Netherlands Organisation for Scientific Research (NWO, Veni 916.12.140) and the Dutch Kidney Foundation (KSP-14OK19).
The DIPAK Consortium is an inter-university collaboration in The Netherlands that is established to study ADPKD and to develop rational treatment strategies for this disease. The DIPAK Consortium is sponsored by the Dutch Kidney Foundation (grant CP10.12). Principal investigators are (in alphabetical order): J.P.H. Drenth (Department of Gastroenterology and Hepatology, Radboudumc Nijmegen), J.W. de Fijter (Department of Nephrology, Leiden University Medicla Center [UMC]), R.T. Gansevoort (Department of Nephrology, UMC Groningen), M. Losekoot (Department of Human Genetics, Leiden UMC), E. Meijer (Department of Nephrology, UMC Groningen), D.J.M. Peters (Department of Human Genetics, Leiden UMC), F.W. Visser (Department of Nephrology, UMC Groningen), J. Wetzels (Department of Nephrology, Radboud UMC Nijmegen), and R. Zietse (Department of Internal Medicine, Erasmus MC Rotterdam).
This work is also part of the project Proteins at Work, a program of The Netherlands Proteomics Centre financed by The Netherlands Organization for Scientific Research as part of the National Roadmap Large-Scale Research Facilities of The Netherlands (project number 184.032.201).
Footnotes
Published online ahead of print. Publication date available at www.jasn.org.
This article contains supplemental material online at http://jasn.asnjournals.org/lookup/suppl/doi:10.1681/ASN.2015090994/-/DCSupplemental.
References
- 1.Neumann HP, Jilg C, Bacher J, Nabulsi Z, Malinoc A, Hummel B, Hoffmann MM, Ortiz-Bruechle N, Glasker S, Pisarski P, Neeff H, Krämer-Guth A, Cybulla M, Hornberger M, Wilpert J, Funk L, Baumert J, Paatz D, Baumann D, Lahl M, Felten H, Hausberg M, Zerres K, Eng C Else-Kroener-Fresenius-ADPKD-Registry : Epidemiology of autosomal-dominant polycystic kidney disease: An in-depth clinical study for south-western Germany. Nephrol Dial Transplant 28: 1472–1487, 2013 [DOI] [PubMed] [Google Scholar]
- 2.Ong AC, Devuyst O, Knebelmann B, Walz G ERA-EDTA Working Group for Inherited Kidney Diseases : Autosomal dominant polycystic kidney disease: The changing face of clinical management. Lancet 385: 1993–2002, 2015 [DOI] [PubMed] [Google Scholar]
- 3.Gould SJ, Raposo G: As we wait: Coping with an imperfect nomenclature for extracellular vesicles. J Extracell Vesicles 2: 2, 2013 [DOI] [PMC free article] [PubMed] [Google Scholar]
- 4.Dear JW, Street JM, Bailey MA: Urinary exosomes: A reservoir for biomarker discovery and potential mediators of intrarenal signalling. Proteomics 13: 1572–1580, 2013 [DOI] [PubMed] [Google Scholar]
- 5.Salih M, Zietse R, Hoorn EJ: Urinary extracellular vesicles and the kidney: Biomarkers and beyond. Am J Physiol Renal Physiol 306: F1251–F1259, 2014 [DOI] [PubMed] [Google Scholar]
- 6.van Balkom BW, Pisitkun T, Verhaar MC, Knepper MA: Exosomes and the kidney: Prospects for diagnosis and therapy of renal diseases. Kidney Int 80: 1138–1145, 2011 [DOI] [PMC free article] [PubMed] [Google Scholar]
- 7.Pisitkun T, Shen RF, Knepper MA: Identification and proteomic profiling of exosomes in human urine. Proc Natl Acad Sci U S A 101: 13368–13373, 2004 [DOI] [PMC free article] [PubMed] [Google Scholar]
- 8.van der Lubbe N, Jansen PM, Salih M, Fenton RA, van den Meiracker AH, Danser AH, Zietse R, Hoorn EJ: The phosphorylated sodium chloride cotransporter in urinary exosomes is superior to prostasin as a marker for aldosteronism. Hypertension 60: 741–748, 2012 [DOI] [PubMed] [Google Scholar]
- 9.Tanner GA, Gretz N, Connors BA, Evan AP, Steinhausen M: Role of obstruction in autosomal dominant polycystic kidney disease in rats. Kidney Int 50: 873–886, 1996 [DOI] [PubMed] [Google Scholar]
- 10.Grantham JJ, Geiser JL, Evan AP: Cyst formation and growth in autosomal dominant polycystic kidney disease. Kidney Int 31: 1145–1152, 1987 [DOI] [PubMed] [Google Scholar]
- 11.Hogan MC, Manganelli L, Woollard JR, Masyuk AI, Masyuk TV, Tammachote R, Huang BQ, Leontovich AA, Beito TG, Madden BJ, Charlesworth MC, Torres VE, LaRusso NF, Harris PC, Ward CJ: Characterization of PKD protein-positive exosome-like vesicles. J Am Soc Nephrol 20: 278–288, 2009 [DOI] [PMC free article] [PubMed] [Google Scholar]
- 12.Lote CJ: Principles of Renal Physiology, New York, Springer, 2012 [Google Scholar]
- 13.Pisitkun T, Gandolfo MT, Das S, Knepper MA, Bagnasco SM: Application of systems biology principles to protein biomarker discovery: Urinary exosomal proteome in renal transplantation. Proteomics Clin Appl 6: 268–278, 2012 [DOI] [PMC free article] [PubMed] [Google Scholar]
- 14.Dennis G Jr, Sherman BT, Hosack DA, Yang J, Gao W, Lane HC, Lempicki RA: DAVID: Database for Annotation, Visualization, and Integrated Discovery. Genome Biol 4: 3, 2003 [PubMed] [Google Scholar]
- 15.Mrug M, Zhou J, Mrug S, Guay-Woodford LM, Yoder BK, Szalai AJ: Complement C3 activation in cyst fluid and urine from autosomal dominant polycystic kidney disease patients. J Intern Med 276: 539–540, 2014 [DOI] [PubMed] [Google Scholar]
- 16.Mrug M, Zhou J, Woo Y, Cui X, Szalai AJ, Novak J, Churchill GA, Guay-Woodford LM: Overexpression of innate immune response genes in a model of recessive polycystic kidney disease. Kidney Int 73: 63–76, 2008 [DOI] [PubMed] [Google Scholar]
- 17.Silberberg M, Charron AJ, Bacallao R, Wandinger-Ness A: Mispolarization of desmosomal proteins and altered intercellular adhesion in autosomal dominant polycystic kidney disease. Am J Physiol Renal Physiol 288: F1153–F1163, 2005 [DOI] [PMC free article] [PubMed] [Google Scholar]
- 18.Su Z, Wang X, Gao X, Liu Y, Pan C, Hu H, Beyer RP, Shi M, Zhou J, Zhang J, Serra AL, Wüthrich RP, Mei C: Excessive activation of the alternative complement pathway in autosomal dominant polycystic kidney disease. J Intern Med 276: 470–485, 2014 [DOI] [PubMed] [Google Scholar]
- 19.Scheffers MS, van der Bent P, Prins F, Spruit L, Breuning MH, Litvinov SV, de Heer E, Peters DJ: Polycystin-1, the product of the polycystic kidney disease 1 gene, co-localizes with desmosomes in MDCK cells. Hum Mol Genet 9: 2743–2750, 2000 [DOI] [PubMed] [Google Scholar]
- 20.Fernández-Llama P, Khositseth S, Gonzales PA, Star RA, Pisitkun T, Knepper MA: Tamm-Horsfall protein and urinary exosome isolation. Kidney Int 77: 736–742, 2010 [DOI] [PMC free article] [PubMed] [Google Scholar]
- 21.Thery C, Amigorena S, Raposo G, Clayton A: Isolation and characterization of exosomes from cell culture supernatants and biological fluids. Curr Protoc Cell Biol Chapter 3: Unit 3.22, 2006 [DOI] [PubMed] [Google Scholar]
- 22.Hoorn EJ, Hoffert JD, Knepper MA: Combined proteomics and pathways analysis of collecting duct reveals a protein regulatory network activated in vasopressin escape. J Am Soc Nephrol 16: 2852–2863, 2005 [DOI] [PMC free article] [PubMed] [Google Scholar]
- 23.Lantinga-van Leeuwen IS, Leonhard WN, van der Wal A, Breuning MH, de Heer E, Peters DJ: Kidney-specific inactivation of the Pkd1 gene induces rapid cyst formation in developing kidneys and a slow onset of disease in adult mice. Hum Mol Genet 16: 3188–3196, 2007 [DOI] [PubMed] [Google Scholar]
- 24.Meijer E, Gansevoort RT, de Jong PE, van der Wal AM, Leonhard WN, de Krey SR, van den Born J, Mulder GM, van Goor H, Struck J, de Heer E, Peters DJ: Therapeutic potential of vasopressin V2 receptor antagonist in a mouse model for autosomal dominant polycystic kidney disease: Optimal timing and dosing of the drug. Nephrol Dial Transplant 26: 2445–2453, 2011 [DOI] [PubMed] [Google Scholar]
- 25.Leonhard WN, van der Wal A, Novalic Z, Kunnen SJ, Gansevoort RT, Breuning MH, de Heer E, Peters DJ: Curcumin inhibits cystogenesis by simultaneous interference of multiple signaling pathways: In vivo evidence from a Pkd1-deletion model. Am J Physiol Renal Physiol 300: F1193–F1202, 2011 [DOI] [PubMed] [Google Scholar]
- 26.Tomar A, George S, Kansal P, Wang Y, Khurana S: Interaction of phospholipase C-gamma1 with villin regulates epithelial cell migration. J Biol Chem 281: 31972–31986, 2006 [DOI] [PubMed] [Google Scholar]
- 27.Castelli M, De Pascalis C, Distefano G, Ducano N, Oldani A, Lanzetti L, Boletta A: Regulation of the microtubular cytoskeleton by Polycystin-1 favors focal adhesions turnover to modulate cell adhesion and migration. BMC Cell Biol 16: 15, 2015 [DOI] [PMC free article] [PubMed] [Google Scholar]
- 28.Castelli M, Boca M, Chiaravalli M, Ramalingam H, Rowe I, Distefano G, Carroll T, Boletta A: Polycystin-1 binds Par3/aPKC and controls convergent extension during renal tubular morphogenesis. Nat Commun 4: 2658, 2013 [DOI] [PMC free article] [PubMed] [Google Scholar]
- 29.Wilson PD: Aberrant epithelial cell growth in autosomal dominant polycystic kidney disease. Am J Kidney Dis 17: 634–637, 1991 [DOI] [PubMed] [Google Scholar]
- 30.Jefferson JJ, Leung CL, Liem RK: Plakins: Goliaths that link cell junctions and the cytoskeleton. Nat Rev Mol Cell Biol 5: 542–553, 2004 [DOI] [PubMed] [Google Scholar]
- 31.Huan Y, van Adelsberg J: Polycystin-1, the PKD1 gene product, is in a complex containing E-cadherin and the catenins. J Clin Invest 104: 1459–1468, 1999 [DOI] [PMC free article] [PubMed] [Google Scholar]
- 32.Mason SB, Lai X, Bacallao RL, Blazer-Yost BL, Gattone VH, Wang KC, Witzmann FA: The biomarker enriched proteome of autosomal dominant polycystic kidney disease cyst fluid. Proteomics Clin Appl 3: 1247–1250, 2009 [DOI] [PMC free article] [PubMed] [Google Scholar]
- 33.Lai X, Bacallao RL, Blazer-Yost BL, Hong D, Mason SB, Witzmann FA: Characterization of the renal cyst fluid proteome in autosomal dominant polycystic kidney disease (ADPKD) patients. Proteomics Clin Appl 2: 1140–1152, 2008 [DOI] [PMC free article] [PubMed] [Google Scholar]
- 34.Hogan MC, Johnson KL, Zenka RM, Charlesworth MC, Madden BJ, Mahoney DW, Oberg AL, Huang BQ, Leontovich AA, Nesbitt LL, Bakeberg JL, McCormick DJ, Bergen HR, Ward CJ: Subfractionation, characterization, and in-depth proteomic analysis of glomerular membrane vesicles in human urine. Kidney Int 85: 1225–1237, 2014 [DOI] [PMC free article] [PubMed] [Google Scholar]
- 35.Gonzales PA, Pisitkun T, Hoffert JD, Tchapyjnikov D, Star RA, Kleta R, Wang NS, Knepper MA: Large-scale proteomics and phosphoproteomics of urinary exosomes. J Am Soc Nephrol 20: 363–379, 2009 [DOI] [PMC free article] [PubMed] [Google Scholar]
- 36.Kerjaschki D, Schulze M, Binder S, Kain R, Ojha PP, Susani M, Horvat R, Baker PJ, Couser WG: Transcellular transport and membrane insertion of the C5b-9 membrane attack complex of complement by glomerular epithelial cells in experimental membranous nephropathy. J Immunol 143: 546–552, 1989 [PubMed] [Google Scholar]
- 37.Renner B, Klawitter J, Goldberg R, McCullough JW, Ferreira VP, Cooper JE, Christians U, Thurman JM: Cyclosporine induces endothelial cell release of complement-activating microparticles. J Am Soc Nephrol 24: 1849–1862, 2013 [DOI] [PMC free article] [PubMed] [Google Scholar]
- 38.Arvidsson I, Ståhl AL, Hedström MM, Kristoffersson AC, Rylander C, Westman JS, Storry JR, Olsson ML, Karpman D: Shiga toxin-induced complement-mediated hemolysis and release of complement-coated red blood cell-derived microvesicles in hemolytic uremic syndrome. J Immunol 194: 2309–2318, 2015 [DOI] [PubMed] [Google Scholar]
- 39.Daha MR, van Kooten C: Is there a role for locally produced complement in renal disease? Nephrol Dial Transplant 15: 1506–1509, 2000 [DOI] [PubMed] [Google Scholar]
- 40.Hiemstra TF, Charles PD, Gracia T, Hester SS, Gatto L, Al-Lamki R, Floto RA, Su Y, Skepper JN, Lilley KS, Karet Frankl FE: Human urinary exosomes as innate immune effectors. J Am Soc Nephrol 25: 2017–2027, 2014 [DOI] [PMC free article] [PubMed] [Google Scholar]
- 41.Li K, Sacks SH, Sheerin NS: The classical complement pathway plays a critical role in the opsonisation of uropathogenic Escherichia coli. Mol Immunol 45: 954–962, 2008 [DOI] [PubMed] [Google Scholar]
- 42.Hogan MC, Bakeberg JL, Gainullin VG, Irazabal MV, Harmon AJ, Lieske JC, Charlesworth MC, Johnson KL, Madden BJ, Zenka RM, McCormick DJ, Sundsbak JL, Heyer CM, Torres VE, Harris PC, Ward CJ: Identification of biomarkers for PKD1 using urinary exosomes. J Am Soc Nephrol 26: 1661–1770: 2015 [DOI] [PMC free article] [PubMed] [Google Scholar]
- 43.Thongboonkerd V, McLeish KR, Arthur JM, Klein JB: Proteomic analysis of normal human urinary proteins isolated by acetone precipitation or ultracentrifugation. Kidney Int 62: 1461–1469, 2002 [DOI] [PubMed] [Google Scholar]
- 44.Hewitt SM, Dear J, Star RA: Discovery of protein biomarkers for renal diseases. J Am Soc Nephrol 15: 1677–1689, 2004 [DOI] [PubMed] [Google Scholar]
- 45.Meijer E, Drenth JP, d’Agnolo H, Casteleijn NF, de Fijter JW, Gevers TJ, Kappert P, Peters DJ, Salih M, Soonawala D, Spithoven EM, Torres VE, Visser FW, Wetzels JF, Zietse R, Gansevoort RT DIPAK Consortium : Rationale and design of the DIPAK 1 study: a randomized controlled clinical trial assessing the efficacy of lanreotide to halt disease progression in autosomal dominant polycystic kidney disease. Am J Kidney Dis 63: 446–455, 2014 [DOI] [PMC free article] [PubMed] [Google Scholar]
- 46.Rossetti S, Hopp K, Sikkink RA, Sundsbak JL, Lee YK, Kubly V, Eckloff BW, Ward CJ, Winearls CG, Torres VE, Harris PC: Identification of gene mutations in autosomal dominant polycystic kidney disease through targeted resequencing. J Am Soc Nephrol 23: 915–933, 2012 [DOI] [PMC free article] [PubMed] [Google Scholar]
- 47.Alvarez ML, Khosroheidari M, Kanchi Ravi R, DiStefano JK: Comparison of protein, microRNA, and mRNA yields using different methods of urinary exosome isolation for the discovery of kidney disease biomarkers. Kidney Int 82: 1024–1032, 2012 [DOI] [PubMed] [Google Scholar]
- 48.Wilson-Grady JT, Haas W, Gygi SP: Quantitative comparison of the fasted and re-fed mouse liver phosphoproteomes using lower pH reductive dimethylation. Methods 61: 277–286, 2013 [DOI] [PubMed] [Google Scholar]
- 49.Vizcaíno JA, Deutsch EW, Wang R, Csordas A, Reisinger F, Ríos D, Dianes JA, Sun Z, Farrah T, Bandeira N, Binz PA, Xenarios I, Eisenacher M, Mayer G, Gatto L, Campos A, Chalkley RJ, Kraus HJ, Albar JP, Martinez-Bartolomé S, Apweiler R, Omenn GS, Martens L, Jones AR, Hermjakob H: ProteomeXchange provides globally coordinated proteomics data submission and dissemination. Nat Biotechnol 32: 223–226, 2014 [DOI] [PMC free article] [PubMed] [Google Scholar]
- 50.Cox J, Mann M: MaxQuant enables high peptide identification rates, individualized p.p.b.-range mass accuracies and proteome-wide protein quantification. Nat Biotechnol 26: 1367–1372, 2008 [DOI] [PubMed] [Google Scholar]
- 51.Bhatia VN, Perlman DH, Costello CE, McComb ME: Software tool for researching annotations of proteins: open-source protein annotation software with data visualization. Anal Chem 81: 9819–9823, 2009 [DOI] [PMC free article] [PubMed] [Google Scholar]
- 52.Kotimaa JP, van Werkhoven MB, O’Flynn J, Klar-Mohamad N, van Groningen J, Schilders G, Rutjes H, Daha MR, Seelen MA, van Kooten C: Functional assessment of mouse complement pathway activities and quantification of C3b/C3c/iC3b in an experimental model of mouse renal ischaemia/reperfusion injury. J Immunol Methods 419: 25–34, 2015 [DOI] [PubMed] [Google Scholar]
Associated Data
This section collects any data citations, data availability statements, or supplementary materials included in this article.


