

Abstract
Objective
Antinuclear antibodies (ANAs) are detected in ∼18% of females, yet autoimmune disease develops in only 5–8%. Immunologic differences between ANA‐positive healthy individuals and patients with systemic lupus erythematosus (SLE) may elucidate the regulatory mechanisms by which ANA‐positive individuals avoid transition to clinical autoimmune disease.
Methods
Healthy individuals (n = 790) were screened for autoantibodies specific for 11 antigens associated with lupus, systemic sclerosis, and Sjögren's syndrome. From this screening, 31 European American ANA‐positive healthy individuals were selected and demographically matched to ANA‐negative controls and SLE patients. Serum cytokine profiles, leukocyte subset frequency, and reactivity were analyzed by multiplex assays, immunophenotyping, and phosphospecific flow cytometry.
Results
Of 790 individuals screened, 57 (7%) were ANA‐positive. The majority of proinflammatory cytokines, including interferon‐γ (IFNγ), tumor necrosis factor, interleukin‐17 (IL‐17), and granulocyte colony‐stimulating factor, exhibited a stepwise increase in serum levels from ANA‐negative controls to ANA‐positive healthy individuals to SLE patients (P < 0.0001). IFNα, IFNβ, IL‐12p40, and stem cell factor/c‐Kit ligand were increased in SLE patients only (P < 0.05). B lymphocyte stimulator (BlyS) was elevated in SLE patients but decreased in ANA‐positive individuals (P < 0.001). Further, IL‐1 receptor antagonist (IL‐1Ra) was down‐regulated in SLE patients only (P < 0.0001). ANA‐positive individuals had increased frequencies of monocytes, memory B cells, and plasmablasts and increased levels of pSTAT‐1 and pSTAT‐3 following IFNα stimulation compared with ANA‐negative controls (P < 0.05).
Conclusion
ANA‐positive healthy individuals exhibit dysregulation in multiple immune pathways yet differ from SLE patients by the absence of elevated IFNs, BLyS, IL‐12p40, and stem cell factor/c‐Kit ligand. Further, severely decreased levels of IL‐1Ra in SLE patients compared with ANA‐positive individuals may contribute to disease development. These results highlight the importance of IFN‐related pathways and regulatory elements in SLE pathogenesis.
Antinuclear antibodies (ANAs) are detected in almost one‐fifth of the general population, yet few individuals are diagnosed as having an autoimmune disease 1, 2. Thus, a substantial percentage of the population carries detectable levels of circulating autoantibodies without developing clinical symptoms. Autoantibodies are also present in the sera of patients with systemic autoimmune diseases, such as systemic lupus erythematosus (SLE), many years before clinical disease onset 3, 4. Although some ANA‐positive healthy individuals eventually develop clinical autoimmunity, many do not. The transition to clinical SLE has been correlated with autoantibody profiles combined with female sex, but other risk factors, including age, ANA titer, number of autoantibody specificities, and type I interferon (IFN) signature, do not definitively identify ANA‐positive healthy individuals in whom autoimmune disease develops eventually 5, 6, 7, 8. Comparing ANA‐positive healthy individuals with SLE patients and ANA‐negative healthy controls provides a unique perspective in the dissection of pathogenic mechanisms in autoimmunity and may reveal the means to provide regulatory control.
A delicate balance of inflammatory and regulatory immune cells is required to control infection without promoting autoreactivity. Evolving work has suggested that interactions between both the adaptive and innate immune systems are critical for autoimmune disease pathogenesis 9, 10, 11, 12. For example, IFN‐associated gene signatures are elevated in peripheral blood of SLE patients and correlate with increased disease activity 13, 14, 15, 16. Plasmacytoid dendritic cells (DCs) are a primary source of type I IFN in SLE 17, 18 and produce type I IFN upon Toll‐like receptor (TLR) stimulation, particularly TLR‐7 and TLR‐9. These receptors may be activated by immune complexes containing double‐stranded DNA (dsDNA) and/or RNA‐associated binding proteins in SLE 19, 20, 21, 22, 23. The IFN signature in SLE is detected in leukocytes involved in both innate and adaptive immunity, such as B cells, T cells, neutrophils, and myeloid cells. However, whether ANA‐positive healthy individuals have a heightened IFN response remains unknown 15, 16.
The cellular response to IFN and many cytokines is mediated by signaling through cytokine‐specific tyrosine kinase receptors to activate JAK/STAT. SLE patients have increased basal levels of pSTAT‐3 in T cells and monocytes and pSTAT‐5 in T cells and B cells, suggesting that abnormal STAT signaling plays a role in SLE pathophysiology 24, 25. Studies in SLE patients and in the MRL‐Fas/lpr mouse lupus model have shown ablation of STAT phosphorylation in response to type I IFNs and other inflammatory cytokines, suggesting a disturbance of negative and positive feedback mechanisms in autoimmunity 25, 26. In this study, we compared immunophenotypes, immune cell signaling responses, and cytokine profiles in ANA‐positive healthy individuals, SLE patients, and ANA‐negative healthy controls to identify unique immune features by which ANA‐positive healthy individuals may avoid transitioning to clinical autoimmune disease.
PATIENTS AND METHODS
Study population
Experiments were performed in accordance with the Helsinki Declaration and were approved by the Institutional Review Boards at the Oklahoma Medical Research Foundation (OMRF) and University of Oklahoma Health Sciences Center. At 15 health fairs in Oklahoma over 1 year, 790 healthy individuals were recruited by our study staff, and samples were processed in the Oklahoma Medical Research Foundation Biorepository Core. All individuals provided informed consent prior to enrollment. Participants provided blood specimens and demographic information (sex, age, self‐reported ethnicity, height, weight, and current medication use) and completed the Connective Tissue Disease Screening Questionnaire (CSQ) 27. Volunteers (ages 18–86 years, 68% female) were primarily European American (59.5%), with 23.3% of individuals self‐identified as American Indian, 15.9% as African American, and 1.2% as other ethnicities. Serum was isolated and stored at −80ºC until analysis. SLE patients, also processed by the OMRF Biorepository Core, met at least 4 American College of Rheumatology SLE classification criteria and were receiving prednisone at a dosage of ≤10 mg/day 28. SLE patients receiving mycophenolate mofetil, cyclophosphamide, or calcineurin inhibitors were excluded. Disease activity was evaluated by the Safety of Estrogens in Lupus Erythematosus National Assessment version of the SLE Disease Activity Index 29. Peripheral blood mononuclear cells (PBMCs) were isolated using Lymphocyte Separation Medium (Mediatech) and stored in freezing media (20% human serum and 10% DMSO in RPMI 1640) at −80ºC until used. ANA‐negative healthy controls, ANA‐positive healthy individuals, and SLE patients were matched by age, sex, body mass index (BMI), and date of sample procurement.
Autoantibody and cytokine measurement
A BioPlex 2200 ANA Screen kit (Bio‐Rad), based on multiplex technology and dyed magnetic beads, was used to simultaneously detect antibodies against the following antigens: dsDNA, chromatin, SSA/Ro, SSB/La, Sm, Sm/RNP, RNP, ribosomal P, Scl‐70, centromere B, and Jo‐1 30. The BioPlex 2200 system reported semiquantitative values from 0 to 8, termed the antibody index, for each autoantibody except anti‐dsDNA. The positive cutoff for each assay was established by the manufacturer to equal an antibody index of 1.0 for all specificities except anti‐dsDNA. For anti‐dsDNA antibody, results are reported as IU/ml with a positive cutoff of 10 IU/ml.
All healthy individuals were confirmed for ANA status by INNO‐LIA ANA Update enzyme immunoassay testing (SmB, Sm/RNP, RNP‐A, RNP‐C, Ro 52, Ro 60, La, centromere protein B, Scl‐70, Jo‐1, ribosomal P, histones) (Immunogenetics). Anti‐dsDNA and Scl‐70 antibody were confirmed by indirect enzyme‐linked immunosorbent assay (ELISA) (Alpha Diagnostic). The Stanford Human Immune Monitoring Center measured soluble mediators using a previously described 51‐plex assay (eBioscience/Affymetrix) to measure CD40L, CXCL5, eotaxin, fibroblast growth factor β, granulocyte colony‐stimulating factor (G‐CSF), granulocyte–macrophage CSF (GM‐CSF), growth‐related oncogene α (GROα), hepatocyte growth factor, intercellular adhesion molecule 1 (ICAM‐1), IFNα, IFNβ, IFNγ, interleukin‐10 (IL‐10), IL‐12p70, IL‐12p40, IL‐13, IL‐15, IL‐17, IL‐17F, IL‐1α, IL‐1β, IL‐1 receptor antagonist (IL‐1Ra), IL‐2, IL‐4, IL‐5, IL‐6, IL‐7, IL‐8, IFNγ‐inducible 10‐kd protein (IP‐10), leptin, leukocyte inhibitory factor, macrophage‐CSF (M‐CSF), monocyte chemotactic protein 1 (MCP‐1), MCP‐3, monokine induced by IFNγ (MIG), macrophage inflammatory protein 1β (MIP‐1β), MIP‐1α, nerve growth factor, plasminogen activator inhibitor 1 (PAI‐1), platelet‐derived growth factor BB, RANTES, resistin, stem cell factor (SCF)/c‐Kit ligand, soluble FasL (sFasL), transforming growth factor (TGF), TGFβ, tumor necrosis factor α (TNFα), TNFβ, TRAIL, vascular cell adhesion molecule 1 (VCAM‐1), and vascular endothelial growth factor 31. Data were analyzed using MasterPlex software (MiraBio Group of Hitachi Software Engineering America Ltd.) and median fluorescence intensity was reported. AssayCheX quality control beads (Radix BioSolutions) and a known serum control were used for quality assurance.
B lymphocyte stimulator (BLyS) and IL‐1Ra levels
Serum BLyS and IL‐1Ra levels were determined by ELISAs from R&D Systems and eBioscience, respectively, according to the instructions of the manufacturer. Low‐, medium‐, and high‐quality controls were run on each plate.
Flow cytometry immunophenotyping
Previously collected and frozen PBMCs were thawed in warm media, washed twice, and resuspended at 1 × 10⁷ viable cells/ml. Cells (50 µl per well) were stained for 45 minutes at room temperature with antibodies specific for CD4, CD45RA, CD27, CD20, CD8, CD3, CD19, CD38, CD24, CD56, CD16, CD33, HLA−DR, CD94, CD314, CD16, CD161, CD25, CD127, and CXCR3 (BD Biosciences). Cells were washed 3 times with fluorescence‐activated cell sorting (FACS) buffer (phosphate buffered saline supplemented with 2% fetal bovine serum and 0.1% sodium azide) and resuspended in 200 µl FACS buffer. Lymphocytes (105 per sample) were collected using Diva 6.0 software on an LSR II flow cytometer (BD Biosciences). Data analysis was performed using FlowJo version 9.3 (Tree Star) by gating on live cells based on forward scatter versus side scatter profiles, then on singlets using forward scatter area versus height, followed by cell subset−specific gating. Assays were performed in the Stanford Human Immune Monitoring Core as described (http://iti.stanford.edu/research/himc-protocols-flowcytometry.html).
Phosphospecific flow cytometry
Previously collected and frozen PBMCs were thawed in warm media, washed twice, and resuspended at 5 × 10⁵ viable cells/ml. Cells were plated in 96‐well deep‐well plates at 200 µl per well. After resting for 1 hour at 37ºC, cells were stimulated by adding 50 µl of cytokine (IFNα, IFNγ, IL‐6, IL‐7, IL‐10, IL‐2, or IL‐21) and incubated at 37°C for 15 minutes. The PBMCs were then fixed with paraformaldehyde, permeabilized with methanol, and kept at −80ºC overnight. Each well was bar‐coded (stained with unique combinations of fluorescent dyes) using a combination of Pacific Orange and Alexa Fluor 750 dyes (Invitrogen) and pooled in tubes. The cells were washed with FACS buffer and stained with the following antibodies (all from BD Biosciences): Pacific Blue−conjugated CD3, PerCP–Cy5.5−conjugated CD4, PerCP–Cy5.5−conjugated CD20, phycoerythrin (PE)−Cy7−conjugated CD33, Qdot 605−conjugated CD45RA, Alexa Fluor 488−conjugated pSTAT‐1, Alexa Fluor 647−conjugated pSTAT‐3, and PE‐conjugated pSTAT‐5. The samples were then washed and resuspended in FACS buffer. For each stimulation condition, 105 cells were collected using Diva 6.0 software on an LSR II flow cytometer. Data analysis was performed using FlowJo version 9.3 by gating on live cells based on forward scatter versus side scatter profiles, then on singlets using forward scatter area versus height, followed by cell subset−specific gating. Assays were performed in the Stanford Human Immune Monitoring Core as described.
Statistical analysis
Cytokine data were non‐normally distributed; therefore, continuous data were analyzed using the Mann‐Whitney test or Kruskal‐Wallis test followed by Dunn's multiple comparison test. The false discovery rate was used to control for the expected proportion of incorrectly rejected null hypotheses. The Mann‐Whitney test was used to compare non‐normally distributed flow cytometry data. Analyses were performed using GraphPad Prism 6.0 for Windows. Heatmaps were generated using an R heatmap package (version 3.0.3). To identify the most important classifying variables, the iterative Random Forest algorithm described by Genuer et al 32 was implemented in RandomForest (version 4.6‐10) R package. Random forest parameters were set to ntry = (number of variable)∧1/2, ntree = 1,000, and proximity = T. The final predictive model was repeated 4 times to obtain the average out‐of‐bag errors and a confusion matrix. The proximity matrix was reduced to 2 principal dimensions using MDSplot within the RandomForest package. Sensitivity, specificity, positive predictive value, and negative predictive value were calculated using the epiR (version 0.9‐59) R package.
RESULTS
Association of female sex with autoantibody production in healthy individuals
To identify ANA‐positive and ANA‐negative healthy individuals, sera from 790 healthy volunteers were screened for autoantibodies against dsDNA, chromatin, ribosomal P, Ro/SSA, La/SSB, Sm, Sm/RNP, RNP, Scl‐70, Jo‐1, and centromere B. Samples positive for at least 1 autoantibody were considered ANA‐positive (n = 57; 7%). Female sex was the only significant predictor of autoantibody positivity by multivariate logistic regression analysis examining the impact of age, sex, race, and BMI (odds ratio [OR] 4.36, 95% confidence interval [95% CI] 1.85–10.31, P = 0.0008). European American ANA‐positive individuals (n = 31) were selected for further analysis to minimize ancestry‐based differences in immune response (see Supplementary Table 1, available on the Arthritis & Rheumatology web site at http://onlinelibrary.wiley.com/doi/10.1002/art.39706/abstract), and matched to SLE patients (n = 29) and ANA‐negative controls (n = 31) by sex, age, race, and BMI (see Supplementary Table 2, available on the Arthritis & Rheumatology web site at http://onlinelibrary.wiley.com/doi/10.1002/art.39706/abstract). To ensure that control participants were free of clinically apparent systemic rheumatic disease, all healthy volunteers reported no systemic autoimmune rheumatic disease and completed a connective tissue disease screening questionnaire (CTD CSQ), which is used to screen large populations for occult disease 27. Mean CTD CSQ scores were similar between ANA‐positive healthy subjects and ANA‐negative controls (see Supplementary Table 3, available on the Arthritis & Rheumatology web site at http://onlinelibrary.wiley.com/doi/10.1002/art.39706/abstract).
Inflammatory and immunoregulatory features of serum soluble mediator profiles of ANA‐positive healthy individuals
To compare basal immune activity between ANA‐positive individuals, ANA‐negative controls, and SLE patients, 52 serum soluble mediators were measured to assess differences in the activation of innate and adaptive immune pathways. Median normalized fluorescence intensity values for 47 of the 52 total soluble mediators originally measured in each of the 91 study participants were visualized as heatmaps and as clusters across the 3 subgroups (Figure 1). Five soluble mediators (IL‐6, GROα, MCP‐1, MIP‐1α, and MIG) were excluded from the heatmap due to nonsignificant differences between disease status groups. Three distinct cytokine clusters were observed within the heatmap. Cluster A comprised 10 soluble mediators down‐regulated in both ANA‐positive and SLE subgroups, including notable differences in sFasL, TRAIL, TNFβ, and VCAM‐1. Cluster B contained 33 soluble mediators elevated only in SLE patients or in SLE patients and ANA‐positive healthy individuals compared with ANA‐negative controls. Cluster C included soluble mediators elevated only in ANA‐positive healthy individuals (MIP‐1β, CD40L, and IL‐8). Among all soluble mediators, only IL‐1Ra levels were significantly decreased in SLE patients compared with ANA‐negative and ANA‐positive individuals.
Figure 1.
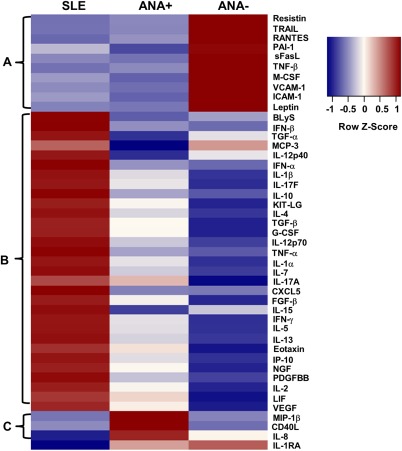
Antinuclear antibody−positive (ANA+) healthy individuals have a distinct serum soluble mediator profile. Columns represent grouped study participants: patients with systemic lupus erythematosus (SLE), ANA‐positive healthy individuals, and ANA‐negative (ANA−) healthy individuals. Rows represent individual cytokines measured by a multiplex Luminex bead‐based assay or by enzyme‐linked immunosorbent assay (B lymphocyte stimulator [BlyS] and interleukin‐1 receptor antagonist [IL‐1Ra]). In generating the heatmap, each cytokine row was normalized to have a mean of 0 and a variance of 1. Normalized cytokine values are displayed on a color scale ranging from blue (levels below the mean) through white (levels equal to the mean) to red (levels greater than the mean). Cluster A indicates soluble mediators that are down‐regulated in SLE and/or ANA‐positive healthy individuals, cluster B shows soluble mediators that are elevated in SLE and/or ANA‐positive healthy individuals, and cluster C shows soluble mediators that are up‐regulated in ANA‐positive healthy individuals only. PAI‐1 = plasminogen activator inhibitor 1; sFasL = soluble FasL; TNFβ = tumor necrosis factor β; M‐CSF = macrophage colony‐stimulating factor; VCAM‐1 = vascular cell adhesion molecule 1; ICAM‐1 = intercellular adhesion molecule 1; IFNβ = interferon‐β; TGFα = transforming growth factor α; MCP‐3 = monocyte chemotactic protein 3; Kit‐LG = Kit ligand; G‐CSF = granulocyte‐CSF; FGFβ = fibroblast growth factor β; IP‐10 = IFNγ‐inducible 10‐kd protein; NGF = nerve growth factor; PDGFBB = platelet‐derived growth factor BB; LIF = leukemia inhibitory factor; VEGF = vascular endothelial growth factor; MIP‐1β = macrophage inflammatory protein 1β.
As expected, serum soluble mediator profiles differed dramatically between ANA‐negative healthy controls and SLE patients, consistent with an inflammatory state in SLE 33. The unique soluble mediator profile in ANA‐positive healthy individuals shared numerous proinflammatory features observed in SLE patients but also had specific features separating them from SLE patients. Both SLE and ANA‐positive subjects had significant reductions in TRAIL, RANTES, sFasL, VCAM‐1, and 6 additional serum soluble mediators (resistin, PAI‐1, TNFβ, M‐CSF, ICAM‐1, leptin). Approximately half of the serum analytes were significantly increased in SLE patients and ANA‐positive healthy subjects compared with ANA‐negative controls (Figures 1 and 2A−H; see also Supplementary Table 4, available on the Arthritis & Rheumatology web site at http://onlinelibrary.wiley.com/doi/10.1002/art.39706/abstract). TNFα, IFNγ, IL‐10, IL‐1α, and IP‐10 (each P < 0.0001), and other myeloid‐derived soluble mediators (G‐CSF, GM‐CSF, and TGFβ) were markedly elevated in SLE patients and modestly elevated in ANA‐positive healthy individuals compared with ANA‐negative controls (Figures 2A−E and results not shown).
Figure 2.
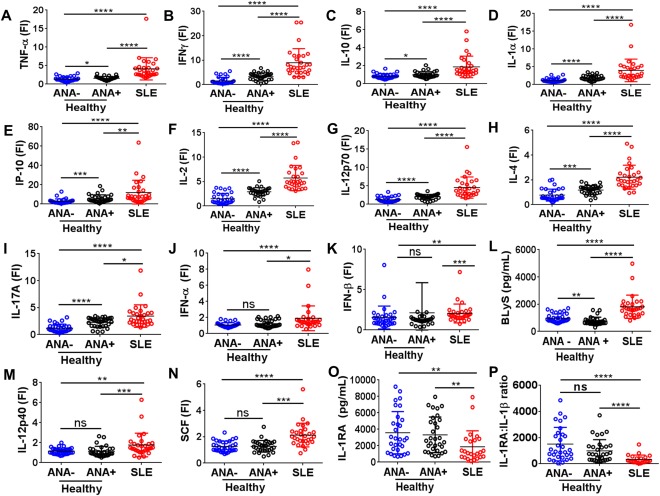
ANA‐positive healthy individuals have higher levels of certain proinflammatory soluble mediators seen in SLE patients and elevated levels of the regulatory cytokine IL‐1Ra. Proinflammatory soluble mediators were measured by multiplex assay or enzyme‐linked immunosorbent assay and included TNF (A), IFNγ (B), IL‐10 (C), IL‐1α (D), IP‐10 (E), IL‐2 (F), IL‐12p70 (G), IL‐4 (H), and IL‐17A (I). Soluble mediators differently regulated in SLE included IFNα (J), IFNβ (K), BLyS (L), IL‐12p40 (M), stem cell factor (SCF) (N), IL‐1Ra (O), and IL‐1Ra:IL‐1β ratio (P). Each data point represents an individual subject; horizontal lines show the median and interquartile range. ∗ = P < 0.05; ∗∗ = P < 0.01; ∗∗∗ = P < 0.001; ∗∗∗∗ = P < 0.0001 by Kruskal‐Wallis test followed by Dunn's multiple comparison test. FI = fluorescence intensity; NS = not significant (see Figure 1 for other definitions).
Other T cell–associated proinflammatory soluble mediators that drive Th1, Th2, and Th17 cell differentiation, such as IL‐2 (P < 0.0001), IL‐12p70 (P < 0.0001), IL‐4 (P < 0.0001), and IL‐17A (P < 0.05), were significantly increased in SLE patients and moderately up‐regulated in ANA‐positive individuals compared with ANA‐negative controls (Figures 2F−I). Taken together, these observations suggest that the inflammatory profile in ANA‐positive healthy individuals is milder than that in SLE patients (Figures 2A−I) but stronger than that in ANA‐negative healthy individuals. Despite extensive similarities in the cytokine profiles of ANA‐positive healthy individuals and SLE patients, further univariate analyses showed that IFNα (P < 0.05), IFNβ (P < 0.0001), BLyS (P < 0.0001), IL‐12p40 (P < 0.0001), and SCF/c‐Kit ligand (P < 0.0001) were up‐regulated only in SLE patients (Figures 2J−N; see also Supplementary Table 4, available on the Arthritis & Rheumatology web site at http://onlinelibrary.wiley.com/doi/10.1002/art.39706/abstract). BLyS was also significantly lower in ANA‐positive versus ANA‐negative healthy individuals. Therefore, these mediators may contribute to the progression from benign to pathogenic autoimmunity.
While both SLE patients and ANA‐positive healthy controls showed significant increases in several proinflammatory soluble mediators (Figures 2A−I and Supplementary Table 4), the regulatory cytokine IL‐1Ra was decreased only in SLE patients (Figure 2O). IL‐1Ra tightly binds type I IL‐1R (IL‐1RI), thereby preventing IL‐1 ligation and subsequent signaling through IL‐1RI 34. An increased circulating IL‐1Ra:IL‐1β ratio would favor an antiinflammatory state, and the median IL‐1Ra:IL‐1β ratio in ANA‐positive healthy subjects was 3.7 times that of SLE patients (P < 0.0001) (Figure 2P). Taken together, these results suggest that the mild inflammatory profile in ANA‐positive healthy individuals compared with ANA‐negative controls may be balanced by an increased ratio of IL‐1Ra:IL‐1β, normal levels of type I IFNs, IL‐12p40, and Kit ligand, and decreased levels of BLyS.
Differentiation of ANA‐positive healthy individuals from SLE patients using soluble mediator profiles
To determine whether soluble mediator profiles distinguished ANA‐positive healthy individuals from ANA‐negative healthy individuals and SLE patients, a random forest multivariate analysis was used to classify individuals into subgroups based on soluble mediator levels. The random forest model distinguished these groups with 78.47% accuracy (mean ± SD out‐of‐bag error 21.53 ± 0.67%) using BLyS, IL‐5, G‐CSF, and IL‐2 as the top independent classifiers (Figure 3). The slightly low accuracy was largely attributable to errors differentiating ANA‐negative and ANA‐positive individuals: 6 ANA‐negative subjects were characterized as ANA‐positive (71.0% accuracy) and 8 ANA‐positive subjects as ANA‐negative (74.2% accuracy). Only 2 SLE patients were characterized as ANA‐positive healthy, and none were classified as ANA‐negative (93.1% accuracy). Thus, although these immunologic criteria did not accurately differentiate ANA‐positive and ANA‐negative healthy individuals, cytokine profiles may be useful in distinguishing ANA‐positive healthy individuals from undiagnosed individuals who will soon transition to SLE.
Figure 3.
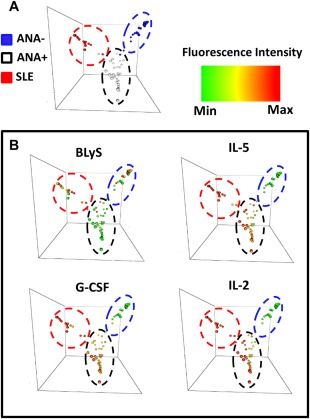
ANA‐positive healthy individuals can be distinguished from SLE patients and ANA‐negative healthy individuals using BLyS, IL‐5, G‐CSF, and IL‐2. A, Random forest models separate SLE patients (red), ANA‐positive healthy individuals (white), and ANA‐negative healthy individuals (blue) by cytokine expression. B, BLyS, IL‐5, G‐CSF, and IL‐2 were used to differentiate ANA‐positive healthy individuals from SLE patients and ANA‐negative healthy controls. Colors indicate the increased cytokine fluorescence intensity, with red as the highest, yellow as average, and green as the lowest. Min = minimum; max = maximum (see Figure 1 for other definitions).
Altered immune cell population frequencies in ANA‐positive healthy individuals
Like serum soluble mediator profiles, frequencies of multiple cell populations are altered in the peripheral blood of SLE patients 35, 36. The use of potent immunosuppressants may change cell numbers in SLE patients, but ANA‐positive healthy individuals already have detectable levels of autoantibodies without confounding effects from medications. Therefore, in order to determine whether differential soluble mediator profiles were associated with altered leukocyte homeostasis in ANA‐positive healthy individuals, the relative abundance of various immune cell populations was determined by flow cytometry using PBMCs from ANA‐positive and ANA‐negative healthy individuals when absolute cell number and frequencies were determined.
ANA‐positive healthy individuals had a reduced number of total PBMCs/ml of blood compared with ANA‐negative controls (Figure 4A). Although serum levels of T cell−associated mediators differed significantly between ANA‐positive and ANA‐negative individuals (Figures 1 and 2), the frequencies of lymphocytes (P = 0.374) (Figure 4B), CD4+ T cells (P = 0.584) (Figure 4C), and CD8+ T cells (P = 0.898) (Figure 4D) were similar. Furthermore, expression of CD85j, a receptor that inhibits CD4+ T cell activation 37, was significantly decreased in ANA‐positive subjects (P = 0.042) (Figure 4E). ANA‐positive healthy individuals had a greater frequency of memory B cells (CD27+CD38−) (P = 0.003) and plasmablasts (CD27+CD38+) (P = 0.008) but similar frequencies of total B cells (CD3−CD19+CD20+) (P = 0.299), naive B cells (IgD+CD27−CD24−) (P = 0.802), and transitional B cells (CD27−CD38+CD24+) (P = 0.994) compared with ANA‐negative individuals (Figures 4F−J). In addition, ANA‐positive healthy individuals had an increased frequency of monocytes (P = 0.03) (Figure 4K). There was no difference in natural killer (NK) cell (CD3−CD56+CD16+) frequency (P = 0.5202) (Figure 4L); however, when absolute cell numbers were calculated, NK cells were reduced in number in ANA‐positive healthy individuals along with total CD4+ T cells, CD4+CD85j+ T cells, and transitional B cells (see Supplementary Table 5, available on the Arthritis & Rheumatology web site at http://onlinelibrary.wiley.com/doi/10.1002/art.39706/abstract).
Figure 4.
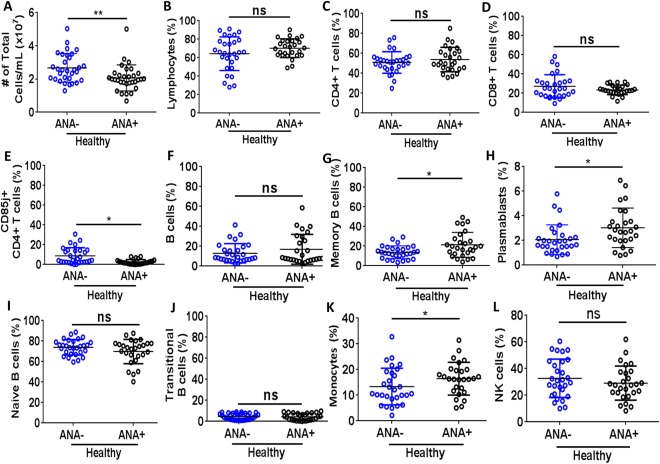
Relative numbers of monocytes and memory B cells are increased in antinuclear antibody−positive (ANA+) healthy individuals. Immunophenotyping flow cytometry was used to determine the total absolute cell number of peripheral blood mononuclear cells (PBMCs)/ml of blood (A) and percentages of PBMCs identified as lymphocytes (B), the T cell subsets CD4+ (C), CD8+ (D), and CD85j+CD4+ (E). The B cell subsets were identified as total (CD3−CD20+CD19+) (F), memory (CD20+CD19+CD27+CD38−) (G), plasmablasts (CD20−CD19+CD27+CD38+) (H), naive (IgD+CD27−CD24−) (I), and transitional (CD27−CD38+CD24+) (J). Frequencies of monocytes (K) and natural killer (NK) cells (CD3−CD56+CD16+) (L) are also shown. Each data point represents an individual subject; horizontal lines show the median and interquartile range. ∗ = P < 0.05; ∗∗ = P < 0.01, by Mann‐Whitney test. ANA− = ANA‐negative; NS = not significant.
Taken together, these results suggest that early differences in effector B cell subsets, monocytes, NK cells, and inhibitory T cell functions may contribute to a loss of immune tolerance by driving autoantigen presentation and proinflammatory cytokine production in ANA‐positive healthy individuals.
Dysregulated cytokine‐stimulated STAT signaling in ANA‐positive healthy individuals
To explore molecular mechanisms that may link the altered soluble mediator profiles and cell frequencies of ANA‐positive healthy individuals with the potential for impaired immune tolerance, STAT‐1, STAT‐3, and STAT‐5 phosphorylation was measured in specific cell types. Phosphospecific flow cytometry was utilized to assess STAT signaling in PBMCs from ANA‐positive and ANA‐negative healthy individuals under normal conditions and after stimulation with the cytokines IFNα, IFNγ, IL‐2, IL‐6, IL‐7, IL‐10, or IL‐21. Basal phosphorylation of STAT‐5 was increased in ANA‐positive healthy subjects compared with ANA‐negative subjects (P = 0.038 in B cells, P = 0.003 in monocytes) (Figure 5A), but basal pSTAT‐1 and pSTAT‐3 did not differ between ANA‐positive and ANA‐negative individuals in any cell type (see Supplementary Table 6, available on the Arthritis & Rheumatology web site at http://onlinelibrary.wiley.com/doi/10.1002/art.39706/abstract).
Figure 5.
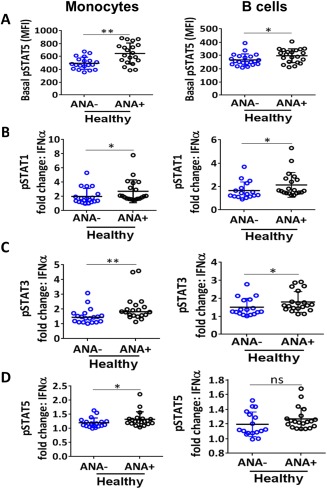
ANA‐positive healthy individuals have increased STAT phosphorylation in B cells and monocytes. Phosphospecific flow cytometry on PBMCs was used to assess basal STAT‐5 phosphorylation (A) and pSTAT‐1 (B), pSTAT‐3 (C), and pSTAT‐5 (D) following interferon‐α (IFNα) stimulation in monocytes and B cells. Each data point represents an individual subject; horizontal lines show the median and interquartile range. ∗ = P < 0.05; ∗∗ = P < 0.01, by Mann‐Whitney test. MFI = mean fluorescence intensity (see Figure 4 for other definitions).
The majority of significant differences were induced by IFNα stimulation, including greater pSTAT‐1, pSTAT‐3, and pSTAT‐5 responses in monocytes and greater pSTAT‐1 and pSTAT‐3 responses in B cells from ANA‐positive versus ANA‐negative subjects (Figures 5B−D). B cells from ANA‐positive subjects also produced greater pSTAT‐3 responses to IL‐21 stimulation and greater pSTAT‐1 responses to IFNγ (see Supplementary Table 5, available on the Arthritis & Rheumatology web site at http://onlinelibrary.wiley.com/doi/10.1002/art.39706/abstract). Similarly, monocytes from ANA‐positive subjects had increased pSTAT‐3 responses to IFNγ and increased pSTAT‐5 responses to IL‐7 stimulation (see Supplementary Table 5). For the majority of cytokine stimulations, cells from ANA‐positive and ANA‐negative subjects had similar pSTAT‐1, pSTAT‐3, and pSTAT‐5 responses (see Supplementary Table 5). Therefore, antigen‐presenting cells in ANA‐positive individuals may have a heightened response to IFNs.
DISCUSSION
Because many healthy individuals have detectable serum autoantibodies, autoimmune disease is not necessarily an inevitable consequence of ANA positivity. However, the mechanisms that preserve health in the presence of ANAs are incompletely understood. Our study reveals a unique immunologic landscape in ANA‐positive healthy individuals, with a combination of inflammatory and immunoregulatory features that is not seen in ANA‐negative controls or in SLE patients. Taken together, the immune cell phenotypes and serum cytokines that distinguish ANA‐positive healthy individuals may reveal important insights about the mechanisms that prevent transition from benign to pathogenic autoimmunity.
The immune cell frequencies in ANA‐positive healthy individuals suggest that increased presentation of self antigens could prompt autoantibody development. For example, the increased frequencies of effector B cells and monocytes in ANA‐positive healthy individuals are suggestive of up‐regulated antigen‐presenting cell (APC) function; this is further supported by increased B cell responses to IFNα, IFNγ, and IL‐21 and monocyte responses to IFNα, IFNγ, IL‐7, and IL‐10. APC up‐regulation may result from a combination of genetic and environmental factors, including decreased CD85j expression on CD4+ T cells. CD85j is a known inhibitory receptor that inhibits phosphorylation of the T cell receptor ζ‐chain and thus downstream recruitment of ZAP‐70 38. Previous studies in SLE patients have suggested that diminished inhibitory activity of CD85j on T cell subsets and decreased expression of CD85j on B cells and DCs contribute to hyperresponsiveness, likely by reduced Treg cells and tolerogenic DCs, which were not measured in our study 39, 40, 41.
Thus, early defects in CD85j expression may promote higher proinflammatory soluble mediator production, creating an environment favorable for increased autoantibody production. Indeed, ANA‐positive healthy controls have an increased frequency of plasmablasts and elevated levels of proinflammatory soluble mediators suggestive of ANA production; however, phenotyping was conducted on frozen PBMCs, where total plasmablast frequencies are known to be variable 42. Future immunophenotyping and cell function studies that include SLE patients with active disease and those with inactive disease would help further delineate the pathways that are important in loss of immune tolerance and disease exacerbation.
Our results imply that despite elevated levels of proinflammatory soluble mediators and autoantibodies, ANA‐positive healthy subjects remain free of classifiable autoimmune disease through the activation of intact regulatory mechanisms. For example, the increased IL‐1Ra levels and IL‐1Ra:IL‐1β ratio in ANA‐positive healthy individuals compared with SLE patients likely inhibit IL‐1 signaling. IL‐1 levels positively correlate with disease activity in SLE and may be influenced by IL‐1 polymorphisms 43, 44, while lower IL‐1Ra levels are associated with more severe disease and renal involvement 45. Our results suggest that therapeutically increasing IL‐1Ra levels could be a promising approach to delaying and/or preventing the transition from benign to pathogenic autoimmunity in high‐risk individuals with anti‐dsDNA− or anti‐RNA−associated binding protein autoantibodies and a dysregulated cytokine profile suggestive of SLE transition.
In addition to intact regulatory mechanisms, ANA‐positive healthy individuals may be protected by a lack of certain inflammatory signatures seen in SLE patients, including type I IFNs, BLyS, SCF/c‐Kit ligand, and IL‐12p40. These findings support published observations that IFN‐related pathways are associated with the transition from benign autoimmunity to clinical disease 17, 46. Furthermore, type I IFNs are known to induce production of BlyS 47, which correlates with disease activity in some patients and is the target of belimumab, an SLE treatment that was approved in 2011. Interestingly, the monocytes of ANA‐positive healthy individuals show increased sensitivity to IFNα stimulation. Given the reduced levels of type I IFNs and BLyS in ANA‐positive versus ANA‐negative healthy individuals, it is possible that immune cells in ANA‐positive healthy individuals are primed but lack the appropriate cytokine stimuli to induce pathogenesis.
Indeed, reduced BLyS levels in ANA‐positive healthy individuals would impair B cell development, activation, and survival, although ANA‐positive healthy individuals still have elevated transitional and effector B cells, suggesting that other genetic and/or environmental conditions trigger B cell proliferation and autoantibody production. If this second regulatory step is lost, and BLyS and/or IFN levels become elevated, more autoreactive B cells would survive the transitional checkpoint and proceed to produce higher levels of autoantibodies, which would further increase proinflammatory cytokine concentrations and ultimately cause clinical symptoms. Taken together, these observations suggest that production of type I IFNs and BLyS may represent a decisive step toward the transition from benign autoimmunity to SLE classification.
Expression of both IL‐12p40 and SCF/c‐Kit ligand was also increased only in SLE patients. Although a direct connection between IL‐12p40 and SLE progression has not been established, IL‐12p40 may enhance SLE pathogenesis through its effects on Th1 and/or Th17 pathways. IL‐12p40 is a component of both IL‐12p70 and IL‐23, important for Th1 and Th17 differentiation and production of IFNγ and IL‐17, the expression of which is elevated in SLE patients compared with controls 48. IL‐12p40 also exists as a monomer and as a homodimer (IL‐12p80) that increases dendritic cell responsiveness 49, 50. SCF, also known as c‐Kit ligand, drives proliferation and survival of early hematopoietic cells, suggesting that SCF may contribute to the hematologic features of SLE. These and other cytokines up‐regulated only in SLE patients may be critical for SLE onset and progression.
Our results suggest that the absence of elevated levels of type I IFNs, BLyS, IL‐12p40, and SCF/c‐Kit ligand, along with increased IL‐1Ra:IL‐1β ratios, protect ANA‐positive healthy individuals against potentially pathogenic autoimmune responses. Investigating these mechanisms in a longitudinal study of ANA‐positive individuals would assist in the identification of individuals at high risk of transitioning to SLE and direct the discovery of new therapeutic targets for disease prevention and treatment. Finally, identifying ANA‐positive healthy individuals at low risk of transitioning to SLE may reduce unnecessary treatment of these individuals.
AUTHOR CONTRIBUTIONS
All authors were involved in drafting the article or revising it critically for important intellectual content, and all authors approved the final version to be published. Dr. James had full access to all of the data in the study and takes responsibility for the integrity of the data and the accuracy of the data analysis.
Study conception and design
Ritterhouse, Guthridge, James.
Acquisition of data
Slight‐Webb, Maecker, Fathman, Utz, Merrill, Guthridge, James.
Analysis and interpretation of data
Slight‐Webb, Lu, Munroe, Merrill, Guthridge, James.
Supporting information
Supplementary Table 1. Demographics and autoantibody specificities of ANA+ healthy individuals.
Supplementary Table 2. Autoantibodies, ACR classification criteria, and disease activity characteristics of SLE patients.
Supplementary Table 3. Connective tissue disease screening questionnaire (CSQ) results.
Supplementary Table 4. Serum cytokine, chemokine, and other immunologic serum biomarkers.
Supplementary Table 5. Absolute cell numbers.
Supplementary Table 6. Phospho‐specific flow cytometry.
ACKNOWLEDGMENTS
We thank Wendy Klein, Susan Macwana, Wade DeJager, Virginia Roberts, and Jeremy Levin for technical assistance. Additionally, we thank the late J. Donald Capra, MD, for previous critical discussions, and Rebecka Bourn, PhD, and Angela Andersen, PhD, for scientific editing of the manuscript.
The contents herein are solely the responsibility of the authors and do not necessarily represent the official views of the National Institutes of Health or its institutes.
Supported by the NIH (National Institute of Allergy and Infectious Diseases grants U19‐AI‐082714, U19‐AI‐082719, U01‐AI‐101934, and U19‐AI‐110491; National Institute of Arthritis and Musculoskeletal and Skin Diseases grants RC1‐AR‐058554 and P30‐AR‐053483; National Institute of General Medical Sciences grants U54‐GM‐104938 and P30‐GM‐103510; and National Center for Research Resources grant S10‐RR‐026735), the Oklahoma Medical Research Foundation J. Donald and Patricia Capra Fellowship Program (Dr. Lu), and Rheuminations. Dr. Slight‐Webb's work was supported by the NIH through a University of Oklahoma Health Sciences Center Microbiology and Immunology Training grant (National Institute of Allergy and Infectious Diseases grant T32‐AI‐007633‐12). Dr. James' work was supported by the Kirkland Scholarship Award Program. Dr. James holds the Lou C. Kerr Chair in Biomedical Research at the Oklahoma Medical Research Foundation.
REFERENCES
- 1. Satoh M, Chan EK, Ho LA, Rose KM, Parks CG, Cohn RD, et al. Prevalence and sociodemographic correlates of antinuclear antibodies in the United States. Arthritis Rheum 2012;64:2319–27. [DOI] [PMC free article] [PubMed] [Google Scholar]
- 2. Parks CG, Miller FW, Satoh M, Chan EK, Andrushchenko Z, Birnbaum LS, et al. Reproductive and hormonal risk factors for antinuclear antibodies (ANA) in a representative sample of U.S. women. Cancer Epidemiol Biomarkers Prev 2014;23:2492–502. [DOI] [PMC free article] [PubMed] [Google Scholar]
- 3. Heinlen LD, McClain MT, Merrill J, Akbarali YW, Edgerton CC, Harley JB, et al. Clinical criteria for systemic lupus erythematosus precede diagnosis, and associated autoantibodies are present before clinical symptoms. Arthritis Rheum 2007;56:2344–51. [DOI] [PubMed] [Google Scholar]
- 4. Arbuckle MR, McClain MT, Rubertone MV, Scofield RH, Dennis GJ, James JA, et al. Development of autoantibodies before the clinical onset of systemic lupus erythematosus. N Engl J Med 2003;349:1526–33. [DOI] [PubMed] [Google Scholar]
- 5. Li QZ, Karp DR, Quan J, Branch VK, Zhou J, Lian Y, et al. Risk factors for ANA positivity in healthy persons. Arthritis Res Ther 2011;13:R38. [DOI] [PMC free article] [PubMed] [Google Scholar]
- 6. Olsen NJ, Li QZ, Quan J, Wang L, Mutwally A, Karp DR. Autoantibody profiling to follow evolution of lupus syndromes. Arthritis Res Ther 2012;14:R174. [DOI] [PMC free article] [PubMed] [Google Scholar]
- 7. Calvo‐Alen J, Alarcon GS, Burgard SL, Burst N, Bartolucci AA, Williams HJ. Systemic lupus erythematosus: predictors of its occurrence among a cohort of patients with early undifferentiated connective tissue disease: multivariate analyses and identification of risk factors. J Rheumatol 1996;23:469–75. [PubMed] [Google Scholar]
- 8. Hallengren CS, Nived O, Sturfelt G. Outcome of incomplete systemic lupus erythematosus after 10 years. Lupus 2004;13:85–8. [DOI] [PubMed] [Google Scholar]
- 9. Grieco FA, Vendrame F, Spagnuolo I, Dotta F. Innate immunity and the pathogenesis of type 1 diabetes. Semin Immunopathol 2011;33:57–66. [DOI] [PubMed] [Google Scholar]
- 10. Schwartz M, Kipnis J. Autoimmunity on alert: naturally occurring regulatory CD4+CD25+ T cells as part of the evolutionary compromise between a ‘need’ and a ‘risk’. Trends Immunol 2002;23:530–4. [DOI] [PubMed] [Google Scholar]
- 11. Lang KS, Burow A, Kurrer M, Lang PA, Recher M. The role of the innate immune response in autoimmune disease. J Autoimmun 2007;29:206–12. [DOI] [PubMed] [Google Scholar]
- 12. Ronnblom L, Pascual V. The innate immune system in SLE: type I interferons and dendritic cells. Lupus 2008;17:394–9. [DOI] [PMC free article] [PubMed] [Google Scholar]
- 13. Baechler EC, Batliwalla FM, Karypis G, Gaffney PM, Ortmann WA, Espe KJ, et al. Interferon‐inducible gene expression signature in peripheral blood cells of patients with severe lupus. Proc Natl Acad Sci U S A 2003;100:2610–5. [DOI] [PMC free article] [PubMed] [Google Scholar]
- 14. Theofilopoulos AN, Baccala R, Beutler B, Kono DH. Type I interferons (α/β) in immunity and autoimmunity. Annu Rev Immunol 2005;23:307–36. [DOI] [PubMed] [Google Scholar]
- 15. Berry MP, Graham CM, McNab FW, Xu Z, Bloch SA, Oni T, et al. An interferon‐inducible neutrophil‐driven blood transcriptional signature in human tuberculosis. Nature 2010;466:973–7. [DOI] [PMC free article] [PubMed] [Google Scholar]
- 16. Becker AM, Dao KH, Han BK, Kornu R, Lakhanpal S, Mobley AB, et al. SLE peripheral blood B cell, T cell and myeloid cell transcriptomes display unique profiles and each subset contributes to the interferon signature. PloS One 2013;8:e67003. [DOI] [PMC free article] [PubMed] [Google Scholar]
- 17. Bennett L, Palucka AK, Arce E, Cantrell V, Borvak J, Banchereau J, et al. Interferon and granulopoiesis signatures in systemic lupus erythematosus blood. J Exp Med 2003;197:711–23. [DOI] [PMC free article] [PubMed] [Google Scholar]
- 18. Hirai M, Kadowaki N, Kitawaki T, Fujita H, Takaori‐Kondo A, Fukui R, et al. Bortezomib suppresses function and survival of plasmacytoid dendritic cells by targeting intracellular trafficking of Toll‐like receptors and endoplasmic reticulum homeostasis. Blood 2011;117:500–9. [DOI] [PubMed] [Google Scholar]
- 19. Vollmer J, Tluk S, Schmitz C, Hamm S, Jurk M, Forsbach A, et al. Immune stimulation mediated by autoantigen binding sites within small nuclear RNAs involves Toll‐like receptors 7 and 8. J Exp Med 2005;202:1575–85. [DOI] [PMC free article] [PubMed] [Google Scholar]
- 20. Christensen SR, Shupe J, Nickerson K, Kashgarian M, Flavell RA, Shlomchik MJ. Toll‐like receptor 7 and TLR9 dictate autoantibody specificity and have opposing inflammatory and regulatory roles in a murine model of lupus. Immunity 2006;25:417–28. [DOI] [PubMed] [Google Scholar]
- 21. Vallin H, Blomberg S, Alm GV, Cederblad B, Ronnblom L. Patients with systemic lupus erythematosus (SLE) have a circulating inducer of interferon‐α (IFN‐α) production acting on leucocytes resembling immature dendritic cells. Clin Exp Med 1999;115:196–202. [DOI] [PMC free article] [PubMed] [Google Scholar]
- 22. Guiducci C, Tripodo C, Gong M, Sangaletti S, Colombo MP, Coffman RL, et al. Autoimmune skin inflammation is dependent on plasmacytoid dendritic cell activation by nucleic acids via TLR7 and TLR9. J Exp Med 2010;207:2931–42. [DOI] [PMC free article] [PubMed] [Google Scholar]
- 23. Yasuda K, Richez C, Uccellini MB, Richards RJ, Bonegio RG, Akira S, et al. Requirement for DNA CpG content in TLR9‐dependent dendritic cell activation induced by DNA‐containing immune complexes. J Immunol 2009;183:3109–17. [DOI] [PMC free article] [PubMed] [Google Scholar]
- 24. Harada T, Kyttaris V, Li Y, Juang YT, Wang Y, Tsokos GC. Increased expression of STAT3 in SLE T cells contributes to enhanced chemokine‐mediated cell migration. Autoimmunity 2007;40:1–8. [DOI] [PubMed] [Google Scholar]
- 25. Huang X, Guo Y, Bao C, Shen N. Multidimensional single cell based STAT phosphorylation profiling identifies a novel biosignature for evaluation of systemic lupus erythematosus activity. PLoS One 2011;6:e21671. [DOI] [PMC free article] [PubMed] [Google Scholar]
- 26. Hale MB, Krutzik PO, Samra SS, Crane JM, Nolan GP. Stage dependent aberrant regulation of cytokine‐STAT signaling in murine systemic lupus erythematosus. PLoS One 2009;4:e6756. [DOI] [PMC free article] [PubMed] [Google Scholar]
- 27. Karlson EW, Sanchez‐Guerrero J, Wright EA, Lew RA, Daltroy LH, Katz JN, et al. A connective tissue disease screening questionnaire for population studies. Ann Epidemiol 1995;5:297–302. [DOI] [PubMed] [Google Scholar]
- 28. Hochberg MC. Updating the American College of Rheumatology revised criteria for the classification of systemic lupus erythematosus [letter]. Arthritis Rheum 1997;40:1725. [DOI] [PubMed] [Google Scholar]
- 29. Petri M, Kim MY, Kalunian KC, Grossman J, Hahn BH, Sammaritano LR, et al, for the OC‐SELENA Trial . Combined oral contraceptives in women with systemic lupus erythematosus. N Engl J Med 2005;353:2550–8. [DOI] [PubMed] [Google Scholar]
- 30. Maier‐Moore JS, Koelsch KA, Smith K, Lessard CJ, Radfar L, Lewis D, et al. Antibody‐secreting cell specificity in labial salivary glands reflects the clinical presentation and serology in patients with Sjogren's syndrome. Arthritis Rheumatol 2014;66:3445–56. [DOI] [PMC free article] [PubMed] [Google Scholar]
- 31. Stringer EA, Baker KS, Carroll IR, Montoya JG, Chu L, Maecker HT, et al. Daily cytokine fluctuations, driven by leptin, are associated with fatigue severity in chronic fatigue syndrome: evidence of inflammatory pathology. J Trans Med 2013;11:93. [DOI] [PMC free article] [PubMed] [Google Scholar]
- 32. Genuer R, Poggi JM, Tuleau‐Malot C. Variable selection using random forests. Pattern Recogn Lett 2010;31:2225–36. [Google Scholar]
- 33. Lee HM, Sugino H, Nishimoto N. Cytokine networks in systemic lupus erythematosus. J Biomed Biotech 2010;2010:676284. [DOI] [PMC free article] [PubMed] [Google Scholar]
- 34. Sims JE, Smith DE. The IL‐1 family: regulators of immunity. Nat Rev Immunol 2010;10:89–102. [DOI] [PubMed] [Google Scholar]
- 35. Dorner T, Jacobi AM, Lee J, Lipsky PE. Abnormalities of B cell subsets in patients with systemic lupus erythematosus. J Immunol Methods 2011;363:187–97. [DOI] [PubMed] [Google Scholar]
- 36. Konya C, Paz Z, Tsokos GC. The role of T cells in systemic lupus erythematosus: an update. Curr Opin Rheumatol 2014;26:493–501. [DOI] [PubMed] [Google Scholar]
- 37. Saverino D, Fabbi M, Merlo A, Ravera G, Grossi CE, Ciccone E. Surface density expression of the leukocyte‐associated Ig‐like receptor‐1 is directly related to inhibition of human T‐cell functions. Hum Immunol 2002;63:534–46. [DOI] [PubMed] [Google Scholar]
- 38. Dietrich J, Cella M, Colonna M. Ig‐like transcript 2 (ILT2)/leukocyte Ig‐like receptor 1 (LIR1) inhibits TCR signaling and actin cytoskeleton reorganization. J Immunol 2001;166:2514–21. [DOI] [PubMed] [Google Scholar]
- 39. Monsivais‐Urenda A, Gomez‐Martin D, Santana‐de‐Anda K, Cruz‐Martinez J, Alcocer‐Varela J, Gonzalez‐Amaro R. Defective expression and function of the ILT2/CD85j regulatory receptor in dendritic cells from patients with systemic lupus erythematosus. Hum Immunol 2013;74:1088–96. [DOI] [PubMed] [Google Scholar]
- 40. Monsivais‐Urenda A, Nino‐Moreno P, Abud‐Mendoza C, Baranda L, Layseca‐Espinosa E, Lopez‐Botet M, et al. Analysis of expression and function of the inhibitory receptor ILT2 (CD85j/LILRB1/LIR‐1) in peripheral blood mononuclear cells from patients with systemic lupus erythematosus (SLE). J Autoimmun 2007;29:97–105. [DOI] [PubMed] [Google Scholar]
- 41. Wlasiuk P, Tomczak W, Zajac M, Dmoszynska A, Giannopoulos K. Total expression of HLA‐G and TLR‐9 in chronic lymphocytic leukemia patients. Hum Immunol 2013;74:1592–7. [DOI] [PubMed] [Google Scholar]
- 42. Kyu SY, Kobie J, Yang H, Zand MS, Topham DJ, Quataert SA, et al. Frequencies of human influenza‐specific antibody secreting cells or plasmablasts post vaccination from fresh and frozen peripheral blood mononuclear cells. J Immunol Methods 2009;340:42–7. [DOI] [PMC free article] [PubMed] [Google Scholar]
- 43. Grondal G, Gunnarsson I, Ronnelid J, Rogberg S, Klareskog L, Lundberg I. Cytokine production, serum levels and disease activity in systemic lupus erythematosus. Clin Exp Rheumatol 2000;18:565–70. [PubMed] [Google Scholar]
- 44. Song GG, Kim JH, Seo YH, Choi SJ, Ji JD, Lee YH. Associations between interleukin 1 polymorphisms and susceptibility to systemic lupus erythematosus: a meta‐analysis. Hum Immunol 2014;75:105–12. [DOI] [PubMed] [Google Scholar]
- 45. Sturfelt G, Roux‐Lombard P, Wollheim FA, Dayer JM. Low levels of interleukin‐1 receptor antagonist coincide with kidney involvement in systemic lupus erythematosus. Br J Rheumatol 1997;36:1283–9. [DOI] [PubMed] [Google Scholar]
- 46. Ytterberg SR, Schnitzer TJ. Serum interferon levels in patients with systemic lupus erythematosus. Arthritis Rheum 1982;25:401–6. [DOI] [PubMed] [Google Scholar]
- 47. Lopez P, Scheel‐Toellner D, Rodriguez‐Carrio J, Caminal‐Montero L, Gordon C, Suarez A. Interferon‐α‐induced B‐lymphocyte stimulator expression and mobilization in healthy and systemic lupus erthymatosus monocytes. Rheumatology (Oxford) 2014;53:2249–58. [DOI] [PubMed] [Google Scholar]
- 48. Cooper AM, Khader SA. IL‐12p40: an inherently agonistic cytokine. Trends Immunol 2007;28:33–8. [DOI] [PubMed] [Google Scholar]
- 49. Slight SR, Lin Y, Messmer M, Khader SA. Francisella tularensis LVS‐induced Interleukin‐12 p40 cytokine production mediates dendritic cell migration through IL‐12 receptor β1. Cytokine 2011;55:372–9. [DOI] [PMC free article] [PubMed] [Google Scholar]
- 50. Robinson RT, Khader SA, Locksley RM, Lien E, Smiley ST, Cooper AM. Yersinia pestis evades TLR4‐dependent induction of IL‐12(p40)2 by dendritic cells and subsequent cell migration. J Immunol 2008;181:5560–7. [DOI] [PMC free article] [PubMed] [Google Scholar]
Associated Data
This section collects any data citations, data availability statements, or supplementary materials included in this article.
Supplementary Materials
Supplementary Table 1. Demographics and autoantibody specificities of ANA+ healthy individuals.
Supplementary Table 2. Autoantibodies, ACR classification criteria, and disease activity characteristics of SLE patients.
Supplementary Table 3. Connective tissue disease screening questionnaire (CSQ) results.
Supplementary Table 4. Serum cytokine, chemokine, and other immunologic serum biomarkers.
Supplementary Table 5. Absolute cell numbers.
Supplementary Table 6. Phospho‐specific flow cytometry.