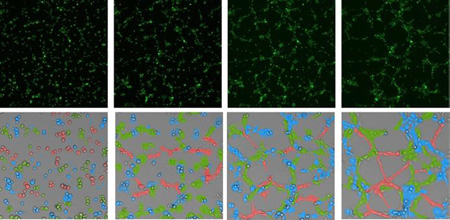
Abstract
The formation of microvascular networks plays essential roles in regenerative medicine and tissue engineering. Nevertheless, the self-organization mechanisms underlying the dynamic morphogenic process are poorly understood due to a paucity of effective tools for mapping the spatiotemporal dynamics of single cell behaviors. By establishing a single cell nanobiosensor along with live cell imaging, we perform dynamic single cell analysis of the morphology, displacement, and gene expression during microvascular self-organization. Dynamic single cell analysis reveals that endothelial cells self-organize into subpopulations with specialized phenotypes to form microvascular networks and identifies the involvement of Notch1-Dll4 signaling in regulating the cell subpopulations. The cell phenotype correlates with the initial Dll4 mRNA expression level and each subpopulation displays a unique dynamic Dll4 mRNA expression profile. Pharmacological perturbations and RNA interference of Notch1-Dll4 signaling modulate the cell subpopulations and modify the morphology of the microvascular network. Taken together, the nanobiosensor enables a dynamic single cell analysis approach underscoring the importance of Notch1-Dll4 signaling in microvascular self-organization.
Graphical abstract
1 Introduction
The capability of self-organization, or pattern formation, of cells plays an essential role in tissue development and regeneration1, 2. The formation of microvascular networks, for instance, is a multistage, multicellular process involving a complex series of molecular and cellular events, in which endothelial cells locally aggregate, migrate, proliferate, elongate, and self-organize into capillary structures3–5. During embryonic development, angioblasts self-organize to form the tubular capillary plexus de novo. Postnatal vasculogenesis mediated by endothelial progenitor cells can occur in adult tissues and is proposed as a promising therapeutic strategy for repairing ischemia and tissue injury6, 7. The ability of endothelial cells to self-organize into microvascular networks also represents a key step in the development of vascularized tissue constructs for tissue engineering and organ-on-a-chip applications8, 9. Understanding the regulatory mechanism of microvascular self-organization is therefore crucial in developing novel approaches in regenerative medicine and tissue engineering.
Vascular development is regulated by multiple signal transduction pathways and microenvironmental factors. Notch signaling, VEGF signaling, and matrix metalloproteinase activities, for instance, are major regulators of angiogenesis, the formation of new blood vessels from pre-existing ones10–12. Vasculogenesis, in contrast, involves the migration and differentiation of endothelial progenitor cells to form new blood vessels de novo. Dynamic tracking of endothelial cells cultured on reconstituted basement membrane matrix was used to model the early stage of microvascular self-organization and revealed major steps, including aggregation, elongation, and remodeling, during the formation of microvascular networks13–15. Geometry and matrix stiffness are shown to modulate the topology of microvascular networks via cell-matrix mechanical interactions16. However, the investigation of biological self-organization is often hindered by the availability of technologies for detecting the spatiotemporal behaviors of cells with single cell resolution17, 18. Despite conceptual advancements in angiogenesis19–22, the molecular and cellular mechanisms that govern the distinct phenotypic and genotypic behaviors of endothelial cells during microvascular self-organization remain poorly understood.
Here, we establish a dynamic single cell nanobiosensor for investigating microvascular self-organization. We demonstrate a gold nanorod–locked nucleic acid (GNR-LNA) nanobiosensor for dynamic single cell analysis in living endothelial cells23, 24. By incorporating the nanobiosensor with live cell imaging, we perform dynamic tracking of the cell morphology, displacement, and gene expression of individual endothelial cells during microvascular self-organization. We investigate the roles of Dll4 signaling on the phenotypes of endothelial cells during the formation of microvascular networks. Notch1-Dll4 signaling has been shown to regulate angiogenic sprouting from existing vasculatures11. However, the involvement of Dll4 in microvascular self-organization has not been elucidated. We apply the nanobiosensor to monitor the dynamic profiles of Dll4 mRNA expression in individual endothelial cells and study its regulatory roles in microvascular self-organization. Pharmacological perturbation and RNA interference are applied to disrupt Notch1-Dll4 signaling for investigating the molecular mechanisms which govern microvascular self-organization.
2 Materials and Methods
2.1 GNR-LNA probe design
The LNA probe is a 20-base nucleotide sequence with alternating LNA/DNA monomers. The LNA probe was labeled with a fluorophore (6-FAM) at the 5’ end for fluorescence detection. The design process of LNA probes was reported previously25, 26. Briefly, the LNA probe was designed to be complementary to the loop region of the target mRNA structure. The binding affinity and specificity were optimized using the mFold server and NCBI Basic Local Alignment Search Tool (BLAST) database. A random probe was designed as a control (Supplementary Table S1). All LNA probes and corresponding target DNA sequences were synthesized by Integrated DNA Technologies Inc. (IDT).
2.2 Preparation of GNR-LNA probe
LNA probes (100 nM) were prepared in 1× Tris–EDTA buffer. GNRs (Nanopartz) with 10 nm axial diameter and 67 nm length were modified with mercaptoundecyltrimethylammonnium bromide (MUTAB). The LNA probes were incubated at 95°C for 5 minutes in a water bath and cooled down to 70°C over the course of 1 hour. GNRs were incubated with LNA probes at 70°C for 30 minutes, and then cooled down to room temperature slowly. The probes were then incubated with cells for endocytic uptake.
2.3 Cell culture and reagents
Human umbilical vein endothelial cells (HUVECs) were cultured in endothelial growth basal medium and EGM™-2 BulletKit™ (EBM-2, Lonza) supplemented with 2% fetal bovine serum (FBS), 0.1% human epidermal growth factor, 0.1% R3-insulin-like growth factor-1, 0.1% ascorbic acid, 0.04% hydrocortisone, 0.4% human fibroblast growth factor β, 0.1% heparin, and 0.1% gentamicin/amphotericin B. The cells were cultured in a humidified incubator at 37°C with 5% CO2 and passaged using 0.25% Trypsin-EDTA (Invitrogen). The medium was replaced every two days. HUVECs from passage 2–7 were used in the experiments. DAPT and Jagged1 peptide were acquired from Sigma Aldrich (DAPT ≥98% (HPLC), solid, D5942) and AnaSpec (Jagged1, 188–204), respectively. To study the effects of Notch1-Dll4 signaling, HUVECs were treated with 20 µM DAPT and 20 µM Jagged1 after cell seeding. For siRNA experiments, HUVECs were seeded onto 6-well plates at a density of 200 cells/mm2 and cultured overnight. The cells were then transfected with 20 nM siRNA from Qiagen (Valencia, CA, USA) using Lipofectamine LTX Reagent (Thermo Fisher Scientific), and following the manufacturer’s instructions, incubated for 48 hours. Cells were then resuspended and seeded onto the solid Matrigel in the 48-well plates at a density of 400 cells/mm2. Images were taken 9 hours later.
2.4 In vitro self-organization
HUVECs were seeded on the 35 mm cell culture dish with a density of 4 × 10⁴ cells per dish. GNR-LNA probes (2 × 10¹¹ particles/ml) were incubated with the cells for 3 hours for endocytic uptake when the cells reach about 80% confluency. The free LNA probes in the medium that were not internalized by the cells were removed by aspirating the culture medium after incubation. The cells were then washed 3 times with 1XPBS and harvested. Growth factor reduced Matrigel was added to glass-bottom 24-well plates and incubated for 30 minutes at 37°C. The harvested HUVECs were suspended in culture medium and seeded onto the solidified Matrigel at a density of 200 cell/mm2. The 24-well plate was placed in a microscope incubator (Okolab) for live-cell imaging. Single cell gene expression dynamics were then monitored during microvascular self-organization.
2.5 Imaging and data analysis
Bright-field and fluorescence images were captured using an inverted microscope (Nikon, TE2000-U) with a HQ2 CCD camera (SensiCamQE, Cook Cork.). All fluorescence images of endothelial cells were taken with the same settings with a 1 second exposure time for comparison. Time-lapse microscopy of capillary-like network formation was performed using a confocal laser scanning microscope (Leica TCS SP8) with an interval of 10 minutes. The z-stacks of images was collapsed to maximal projection images using Leica TCS SP8 confocal software. Data collection and imaging analysis were performed using NIH ImageJ software. The cell tracking was performed in ImageJ with the MTrackJ plugin. Cells were tracked for at least 3 hours at 10 min per frame. Experiments were repeated at least 3 times, and over 100 cells were quantified for each group. Student’s t tests were used to compare two groups. For comparisons of multiple groups, one-way ANOVA with Tukey’s post hoc test was used. The Kolmogorov–Smirnov (KS) two-sample test was used to compare between different cell populations (Fig. 7).
Fig. 7.
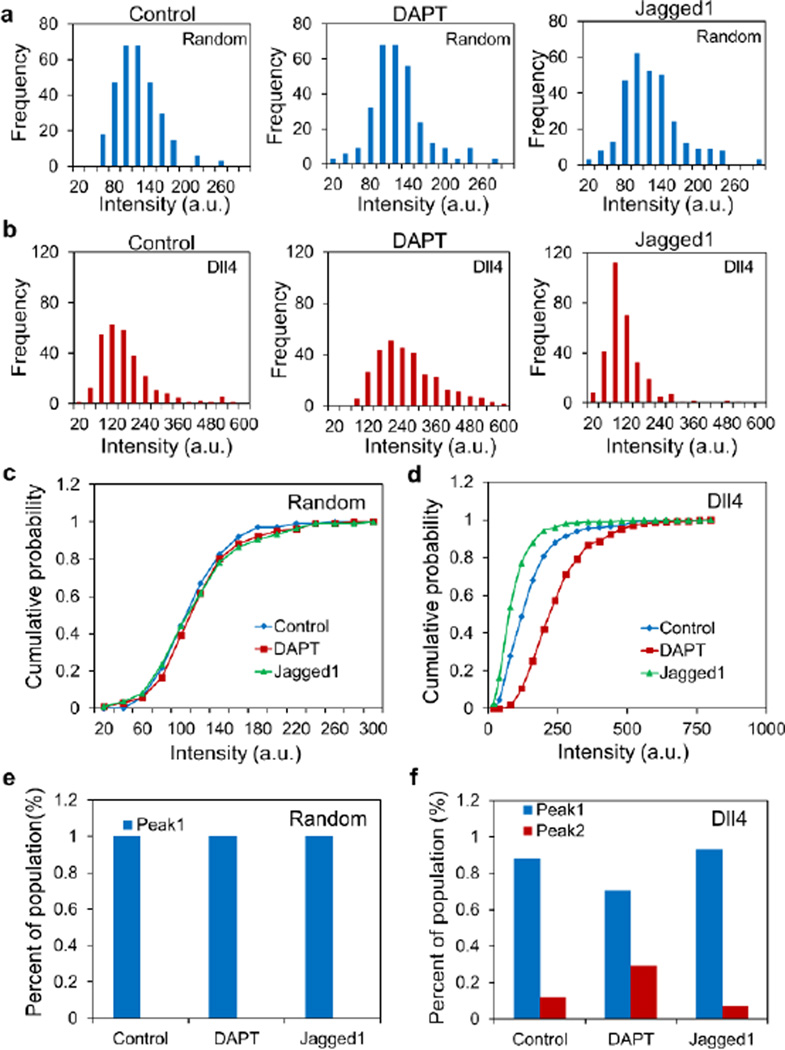
Single cell Dll4 mRNA expression analysis in microvascular networks. (a) Intensity distributions of random probe for cells in control, DAPT and Jagged1. (b) Intensity distributions of Dll4 mRNA for cells in control, DAPT and Jagged1. (c–d) Cumulative probability distributions of random probe and Dll4 expression. (e–f) Distributions of Dll4 expressing cells under different treatments. Data are derived from over 100 cells in each group (n=5).
3 Results
3.1 Dynamic single cell analysis during microvascular self-organization
We establish a GNR-LNA nanobiosensor for dynamic single cell gene expression analysis during microvascular network formation (Fig. 1a). The LNA probe spontaneously binds to the GNR to form the GNR-LNA complex. In close proximity, the fluorophore at the 5’ end of the LNA probe is quenched by the GNR due to its intrinsic fluorescence quenching ability27. The GNR-LNA nanobiosensor is internalized into cells through endocytosis without the requirement of transfection or microinjection. Endocytic uptake minimizes the disturbance to the cells and enables highly parallel delivery of the nanobiosensor into the cells. Furthermore, the GNR-LNA nanobiosensor avoids the accumulation of probes in nuclei observed in transfection of molecular beacons and double-stranded probes25, 28. The LNA probe is designed to have a high binding affinity with the target. In the presence of a target mRNA, the LNA probe is thermodynamically displaced from the GNRs to bind to the specific target sequences. The displacement reaction permits the fluorophore to fluoresce, detecting the gene expression at the single cell level (Fig. 1b).
Fig. 1.
Single cell analysis during microvascular self-organization. (a) Schematic illustration of the GNR-LNA nanobiosensor. (b) Dll4 mRNA expression in individual HUVECs. Scale bar, 20 µm. (c) Dll4 gene expression tracking of HUVECs during microvascular self-organization. Scale bars, 400 µm. (d) Displacement tracking of HUVECs. Lines represent cell trajectories. Scale bars, 100 µm. (e) Morphology tracking of cells with different phenotypes. Scale bars, 100 µm. Images are representative from three independent experiments.
Under physiological conditions, endothelial cells are in contact with the basement membrane, which forms a continuous sleeve around the cells to support the stability of the microvascular structures. Endothelial cells cultured on basement membrane matrix can self-organize into microvascular networks. The in vitro microvascular self-organization assay captures the cell aggregation, migration, and elongation steps during capillary formation and has been applied for investigating angiogenic and antiangiogenic factors, elucidating molecular mechanisms involved in angiogenesis and vasculogenesis, and screening angiogenic inhibitors13–15, 29, 30. Using the GNR-LNA nanobiosensor, we performed dynamic monitoring of mRNA expression in single cells during microvascular self-organization (Fig. 1c). The microvascular structures were similar with and without GNR-LNA (Supplementary Fig. S1a–b). The viability of endothelial cells with and without GNRs were also evaluated. There is no significant difference between the cell viability of endothelial cells with and without GNR after 48 hours, supporting the use of the GNR-LNA nanobiosensor for investigating microvascular self-organization (Supplementary Fig. 1c). Since the GNR-LNA assay maintains the cell viability, the gene expression and phenotypic behaviors, including migration and morphology, of the cells can be monitored simultaneously and dynamically during microvascular self-organization (Fig. 1d–e).
3.2 Endothelial cells self-organize into subpopulations with distinct phenotypes
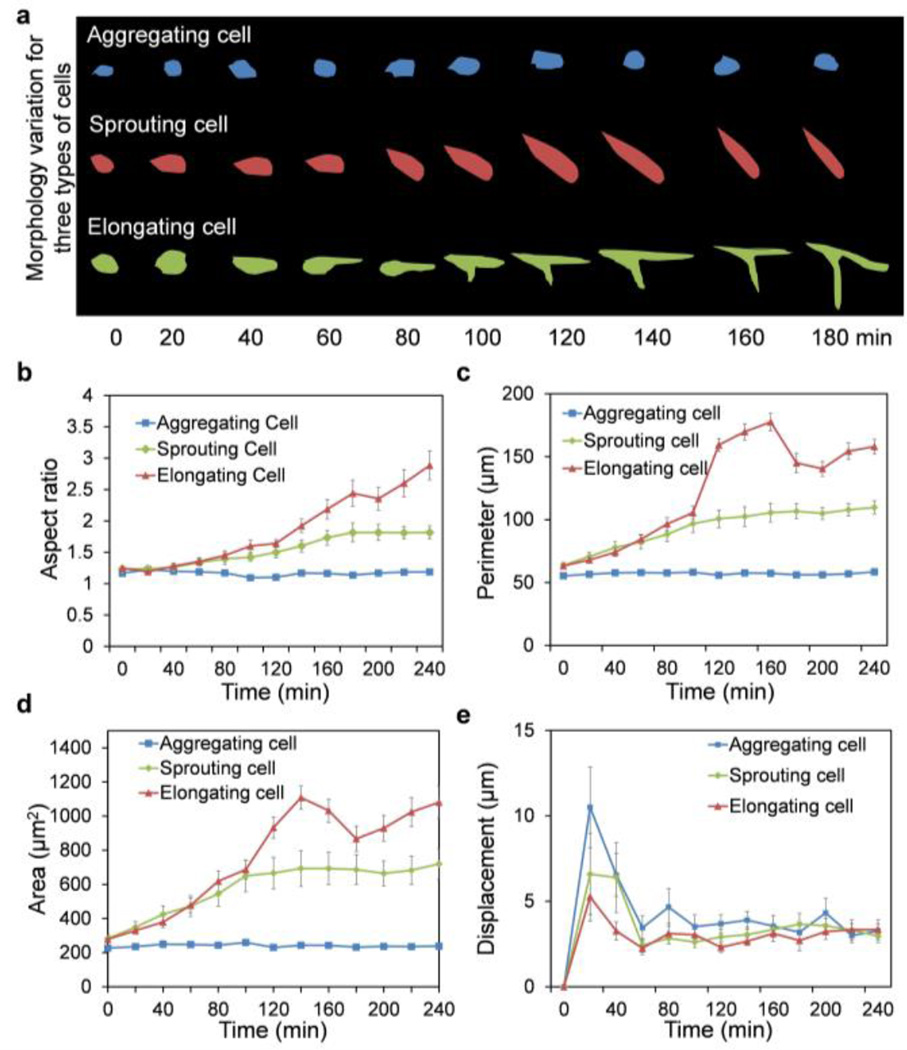
We characterized the early-stage behaviors of individual endothelial cells during microvascular self-organization. Endothelial cells aggregated, sprouted, and elongated to form microvascular networks. By close examination of the morphological changes, endothelial cells could be categorized into at least three major cell subpopulations with distinct phenotypic behaviors: aggregating cells, sprouting cells, and elongating cells (Fig. 2a). These phenotypes were quantitatively defined by measuring the aspect ratio, perimeter, area, and displacement of cells over time (Fig. 2b–e). The aspect ratio of cells is defined by the ratio between the longest axis and the shortest axis of the fitted ellipse. The displacement is calculated based on the displacement of the center of mass of cells. The aggregating cells maintained the aspect ratio, perimeter, and area for the duration of the experiment. In contrast, the elongating cells exhibited large increases in cell area and perimeter. Large, transient increases in the area and perimeter of elongating cells were observed between 120–150 minutes after cell seeding. The sprouting cells, on the other hand, were characterized by a continuous, steady increase in the cell area and perimeter. Furthermore, the elongating cells connected to neighboring cells on both ends along the longest axes while the sprouting cells had a free sprouting end. For all subpopulations, the cells showed large displacement in the first hour. Aggregating cells exhibited the largest displacement compared to the sprouting and elongating subpopulations (Supplementary Fig. S2).
Fig. 2.
Phenotypic behaviors of aggregating cells, sprouting cells and elongating cells. (a) Representative morphologies of cell subpopulations. (b) Aspect ratio tracking of HUVECs. The aspect ratio is defined as the ratio between the longest axis and the shortest axis. (c) Perimeter tracking of HUVECs. (d) Area tracking of HUVECs. Area is defined as the projected area in the image. (e) Displacement tracking of HUVECs. Data represent over 100 cells in each group and are expressed as mean ± s.e.m. (n=3).
3.3 Cell subpopulations display unique Dll4 mRNA expression profiles
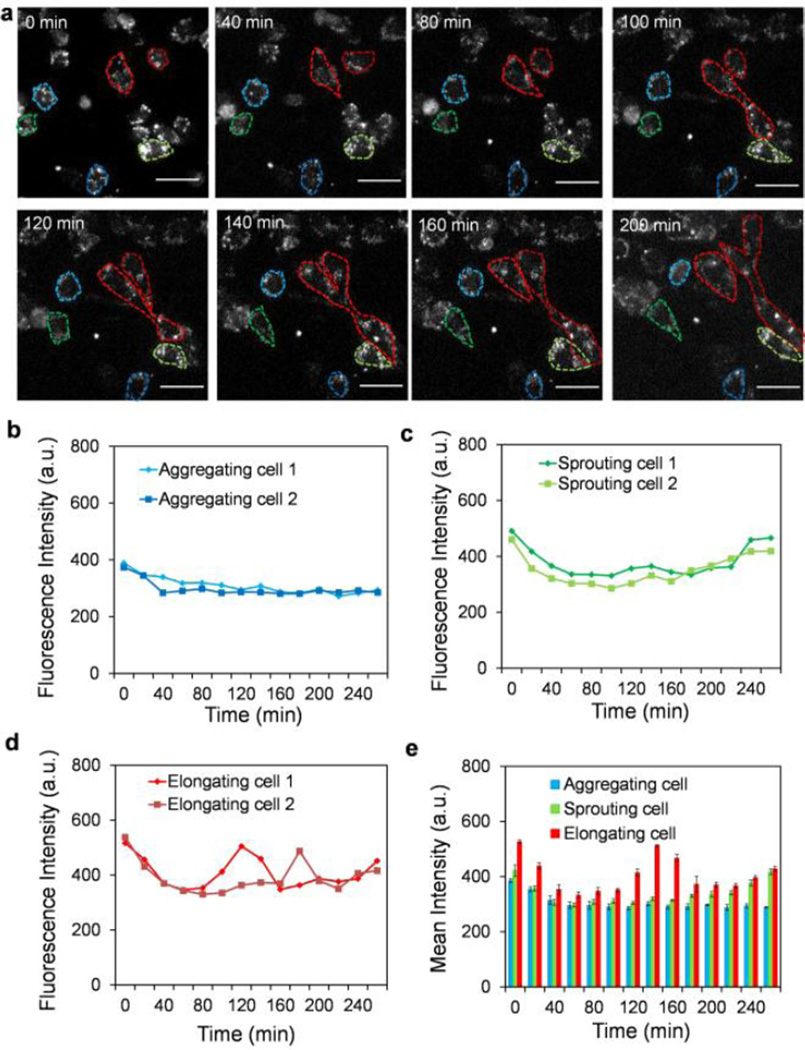
To explore the molecular mechanisms that control the cell subpopulations, the Dll4 mRNA expressions of individual endothelial cells were monitored dynamically. Fig. 3a shows time-lapse fluorescence images of endothelial cells with LNA probes targeting Dll4 mRNA. A random probe was included as a control (Supplementary Fig. S3–4). The gene expression profile was determined for each individual cell. Fig. 3b–d shows Dll4 mRNA expression profiles of representative cells for each subpopulation. A decrease in Dll4 mRNA expression was observed for all cells in the first hour. The levels of Dll4 mRNA remained constant for aggregating cells for the duration of the experiment. For sprouting cells, a steady increase in the Dll4 mRNA expression was observed 180 minutes after cell seeding. Interestingly, a transient increase in the Dll4 mRNA expression was observed for elongating cells between 120 and 180 minutes. These trends were also observed on the average gene expression profiles of the cell subpopulations (Fig. 3e). Representative images of the cell subpopulations are shown in Supplementary Fig. S5–7. Interestingly, the dynamic Dll4 mRNA expression profiles, especially the transient behaviours of sprouting cells, correlate with the morphological changes for the cell subpopulations. These results suggest the involvement of Dll4 in the regulation of microvascular self-organization.
Fig. 3.
Single cell gene expression analysis during microvascular self-organization. (a) Time-lapse fluorescence microscopy for monitoring Dll4 mRNA expression dynamics during microvascular self-organization. Scale bars, 50 µm. (b–d) Dll4 mRNA expression dynamics of representative aggregating cells, sprouting cells and elongating cells. (e) Comparison of Dll4 mRNA expression of three cell subpopulations during microvascular self-organization. Data represent over 100 cells in each group and are expressed as mean ± s.e.m. (n=3).
3.4 The cell phenotype correlates with the Dll4 mRNA expression initially
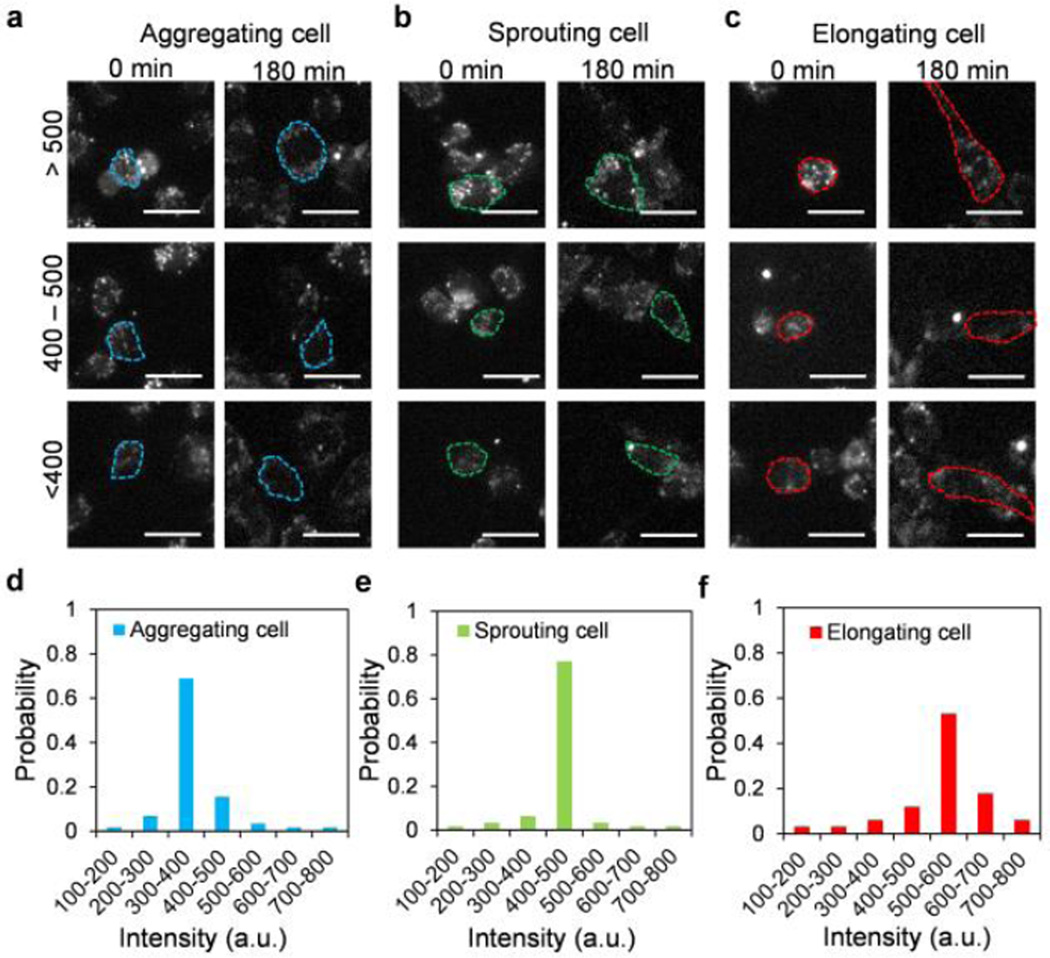
Dynamic analysis of cell phenotypes and Dll4 expression profiles suggest that endothelial cells specialize into cell subpopulations to form microvascular networks. We further analysed the effects of the initial Dll4 distributions immediately after cell seeding on the cell phenotypes. Fig. 4a–c shows representative images of aggregating cells, sprouting cells, and elongating cells at 0 minute and 180 minutes. Fig. 4d–f shows the initial Dll4 distributions for the cell subpopulations (Fig. 4d–f). In general, each cell subpopulation displayed a narrow distribution of Dll4 mRNA expression. Interestingly, the Dll4 mRNA expression at the initial stage correlated with the cell phenotypes during microvascular self-organization. In particular, endothelial cells with a low level (300–400 a.u.) of Dll4 mRNA expression were most likely to acquire the aggregating phenotype. Cells with an intermediate range (400–500 a.u.) of Dll4 mRNA expression tended to sprout while cells with a high level (500–600 a.u.) of Dll4 mRNA expression became the elongating cell subpopulation. The cell morphology, dynamic Dll4 expression profiles, and Dll4 expression distribution, therefore, collectively support the involvement of Dll4 in the regulation of microvascular self-organization.
Fig. 4.
Dll4 mRNA expression distributions in cell subpopulations. (a–c) Dll4 mRNA expressions of aggregating cell, sprouting cell and elongating cell. Scale bars, 20 µm. (d–f) Distributions of Dll4 mRNA expression in aggregating cells, sprouting cells and elongating cells. Data represent over 100 cells in each group.
3.5 Perturbing Notch1-Dll4 signaling modulates microvascular self-organization
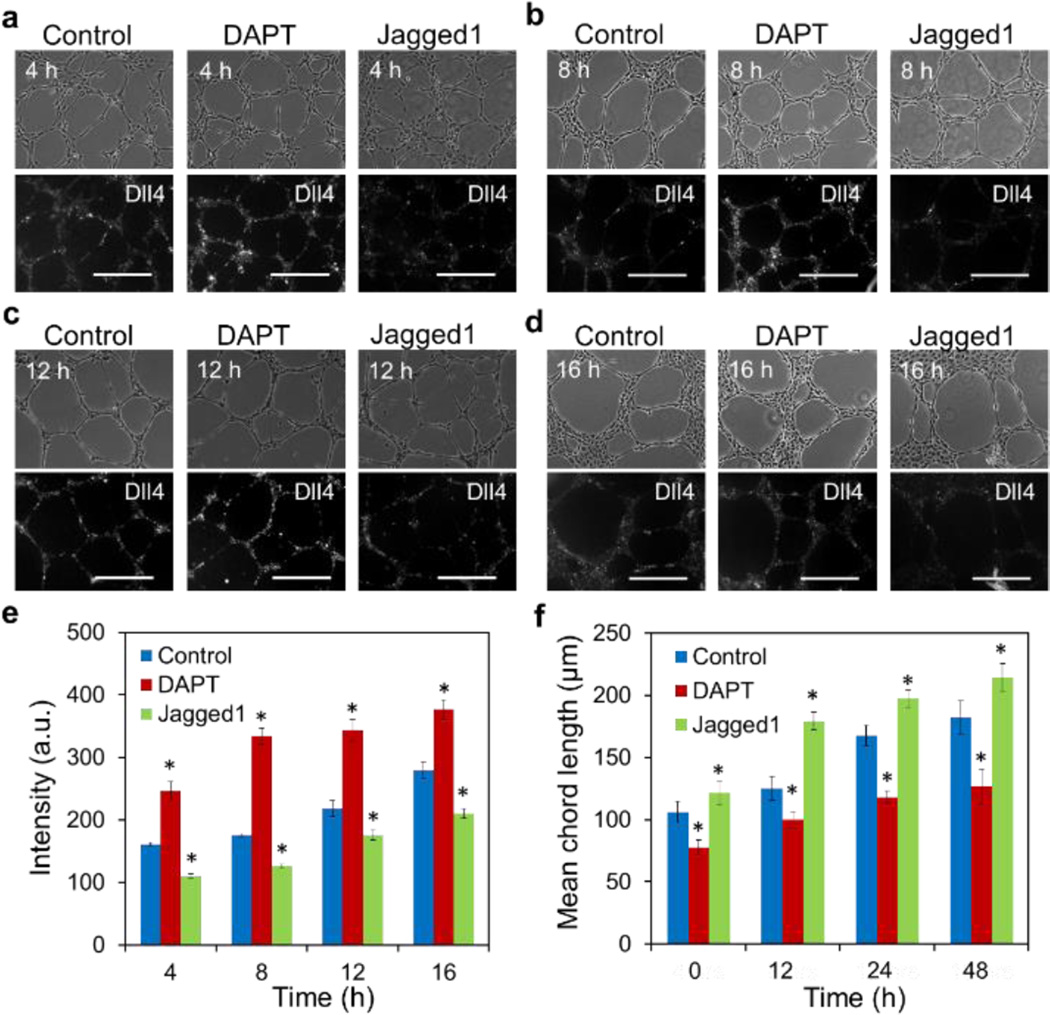
We perturbed Notch1-Dll4 signaling and examined the microvascular network architecture to evaluate the importance of Dll4 in microvascular self-organization. HUVECs were treated with a γ-secretase inhibitor DAPT (an inhibitor of the Notch signaling pathway) and Jagged1 peptide (activates Notch by inhibiting the function of endogenous Jagged1) during microvascular self-organization. The self-organization process and Dll4 mRNA expression under different treatments were measured dynamically (Fig. 5a–d). A random probe was included as the control (Supplementary Fig. S8). The Notch inhibitor, DAPT, upregulated Dll4 mRNA expression while the Jagged1 peptide, reduced the Dll4 mRNA expression by activating Notch via inhibiting the function of endogenous Jagged1. (Fig. 5e). The effects of DAPT and Jagged1 on the network architecture were quantified by measuring the mean chord length of the networks (Fig. 5f). DAPT increased the Dll4 mRNA expression and induced a hyperbranching morphology with a short mean chord length. In contrast, Jagged1 reduced the Dll4 mRNA expression and resulted in a large mean chord length of the microvascular networks. These results suggest a positive correlation between Dll4 mRNA expression and network density (inverse of the mean chord length).
Fig. 5.
Notch signaling modulates Dll4 mRNA expression and microvascular network architecture. (a–d) Bright-field and fluorescence images of microvascular networks in control, DAPT, and Jagged1 at 4 hours, 8 hours, 12 hours and 16 hours, respectively. Scale bars, 200 µm. (e) Mean fluorescence intensity of Dll4 mRNA expression in microvascular networks. Data represent over 100 cells in each group and are expressed as mean ± s.e.m. (n=5, * P<0.001). (f) Mean chord lengths of microvascular networks at different time points. Data are expressed as mean ± s.e.m. (n=5, * P<0.001)
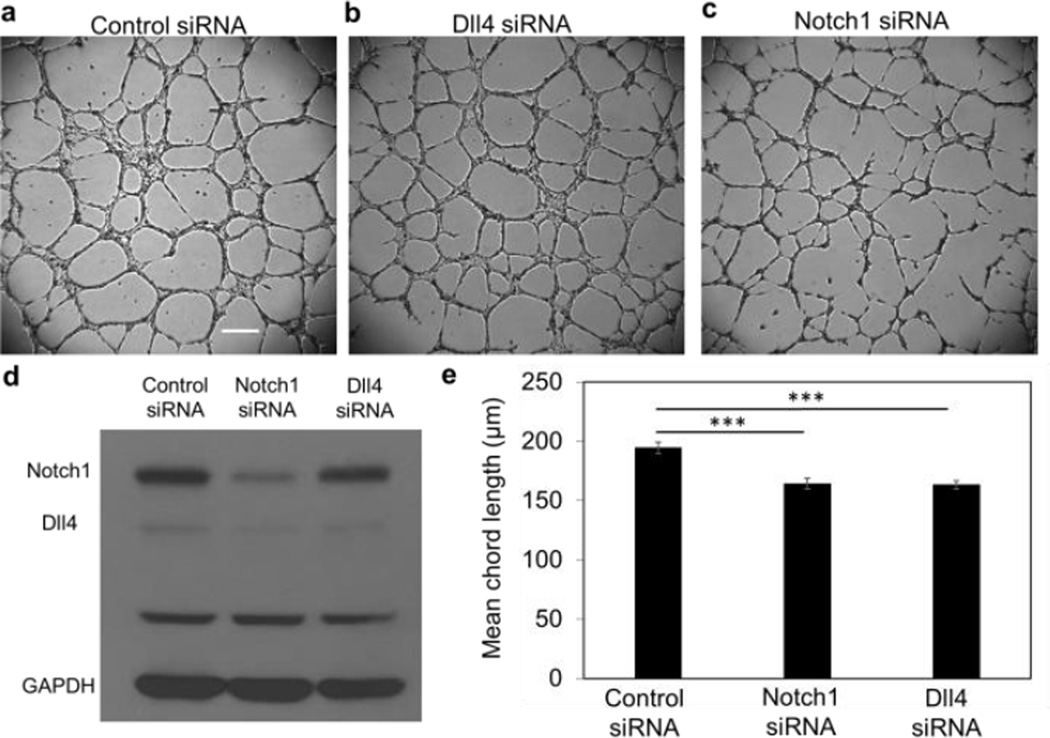
RNA interference was also applied to investigate the effects of Notch1-Dll4 signaling on the architecture of microvascular networks. HUVECs were treated with control siRNA, Notch1 siRNA, and Dll4 siRNA before microvascular network formation (Fig. 6a–c). The efficiencies of the siRNA were characterized by immunoblotting (Fig. 6d). With Dll4 siRNA, the level of Dll4 expression was reduced by approximately 50% (Fig. S9a). Notch1 siRNA reduced the expression of Notch1 and Dll4 by approximately 25% and 60%, respectively (Fig. S9b). Quantification of the mean chord length of the networks revealed that both Notch1 siRNA and Dll4 siRNA resulted in denser networks compared to control siRNA (Fig. 6e). These results further support the notion that Dll4 positively correlates with network density.
Fig. 6.
Notch1-Dll4 signaling modulates microvascular network architecture. (a–c) Bright-field images of in vitro microvascular networks formed at 9 hours after cell seeding. Scale bar, 300 µm. HUVECs were treated with (a) control siRNA, (b) Dll4 siRNA and (c) Notch1 siRNA. (d) Western blot analysis of Notch1 and Dll4 mRNA expressions in HUVEC networks with siRNA treatment. Data are representative from three independent experiments. (e) Statistical analysis of the mean chord length of the HUVEC networks. Data are expressed as mean ± s.e.m. (n = 8; ***P<0.001; unpaired Student’s t-test).
3.6 Endothelial cells display bimodal distributions in Dll4 mRNA expression during microvascular network formation
The distributions of Dll4 mRNA expression in HUVECs were analysed to further investigate the regulation of microvascular self-organization. Fig. 7a–b shows the intensity distributions of random and Dll4 probes in cells treated with DAPT and Jagged1. The intensity of the random probe displayed a narrow, bell-shape distribution. DAPT and Jagged1 treatments had minimal effects on the mean and standard deviation of the distribution. For Dll4, the intensities of cells under different treatments displayed wide, multimodal-like distributions. In agreement with the dynamic measurement results (Fig. 5), the Dll4 mRNA expression was increased by DAPT and decreased by Jagged1. The cumulative probability of random and Dll4 probes confirmed the effects of DAPT and Jagged1 on the distributions of Dll4 and random probes (Fig. 7c–d). The Kolmogorov–Smirnov (KS) two-sample test was used to calculate the statistical distance (D) between two populations of cells with different treatments. The test statistic (D) and p-value were measured between the cells with the treatment (treated with DAPT or Jag1) and cells without treatment (control), respectively. The KS test results verified the significant difference of Dll4 mRNA expression with DAPT and Jag1 treatments. Meanwhile, the KS test results rejected the hypothesis of significant difference of fluorescence intensity of random probe with DAPT and Jag1 treatments (Supplementary Tab. S2). The multimodal-like distribution suggested a Dll4-expressing cell subpopulation may exist. The distributions were analysed by two methods, including fitting the data into bimodal functions and defining a threshold to estimate the Dll4-expression subpopulation (Fig. 7e–f). For the random probe, the intensity data followed a Gaussian distribution and did not result in distinct subpopulations (Fig. 7e). For Dll4, the data suggested a Dll4-expressing subpopulation existed among the cells. The Dll4-expressing subpopulation comprised 12% of the cells. With DAPT, the Dll4-expressing subpopulation increased to 30%. In contrast, the subpopulation decreased to 7% with Jagged1 treatment. These data further support the importance of Notch1-Dll4 signaling in regulating the cell subpopulation during microvascular self-organization.
4 Discussions
In this study, the GNR-LNA nanobiosensor is exploited to monitor the mRNA expression of endothelial cells during microvascular self-organization. Unlike conventional techniques, such as RT-PCR or northern blot, that require a large number of cells, the nanobiosensor detects gene expression at the single cell level. Compared to other single cell analysis techniques, such as RNA in situ hybridization, single cell transcriptomics, and microfluidic single cell analysis31–34, the nanobiosensor does not require cell lysis or fixation, permitting the investigation of dynamic morphogenic processes. This ability enables us to correlate the initial Dll4 mRNA expression to the cell behaviors and to monitor the dynamic gene expression profiles of individual cells. Furthermore, the nanobiosensor is capable of investigating a large number of cells to analyze diverse cell behaviors. The effectiveness of the GNR-LNA nanobiosensor, which has a low cytotoxicity and does not require genetic modification, will facilitate the adoption of the single cell analysis approach for investigating a wide variety of biomedical applications in the future.
Using the GNR-LNA nanobiosensor, we investigate the self-organization of microvascular networks in vitro. The results indicate endothelial cells specialize into subpopulations during microvascular self-organization. Aggregating cells migrate and aggregate to form the nodes of the microvascular networks. Sprouting cells and elongating cells form the branches and chords of the microvascular networks. The formation of cell subpopulations is in good agreement with previous observations of microvascular assembly13, 14. Remarkably, our results reveal a pivotal role of Notch1-Dll4 signaling in the regulation of the cell subpopulations. Dll4 mRNA is dynamically regulated in sprouting and elongating cells, and correlates with the phenotypic behaviors of cells. Pharmacological and siRNA perturbations further support the notion that Notch1-Dll4 signaling modulates the sprouting and elongating subpopulations, which relate to the density of the microvascular networks. Our results reveal the importance of Notch1-Dll4 signaling in regulating the cell subpopulations and microvascular networks.
Notch is an evolutionarily conserved intercellular signaling pathway that regulates numerous cell-fate specification events, such as neural differentiation and developmental patterning35. Notch1-Dll4 signaling is also known to control tip cell formation during angiogenic sprouting and leader cell formation during epithelial collective cell migration11, 36. Interestingly, microvascular self-organization de novo and angiogenic sprouting are generally considered to be two distinct morphogenic mechanisms in vascular development37. While it is reported that Notch1 signaling pathway regulates retinal angiogenesis by mediating tip cell formation, the role of Notch1 signaling during vasculogenesis is obscure. Our results underscore the notion that the two vascular development programs may be commonly regulated by the Notch1-Dll4 signaling. Further mechanistic studies, using 2D and 3D models of in vitro and in vivo vasculogenesis and angiogenesis, are required to elucidate the molecular and cellular processes that regulate microvascular development.
5 Conclusions
We demonstrate a GNR-LNA nanobiosensor for exploring individual endothelial cell behaviours during microvascular self-organization. Our results suggest the Notch1-Dll4 signaling modulates microvascular self-organization by controlling the cell subpopulations. Since complex spatiotemporal dynamics are a hallmark of tissue development and regeneration, the GNR-LNA nanobiosensor will have the potential to serve as an effective platform for investigating various morphogenic processes in the future.
Supplementary Material
Acknowledgments
This work is supported by NIH Director's New Innovator Award (DP2OD007161).
Footnotes
Electronic Supplementary Information (ESI) available: LNA/DNA probe sequence, random probe results, KS test results
References
- 1.Yamada KM, Cukierman E. Cell. 2007;130:601–610. doi: 10.1016/j.cell.2007.08.006. [DOI] [PubMed] [Google Scholar]
- 2.Karsenti E. Nature reviews. Molecular cell biology. 2008;9:255–262. doi: 10.1038/nrm2357. [DOI] [PubMed] [Google Scholar]
- 3.Coultas L, Chawengsaksophak K, Rossant J. Nature. 2005;438:937–945. doi: 10.1038/nature04479. [DOI] [PubMed] [Google Scholar]
- 4.Risau W. Nature. 1997;386:671–674. doi: 10.1038/386671a0. [DOI] [PubMed] [Google Scholar]
- 5.Carmeliet P. Nature medicine. 2000;6:389–395. doi: 10.1038/74651. [DOI] [PubMed] [Google Scholar]
- 6.Asahara T, Kawamoto A. American journal of physiology. Cell physiology. 2004;287:C572–C579. doi: 10.1152/ajpcell.00330.2003. [DOI] [PubMed] [Google Scholar]
- 7.Balaji S, King A, Crombleholme TM, Keswani SG. Advances in wound care. 2013;2:283–295. doi: 10.1089/wound.2012.0398. [DOI] [PMC free article] [PubMed] [Google Scholar]
- 8.Chamberlain MD, West ME, Lam GC, Sefton MV. Annals of biomedical engineering. 2015;43:1189–1200. doi: 10.1007/s10439-014-1146-x. [DOI] [PubMed] [Google Scholar]
- 9.Rouwkema J, Rivron NC, van Blitterswijk CA. Trends in biotechnology. 2008;26:434–441. doi: 10.1016/j.tibtech.2008.04.009. [DOI] [PubMed] [Google Scholar]
- 10.Van Gieson EJ, Skalak TC. Microcirculation. 2001;8:25–31. [PubMed] [Google Scholar]
- 11.Hellstrom M, Phng LK, Hofmann JJ, Wallgard E, Coultas L, Lindblom P, Alva J, Nilsson AK, Karlsson L, Gaiano N, Yoon K, Rossant J, Iruela-Arispe ML, Kalen M, Gerhardt H, Betsholtz C. Nature. 2007;445:776–780. doi: 10.1038/nature05571. [DOI] [PubMed] [Google Scholar]
- 12.Hoeben A, Landuyt B, Highley MS, Wildiers H, Van Oosterom AT, De Bruijn EA. Pharmacological Reviews. 2004;56:549–580. doi: 10.1124/pr.56.4.3. [DOI] [PubMed] [Google Scholar]
- 13.Parsa H, Upadhyay R, Sia SK. P Natl Acad Sci USA. 2011;108:5133–5138. doi: 10.1073/pnas.1007508108. [DOI] [PMC free article] [PubMed] [Google Scholar]
- 14.Serini G, Ambrosi D, Giraudo E, Gamba A, Preziosi L, Bussolino F. Embo Journal. 2003;22:1771–1779. doi: 10.1093/emboj/cdg176. [DOI] [PMC free article] [PubMed] [Google Scholar]
- 15.Merks RMH, Brodsky SV, Goligorksy MS, Newman SA, Glazier JA. Developmental biology. 2006;289:44–54. doi: 10.1016/j.ydbio.2005.10.003. [DOI] [PMC free article] [PubMed] [Google Scholar]
- 16.Sun J, Jamilpour N, Wang FY, Wong PK. Biomaterials. 2014;35:3273–3280. doi: 10.1016/j.biomaterials.2013.12.101. [DOI] [PMC free article] [PubMed] [Google Scholar]
- 17.Sun J, Xiao Y, Wang S, Slepian MJ, Wong PK. Journal of laboratory automation. 2015;20:127–137. doi: 10.1177/2211068214554802. [DOI] [PubMed] [Google Scholar]
- 18.Kondo S, Miura T. Science. 2010;329:1616–1620. doi: 10.1126/science.1179047. [DOI] [PubMed] [Google Scholar]
- 19.Bentley K, Franco CA, Philippides A, Blanco R, Dierkes M, Gebala V, Stanchi F, Jones M, Aspalter IM, Cagna G, Westrom S, Claesson-Welsh L, Vestweber D, Gerhardt H. Nature cell biology. 2014;16:309–321. doi: 10.1038/ncb2926. [DOI] [PubMed] [Google Scholar]
- 20.Benedito R, Rocha SF, Woeste M, Zamykal M, Radtke F, Casanovas O, Duarte A, Pytowski B, Adams RH. Nature. 2012;484:110–114. doi: 10.1038/nature10908. [DOI] [PubMed] [Google Scholar]
- 21.Carmeliet P, Jain RK. Nature. 2011;473:298–307. doi: 10.1038/nature10144. [DOI] [PMC free article] [PubMed] [Google Scholar]
- 22.Mammoto A, Connor KM, Mammoto T, Yung CW, Huh D, Aderman CM, Mostoslavsky G, Smith LEH, Ingber DE. Nature. 2009;457:1103-U1157. doi: 10.1038/nature07765. [DOI] [PMC free article] [PubMed] [Google Scholar]
- 23.Wang S, Riahi R, Li N, Zhang DD, Wong PK. Advanced materials. 2015;27:6034–6038. doi: 10.1002/adma.201502814. [DOI] [PubMed] [Google Scholar]
- 24.Riahi R, Wang S, Long M, Li N, Chiou PY, Zhang DD, Wong PK. Acs Nano. 2014;8:3597–3605. doi: 10.1021/nn500107g. [DOI] [PMC free article] [PubMed] [Google Scholar]
- 25.Riahi R, Dean Z, Wu TH, Teitell MA, Chiou PY, Zhang DD, Wong PK. Analyst. 2013;138:4777–4785. doi: 10.1039/c3an00722g. [DOI] [PMC free article] [PubMed] [Google Scholar]
- 26.Dean ZS, Riahi R, Wong PK. Biomaterials. 2015;37:156–163. doi: 10.1016/j.biomaterials.2014.10.022. [DOI] [PMC free article] [PubMed] [Google Scholar]
- 27.Dubertret B, Calame M, Libchaber AJ. Nature Biotechnology. 2001;19:365–370. doi: 10.1038/86762. [DOI] [PubMed] [Google Scholar]
- 28.Li N, Wong PK. Bioanalysis. 2010;2:1689–1699. doi: 10.4155/bio.10.116. [DOI] [PubMed] [Google Scholar]
- 29.Arnaoutova I, Kleinman HK. Nature protocols. 2010;5:628–635. doi: 10.1038/nprot.2010.6. [DOI] [PubMed] [Google Scholar]
- 30.Montesano R, Orci L, Vassalli P. The Journal of cell biology. 1983;97:1648–1652. doi: 10.1083/jcb.97.5.1648. [DOI] [PMC free article] [PubMed] [Google Scholar]
- 31.Tautz D, Pfeifle C. Chromosoma. 1989;98:81–85. doi: 10.1007/BF00291041. [DOI] [PubMed] [Google Scholar]
- 32.Wang F, Flanagan J, Su N, Wang LC, Bui S, Nielson A, Wu X, Vo HT, Ma XJ, Luo Y. J Mol Diagn. 2012;14:22–29. doi: 10.1016/j.jmoldx.2011.08.002. [DOI] [PMC free article] [PubMed] [Google Scholar]
- 33.Sandberg R. Nature methods. 2014;11:22–24. doi: 10.1038/nmeth.2764. [DOI] [PubMed] [Google Scholar]
- 34.Lecault V, White AK, Singhal A, Hansen CL. Current Opinion in Chemical Biology. 2012;16:381–390. doi: 10.1016/j.cbpa.2012.03.022. [DOI] [PubMed] [Google Scholar]
- 35.Artavanis-Tsakonas S, Rand MD, Lake RJ. Science. 1999;284:770–776. doi: 10.1126/science.284.5415.770. [DOI] [PubMed] [Google Scholar]
- 36.Riahi R, Sun J, Wang S, Long M, Zhang DD, Wong PK. Nature communications. 2015;6:6556. doi: 10.1038/ncomms7556. [DOI] [PMC free article] [PubMed] [Google Scholar]
- 37.Poole TJ, Coffin JD. The Journal of experimental zoology. 1989;251:224–231. doi: 10.1002/jez.1402510210. [DOI] [PubMed] [Google Scholar]
Associated Data
This section collects any data citations, data availability statements, or supplementary materials included in this article.


