

Abstract
Key points
Motor neurons in a pool receive both common and independent synaptic inputs, although the proportion and role of their common synaptic input is debated.
Classic correlation techniques between motor unit spike trains do not measure the absolute proportion of common input and have limitations as a result of the non‐linearity of motor neurons.
We propose a method that for the first time allows an accurate quantification of the absolute proportion of low frequency common synaptic input (<5 Hz) to motor neurons in humans.
We applied the proposed method to three human muscles and determined experimentally that they receive a similar large amount (>60%) of common input, irrespective of their different functional and control properties.
These results increase our knowledge about the role of common and independent input to motor neurons in force control.
Abstract
Motor neurons receive both common and independent synaptic inputs. This observation is classically based on the presence of a significant correlation between pairs of motor unit spike trains. The functional significance of different relative proportions of common input across muscles, individuals and conditions is still debated. One of the limitations in our understanding of correlated input to motor neurons is that it has not been possible so far to quantify the absolute proportion of common input with respect to the total synaptic input received by the motor neurons. Indeed, correlation measures of pairs of output spike trains only allow for relative comparisons. In the present study, we report for the first time an approach for measuring the proportion of common input in the low frequency bandwidth (<5 Hz) to a motor neuron pool in humans. This estimate is based on a phenomenological model and the theoretical fitting of the experimental values of coherence between the permutations of groups of motor unit spike trains. We demonstrate the validity of this theoretical estimate with several simulations. Moreover, we applied this method to three human muscles: the abductor digiti minimi, tibialis anterior and vastus medialis. Despite these muscles having different functional roles and control properties, as confirmed by the results of the present study, we estimate that their motor pools receive a similar and large (>60%) proportion of common low frequency oscillations with respect to their total synaptic input. These results suggest that the central nervous system provides a large amount of common input to motor neuron pools, in a similar way to that for muscles with different functional and control properties.
Key points
Motor neurons in a pool receive both common and independent synaptic inputs, although the proportion and role of their common synaptic input is debated.
Classic correlation techniques between motor unit spike trains do not measure the absolute proportion of common input and have limitations as a result of the non‐linearity of motor neurons.
We propose a method that for the first time allows an accurate quantification of the absolute proportion of low frequency common synaptic input (<5 Hz) to motor neurons in humans.
We applied the proposed method to three human muscles and determined experimentally that they receive a similar large amount (>60%) of common input, irrespective of their different functional and control properties.
These results increase our knowledge about the role of common and independent input to motor neurons in force control.
Abbreviations
- ADM
abductor digiti minimi
- CDI
common drive index
- CIS
common input strength
- CST
cumulative or composite spike train
- EMG
electromyography
- ISI
interspike interval
- LIF
leaky integrate‐and‐fire
- MVC
maximal voluntary contraction
- PCI
proportion of common input
- TA
tibialis anterior
- VM
vastus medialis
Introduction
Motor neurons in the spinal cord individually receive thousands of excitatory and inhibitory synaptic inputs (Heckman & Enoka, 2004, 2012). To improve the controllability of the motor system, some of these inputs are shared across motor neurons in the same motor pool and between different motor nuclei (Ishizuka et al. 1979; Lawrence et al. 1985). This generates common fluctuations in the membrane potentials of the motor neurons that determine significant correlation levels between their output spike trains (De Luca et al. 1982; Semmler, 2002). For this reason, the amount of correlation between pairs of motor unit spike trains has been used to infer connections in the spinal neural networks (Kirkwood & Sears, 1978; Farmer et al. 1997; Vaughan & Kirkwood, 1997). Classically, the degree of correlation between pairs of motor unit spike trains in individual muscles has been considered as an indication of the number of last‐order cortical projections on their motor neuron pools (Kirkwood, 1979). In general, the estimated levels of correlation in motor unit spike trains are relatively low. This phenomenon has been interpreted in the presence of only a small amount of shared synaptic input to the motor neurons (De Luca et al. 1993). However, recent studies have demonstrated that this interpretation may be not fully correct (Taylor & Enoka, 2004; Keen et al. 2012; Negro & Farina, 2012).
Time and frequency domain measures between pairs of motor neuron spike trains are influenced by the non‐linear nature of the motor neurons (de la Rocha et al. 2007; Tchumatchenko et al. 2010, 2011; Negro & Farina, 2012). Because of this non‐linearity, there is no direct association between correlation measures of the motor neuron outputs and the correlation in input. Moreover, pairwise correlations of spike trains have high variability (Negro & Farina, 2012; Farina & Negro, 2015), which limits any interpretation of the results (Schmied & Descarreaux, 2010). Finally, the classic correlation approach to pairs of motor units does not provide insight into the statistical structure carried by a population of motor neurons (Averbeck et al. 2006; Negro & Farina, 2011 b). In addition to these problems, the main limitation to our understanding of the role of common input to motor neurons is that, so far, it has not been possible to measure the absolute proportion of common input to motor pools. Indeed, the correlation between output spike trains is not a measure of the input correlation (de la Rocha et al. 2007; Tchumatchenko et al. 2010, 2011) and can only be used for relative comparisons (Nordstrom et al. 1989; Nordstrom & Miles, 1990; Nordstrom et al. 1992; Semmler et al. 1997; Semmler et al. 2004; Keen et al. 2012).
In the present study, we focus on the low frequency band (<5 Hz) of common synaptic input because this bandwidth is directly associated with force generation (De Luca & Erim, 1994). We first provide a theoretical description based on a phenomenological model of the level of correlation between the outputs of populations of motor neurons that receive a combination of common and independent synaptic inputs. The independent synaptic input resembles the summation of synaptic fluctuations that are individual for each motor neuron (e.g. membrane noise) and the common synaptic input refers to the contribution that is shared across the motor neuron pool (e.g. control signal). From this derivation, we show that a reliable measure of the proportion of common input to the population of motor neurons can be derived by fitting experimental data to the derived analytical model. This measure (i.e. the optimized parameters in the experimental fitting) provides an estimate of the proportion of common input to the motor neuron pool with respect to the total synaptic input. We apply this measurement method to three human muscles (of the hand, thigh and leg) that have known differences in force control seeking to investigate the functional role of common and independent input.
The present study aims to measure the proportion of low frequency shared input received by the motor neurons belonging to the same motor pool in humans and to compare this in muscles with different functional properties and accuracies in force control.
Methods
We first provide a theoretical derivation for the proposed index using a phenomenological model derived by the interpretation of previous experimental results (Negro et al. 2009; Negro & Farina, 2012; Farina et al. 2014; Castronovo et al. 2015). This analytical derivation is based on a simplified motor neuron behaviour (leaky integrate‐and‐fire; LIF) and will be validated in simulations based on a more complex motor neuron model to prove its generalization.
Theory
We consider a pool of N LIF motor neurons that receive stochastic input currents. Each motor neuron receives an input current that is a linear combination of common and independent Gaussian noises. The independent noise resembles the fluctuation of the membrane potential generated by the summation of synaptic inputs that are individual for each motor neuron (e.g. ion channel noise, uncoupled and unshared interneurons, etc.). On the other hand, the common synaptic input refers to the membrane fluctuations resulting from the summation of shared synaptic inputs received by the population of motor neurons (e.g. shared projections from cortical neurons or interneurons, activity from supopulations of neurons that are correlated in nature). This includes inputs that are projected across all motor neurons or different inputs that project on subpopulations of motor neurons but that are correlated. In this case and under the assumptions of linearity of the input–output relationship (linear response theory) of the motor neuron (Vilela & Lindner, 2009; Sharafi et al. 2013), the power spectrum of the output spike train of each motor neuron can be simplified as:
| (1) |
where S N(f) is the power spectrum of the output spike train when it is driven by independent synaptic input only, X(f) is the response function (susceptibility) of the motor neuron to the stimulus and S S(f) the power spectrum of the stimulus. In the present study, the stimulus is the common synaptic input received by all motor neurons. The linear response theory shown in eqn (1) is valid only for weak stationary synaptic input (variance of the common noise σ2 << μ2, where μ is the mean of the total synaptic current) and its accuracy increases for a large number of motor neurons (Negro & Farina, 2011 b), as considered in the present study. In the case of larger oscillations, non‐linear phenomena (e.g. rectification) may influence the results. In the present study, we assume that both the stimulus and the independent synaptic input (e.g. membrane noise) are coloured noise realizations with a given bandwidth. These currents represent the summation of all excitatory and inhibitory postsynaptic potentials received by the motor neurons, which are partly shared across the pool and partly individual for each motor neuron. Close analytical forms of the susceptibility functions exist for the LIF model, although they have a relatively complex formulation (Vilela & Lindner, 2009). With the purpose of obtaining an invertible formulation, we use approximations that will be validated in simulations.
If we consider the summation of n spike trains from n identical motor neurons that receive a common stimulus (shared synaptic input) and are driven by independent noise realizations, the power spectrum of the cumulative output spike train S Y(f) can be expressed as:
| (2) |
In eqn (2), we make use of unperturbed (not modulated by the input) spike trains being independent (their power spectra sum linearly with n), whereas the stimulus‐dependent parts of their power spectra sum as n2 because they are common to all motor neurons (Sharafi et al. 2013). Therefore, the effect of the common synaptic input increases when the number of motor neurons increases, as previously shown experimentally (Negro & Farina, 2012; Farina et al. 2014; Castronovo et al. 2015).
Using eqn (2), it is possible to derive the coherence function between the cumulative spike trains of two groups of n motor neurons, each in the same motor pool:
| (3) |
Under the above assumptions, we can parameterize eqn (3) as:
| (4) |
where is the mean of the coherence in the frequency band [f 1,f 2] selected for the analysis, and A and B (parameters) are the power of the common synaptic input (multipled by the absolute square of the susceptibility) and the response of the pool of motor neurons that receive only independent synaptic inputs in the same bandwidth, respectively. If the frequency range of interest is lower than the average discharge rates of the estimated motor neuron spike trains, the susceptibility is assumed to be constant in the bandwidth of interest (Vilela & Lindner, 2009). For higher frequencies, this assumption is not strictly valid and a certain amount of distortion should be expected. Therefore, we focus on the low frequency range (<5 Hz), which is also the range of frequencies of the neural drive to muscle that produces force (Farina et al. 2014). In this frequency range, we show with simulations that the approximation of a constant X(f) has a minimal effect on the final estimation for a large range of inputs.
Given the output population of spike trains, we are interested in the estimation of the square root of the ratio A/B, which we demonstrated in simulations (see below) to be a good approximation of the proportion of the common synaptic input with respect to the total synaptic input received by the motor neurons. The same result was derived theoretically using the formulations for X(f) and S N(f) that are available for the perfect integrate‐and‐fire model (results now shown). The ratio can be estimated by an experimental measure of the mean coherence in the frequency range [f1,f2] for varying n (number of motor neuron spike trains used in the calculation (Negro & Farina, 2012)) using eqn (4). This can be performed using standard nonlinear least‐square solvers. In the present study, for this purpose, we used the function ‘lsqcurvefit’ available in the optimization toolbox of MATLAB (MathWorks Inc., Natick, MA, USA).
Figure 1 describes the schematic assumption of common input to a population of motor neurons and the integral of the coherence function with n as independent variable. A pool of motor neurons receives common and independent synaptic inputs and their output spike trains show some degree of correlation that can be estimated with frequency domain techniques. However, the amount of coherence estimated by pairs of output spike trains is not representative of the original correlation in input because it depends on the discharge rates and variability in discharge of the selected units (Negro & Farina, 2012).
Figure 1. Representative scheme of the model used .
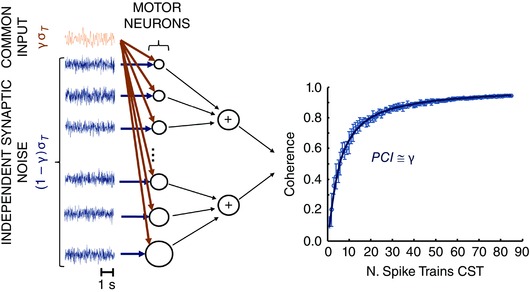
A pool of motor neurons receives common and independent synaptic input with SDs equal to γσT and (1 – γ)σT, respectively. σT refers to the SD of the total synaptic input. The output spike trains of the motor neurons are linearly summed to estimate the magnitude of the coherence in the frequency band <5 Hz (delta band) for different numbers of motor neurons. The average values of coherence are fitted using eqn (4) to estimate the proposed index common to independent ratio (PCI). In this example, the simulated value of γ was 0.5 and the estimated PCI value was 0.55. As discussed in the Results, the PCI index was shown to be a good estimation of the proportion of common synaptic input γ.
From eqn (4) it is possible to establish a fitting of experimental coherence (Fig. 1) data to estimate the square root of the ratio A/B. Using a least‐square curve fitting of the estimated values of coherence for different numbers of motor neuron spike trains (cumulative spike trains), the parameters A and B of eqn (4) can be estimated. The cumulative spike trains are constructed by summing two groups of n spike trains and applying the coherence function between them. The square root of the ratio A/B, which we refer to as the proportion of common input (PCI), is an estimate of the relative proportion of the common synaptic input with respect to the total synaptic input (excluding the mean value) and is an estimate of the variable γ (proportion of common membrane fluctuations) in the scheme of Fig. 1. Therefore, the mean injected current that drives the motor neuron pool is assumed to change the global probability of discharge only. The mean injected current is determined by the summation of all EPSP and IPSP events, common and independent but, in the present study, we consider only the fluctuations of those inputs, as we have done in all our previous studies (Negro & Farina, 2012; Farina et al. 2013; Farina et al. 2014; Dideriksen et al. 2015 b; Farina & Negro, 2015; Negro et al. 2015). Figure 1 represents the mathematical model assumed for the estimation of the proportion γ of common membrane fluctuations. The components of this model do not necessarily directly reflect anatomical pathways for the delivered inputs. The proposed regression assumes that the properties of the motor neurons in the pool are similar. However, the estimation provided by eqn (4) was shown to be robust also when the characteristics of the motor neurons were distributed across certain ranges (see simulation results).
With respect to previous correlation measures between output spike trains, the proposed PCI index is an absolute estimate of γ in Fig. 1 and has therefore an immediate physiological meaning. Conversely, output correlation indices, such as the common drive index (De Luca & Erim, 1994), the short‐term synchronization indices (Kirkwood & Sears, 1978; Nordstrom et al. 1992) or coherence measures between pairs of motor unit spike trains, are relative measures only indirectly associated with γ and can be used for comparing relative conditions only. The approach that we propose is therefore the only currently available to directly estimate the proportion of common and independent input to motor neurons in the frequency bandwidth of voluntary control and force generation (<5 Hz). As such, for the first time, this measure allows us to provide a quantification of these proportions in human muscles during voluntary contractions.
Both the modelling and the simulation approaches assume a shared input across the whole motor neuron population. The common synaptic input should originate from correlated synaptic activity. Therefore, the proposed assumption does not imply that, anatomically, the branched axons from cortical, subcortical and afferent pathways should innervate all motor neurons in the same pool. In the case of partial shared synaptic inputs, the proposed method would provide an average value of the proportion of the common synaptic input, comparable to the same scenario with full connectivity. In this sense, the measure PCI provides information on the average input across the motor neuron pool. Two motor neurons taken at random would not necessarily share the proportion of common input indicated by PCI because this is a population measure. However, when the pair of motor neurons is randomly changed, the proportion of common input that is measured on average over a large number of pairs would be predicted by the measure PCI. For example, if only half of the motor neurons receive shared input, the measure PCI would provide a value as average across motor neurons that do not share input and others that share a certain amount of input. In this example, PCI would underestimate the value of common input in the subpopulation that shares the input and overestimate it in the population that does not share common input, as is expected by a population measure.
Simulations
The theoretical derivation of the PCI index as estimated from non‐linear regression of coherence values assumes a LIF model for the motor neuron behaviour. We validated this expression in numerical simulations by representing motor neurons with a Hodgkin–Huxley type model. This approach shows that more complex motor neuron models (as used in simulation) provide results that deviate negligibly from the theoretical derivation obtained with the approximated model.
The simulations were based on a model of populations of motor neurons that received common and independent inputs. A similar modelling approach has been used in previous studies (Negro & Farina, 2011 a, 2012; Farina et al. 2013; Dideriksen et al. 2015 a).
The motor neuron model was based on that described by Cisi & Kohn (2008). It consists of two compartments, six conductances (with three voltage‐dependent conductances, Na, Kf and Ks) and four state variables. The pulse‐based simplification used in the original model was removed from the present study and a full formulation, proposed previously (Traub & Miles, 1991) was used instead. The motor neuron parameters were the same as used by Cisi & Kohn (2008) and selected according to an exponential distribution over the pool of motor neurons (Fuglevand et al. 1993).
The number of motor neurons was set to 300, similar to the histological findings in the abductor digiti minimi (ADM) muscle (Santo Neto et al. 1985), which is one of the muscles investigated in the experiments. The input to motor neurons included a linear summation of common and independent Gaussian noises. The common and independent noises had a bandwidth of 50 Hz. In most simulations, the amplitude of the synaptic input was chosen to obtain output spike trains with a coefficient of variation for the interspike interval (ISI) of ∼15% (Moritz et al. 2005). The mean currents were simulated between 5 and 15 nA. In all simulations, the variance of the common synaptic noise σ2 was selected substantially smaller than the square of the mean synaptic current.
The model was implemented in MATLAB. The system of differential equations for the motor neuron model was solved with the Adams–Bashforth–Moulton PECE solver (Shampine, 1975), using optimized time steps within intervals of 1 ms. Each simulation was 50 s long.
Experiments
Experiments were performed on the ADM, tibialis anterior (TA) and vastus medialis (VM) muscles at moderate force levels. These three muscles were selected because they are known to have different properties and functional roles. For example, the ADM, similar to other muscles in the hand, shows relatively poor steadiness in force compared to TA and VM (Tracy, 2007; Tracy et al. 2007). The maximal motor unit discharge rates in these muscles are also very different, with values for the ADM and TA that are almost double those for VM (Enoka & Fuglevand, 2001). Additionally, their levels of short‐term synchronization, as classically reported, are also different, with moderate to high levels for the ADM and TA and very low levels for the VM (Dideriksen et al. 2009; Keen et al. 2012; Negro & Farina, 2012).
We identified the spike trains of motor neurons (described below) in these three human muscles during voluntary contractions by processing electromyography (EMG) signals and estimated the coherence function between cumulative spike trains of groups of motor neurons. Subsequently, we used this information to fit the theoretical derivation reported in eqn (4). The experimental data used for this analysis are partly taken from two previous studies (Hedayatpour et al. 2007; Negro et al. 2009). The experimental procedures of those studies are reported briefly here for completeness.
Three separate groups of five healthy men (mean ± SD, age: 24 ± 2 years for the ADM, 28 ± 2 years for the TA, and 24 ± 1 years for VM muscle) participated in the experiments. The experiments were conducted in accordance with the Declaration of Helsinki and approved by the local ethics committee of Region North Jylland Denmark. All participants provided their written informed consent form before inclusion.
Single motor unit action potentials were recorded with i.m. electrodes in all muscles. i.m. EMG was conducted using two pairs of Teflon‐coated stainless steel wires (diameter 0.1 mm; A‐M Systems, Carlsborg, WA, USA) inserted via 25 gauge hypodermic needles (23 gauge for the VM experiment). The needles were inserted and removed after insertion, leaving the wires inside the muscle. Each wire was cut to expose the cross section of the tip. Bipolar i.m. EMG signals were amplified (Counterpoint EMG; Dantec Medical, Skovlunde, Denmark), bandpass filtered (500 Hz to 5 kHz) and sampled at 10 kHz (20 kHz for the VM experiment).
For all muscles, after inserting the wire electrodes, the subjects performed three maximal voluntary contractions (MVCs) with a rest of 2 min in between. The maximum force achieved during the maximal contractions was considered as the reference MVC.
For the ADM recordings, the subject was seated on an adjustable chair with the right arm extended in a force brace (Aalborg University, Aalborg, Denmark). The fifth finger was fixed in the isometric device for measurement of finger‐abduction forces. The forearm and the four digits were fixed with Velcro straps (Velcro Ltd, Middlewich, UK). The subject then sustained the target force level for 60 s. In the original study (Negro et al. 2009), the target force levels recorded for this muscle corresponded to 5%, 7.5% and 10% MVC. However, only those recordings corresponding to 10% MVC were used in the present analyses. The subject had feedback on force during all contractions. The force produced by the fifth finger was measured using two force transducers (Interface, Scottsdale, AZ, USA): one in the transverse plane and one in the sagittal plane. During each contraction, the force on the sagittal plane was monitored and contractions during which this force was not negligible were repeated. The force signals were sampled at 10 kHz and stored on a computer. Visual feedback of the abduction force was provided via an oscilloscope.
For the TA muscle, the subject was seated in an upright position, with the right leg fully extended and with the foot restraint in a force transducer (Aalborg University). The angle of the ankle was ∼20° with respect to the neutral position (0°). The leg was fastened to the isokinetic device by means of Velcro straps to avoid altering the position of the ankle throughout the task. In the original experiment, the subject performed three submaximal contractions at 10% MVC, 15% and 20% MVC with a duration of 60 s, in random order. For the TA muscle, only the 10% MVC was used for the present analyses.
For measurements from the VM muscle, the subject was seated on a chair with the right thigh flexed and fixed at 90 degrees. An ankle strap was attached with a chain to a load cell fixed on the wall. In the original experiment, the subject performed seven submaximal contractions between 2.5% and 30% MVC with a duration of 180 s. In the present study, we report the results only for the contractions at 10% MVC for 60 s.
Signal analysis
The action potentials of individual motor units were identified from the i.m. EMG signals by use of a decomposition algorithm (McGill et al. 2005). Given the recent improvements of this algorithm (EMGLAB), the data have been fully re‐analysed with respect to the original studies to reach the maximum degree of accuracy in decomposition. The spike trains of each motor unit were used to extract the average discharge rate and the ISI variability of the unit. Moreover, coherence analysis was performed between the cumulative spike trains of two equally sized groups of motor units using Welch's averaged periodogram method in 1 s non‐overlapping windows. All permutations of the detected units were used in the two groups, varying the number of motor units in each group from 1 to the maximum number (half of the number of detected units) (Fig. 1). The coherence function was calculated in the frequency range 1–5 Hz. This selection was chosen to focus on a frequency range of voluntary control that is preserved in the force output signal. The averaged value of the coherence (without respect to significance) in this bandwidth was computed for all unit permutations. The averaged values of coherence as a function of the number of motor units used for the calculation were fitted by least‐squares using eqn (4), by optimizing the parameters A and B. In this way, the PCI index, as previously defined, was computed as a direct estimate of γ (Fig. 1).
The values of the common drive index (CDI) were also calculated based on the procedures described previously (De Luca et al. 1982; De Luca & Erim, 2002). Moreover, the common input strength (CIS) (Nordstrom et al. 1992) was computed as described by Semmler et al. (1997). The common drive is related to the low frequency bandwidth of motor unit spike trains, whereas CIS represents the correlation in the full frequency bandwidth.
Statistical analysis
Data are reported as the mean ± SD. The coefficient of variation for the ISI was calculated as the SD divided by the mean value (%). The variability of the indices CIS and CDI across the motor neuron population was quantified by the respective coefficients of variation over the pairs chosen for their calculation. One‐way ANOVA was used to compare PCI, CIS and CDI between muscles. P < 0.05 was considered statistically significant. Linear regression analysis was used to assess the relationship between PCI, CDI and CIS and the simulated proportion of common input.
Results
Simulation and experimental results are described and interpreted using the predictions derived from the analytical derivations (see Methods).
Simulations
The estimation of the coherence between pairs of composite spike trains showed a tendency to increase faster for greater levels of input correlation (Fig. 2), as predicted theoretically. Figure 2 shows the estimated coherence for pairs of composite spike trains, as a function of the number of motor units, for low (Fig. 2 A) and high (Fig. 2 B) activation levels. In the low activation case (Fig. 2 A), the mean ± SD synaptic current was 8 ± 1.2 nA. Only neurons discharging at 8 pps or higher were selected. In this simulation, corresponding to the low activation level, the total number of motor neurons that fulfilled this criterion was 172. The graph shows the average coherence values for four levels of simulated common synaptic input (γ). The profiles of average coherence values were fitted with the mathematical expression in eqn (4) to provide an estimation of the proportion of the SD of the common synaptic input (excluding the mean value) relative to the total synaptic input (PCI). The error between the estimated γ and the simulated value depended on the strength of common input. It varied between 3% at 85% of simulated common synaptic input to 40% with only 10% of common synaptic input. In the high activation case, the mean ± SD synaptic current was 10 ± 1.5 nA and the total number of active motor neurons was 262. In this case, the percentage of error between the simulated value of γ and PCI was 0% (within the second decimal approximation) at 85%, 8% at 60%, 20% at 35%, and 50% at 10% of common synaptic input. These results show that the proposed technique provides a reliable estimation of the proportion of common synaptic input relative to the total synaptic input for moderate to high levels of common input (error γ ≥ 0.4). The experimental results show that the condition of high common input, and thus high accuracy in the estimation of its proportion, is satisfied.
Figure 2. Estimation of the simulated proportion of common synaptic input using the proposed index for different numbers of motor neuron spike trains .
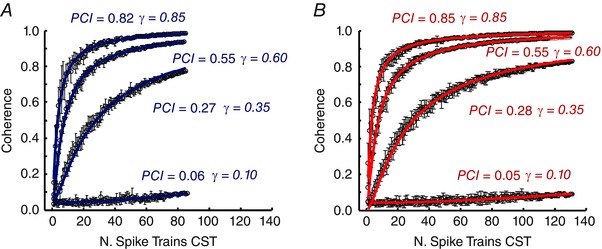
Profiles for four levels of simulated common synaptic inputs (γ): 10%, 35%, 60% and 85% and the corresponding estimated values (γ). The results are shown for two simulated conditions. A, low level of activation (mean synaptic current of 6 nA). B, high level of activation (mean synaptic current of 10 nA). The values of coherence are reported as the mean ± SD for each selection of number of spike trains in the composite spike train. The estimated values of PCI were a good approximation of the true simulated values γ for both cases.
The main limitation of pairwise output correlation measures is their dependency on the discharge rates of the motor neurons and their variability (de la Rocha et al. 2007; Negro & Farina, 2012). A reliable index of correlation should be able to provide a robust estimate, independent of the average discharge rate of the motor neuron pool. Figure 3 reports the values of PCI along with those of CDI and CIS for simulations where the average discharge rates of the motor neurons were varied. With a medium level of activation (Fig. 3 A), the average discharge rate of the pool of motor neurons was 11.6 pps (8.2–13.4 pps). In this scenario, the CDI was 0.40 and the CIS 0.50 pps. Under these conditions, the estimated value for γ (PCI) was 0.43, with an error of 14% with respect to the simulated true value of 0.5. Note that the proposed index PCI is a direct estimate of γ and can thus be directly interpreted as a proportion of common input, according to the definition of Fig. 1, whereas the indices CDI and CIS reflects statistical properties of the output spike trains and can be used only to determine relative differences in proportion of common input across conditions, within approximations, but not absolute estimates. When increasing the proportion of common synaptic input relative to the independent input (γ = 0.75), CDI changed only modestly (CDI = 0.46), showing a limited sensitivity to the changes in proportion of common input. Under these conditions, CIS increased to 1.72 pps, whereas PCI was 0.76 (Fig. 3 B). This corresponded to an error in the PCI value with respect to γ of ∼1% of the true value. When the level of activation of the motor neuron pool increased, the average discharge rate of the active motor neurons also increased to 29.2 pps (8.4–35.5 pps). This influenced the CIS index, which doubled from 0.50 pps, with low average rate, to 1.10 pps, with high rate, despite the same common input being simulated in the two conditions (with the same bandwidth). Conversely, the CDI and PCI indices were less sensitive to the change in discharge rates (Fig. 3 C). These representative simulations indicate that CIS is extremely sensitive to discharge rates (de la Rocha et al. 2007; Negro & Farina, 2012), whereas CDI is more robust to changes in discharge rate, but with a small sensitivity to changes in common input. Neither CDI, nor CIS provide an absolute estimate of common input, but only indirect relative changes. Conversely, PCI provided an accurate estimate of the absolute proportion of common input in all conditions with minimal sensitivity to discharge rate.
Figure 3. Influence of the average discharge rate of the motor neuron pool on the proposed index .
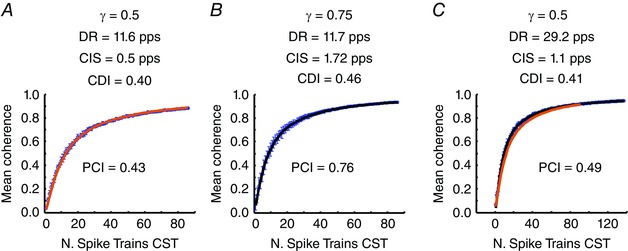
The three plots show the average magnitude of the coherence calculated between groups of motor neuron spike trains (mean ± SD). A, in this simulation, the motor neuron pool received a mean current of 5 nA and a proportion of common synaptic input γ equal to 0.5. The average discharge rate of the motor neurons was 11.6 pps (8.2–13.4 pps) and the coefficient of variation for the ISI (CoVISI) was 14.3%. The estimated average values of CIS and CDI were 0.5 pps and 0.40. The proposed index PCI provided an estimation of 0.43. B, same parameters as in A but with higher common synaptic input (γ = 0.75). In this case, the CIS index increased substantially (1.72 pps), whereas the CDI index showed a minimal variation (0.46). On the other hand, the proposed PCI index was equal to 0.76, which is similar to the simulated proportion of common synaptic input. C, same as in (A) (γ = 0.5) but the mean current was set to 15 nA. In this case, the average discharge rate of the motor neurons was greater (29.2 pps, 8.4–35.5 pps) but the CoVISI was similar to the previous case (14.8%). The CIS values showed a marked dependence on the average discharge rate of the motor neuron pool (CIS = 1.1 pps) but the CDI did not. The proposed PCI was similar to the simulated value (0.49). The regression provided by the example of Fig. 3 A is superimposed and shows good agreement.
The representative results shown in Fig. 3 were confirmed by a more extensive set of simulations. Figure 4 shows the relationship between the CDI and CIS indices and the simulated value of γ, for γ changing in the range 0.1–0.9. Two scenarios with different average discharge rate (mean synaptic currents of 6 and 10 nA) were simulated. The common synaptic input had a bandwidth of 50 Hz, as in the previous simulations. All indices were estimated using the motor neurons with average discharge rates of 8 pps. The average discharge rates were 14.0 and 21.4 pps for the low and high activation cases, respectively. In this way, we selected only the motor units fully recruited by the simulated synaptic input. Moreover, the indices were normalized with respect to their maximum values. This normalization, which is not possible experimentally, allowed comparison of CDI and CIS with PCI, despite the first two indices not reflecting the same physical quantity as PCI. Normalization was needed because only PCI is an absolute measure. Figure 4 A and B depicts the values of CDI normalized to its maximum as a function of the normalized simulated γ values for the low and high activation cases, respectively. The relationship was non‐linear. Conversely, the linear regression between the estimated values of shared input calculated using the PCI index and the simulated values was significant (P < 0.001) with a slope of ∼1, for both activation levels. Figure 4 C and D shows the behaviour of the normalized CIS value as a function of the normalized simulated γ values in the conditions that have been previously described. As for the CDI index, the CIS index did not increase linearly with the simulated proportion of common synaptic input. For example, under the condition of moderate activation level, a normalized proportion of common input between 10% and 40% can result in similar values of CIS and CDI. More specifically, when comparing two conditions with simulated values of the normalized proportion of common synaptic input of 22% and 44%, in a linear case, all parameters should vary by ∼22%. In our simulations, the CIS index varied by ∼9% and the CDI index by 6% (Fig. 4 A–C). Conversely, the estimated proportion of common synaptic input calculated using the proposed approach showed a variation of 21%, similar to the simulated one. Moreover, CDI and CIS showed a large variability (grey areas in Fig. 4 A–D) in the estimation across the different pairs of motor units used for the estimates, despite the simulations including common input distributed uniformly across all motor neurons. Conversely, the proposed index PCI was linearly associated with γ (Table 1).
Figure 4. Linearity of the proposed index .
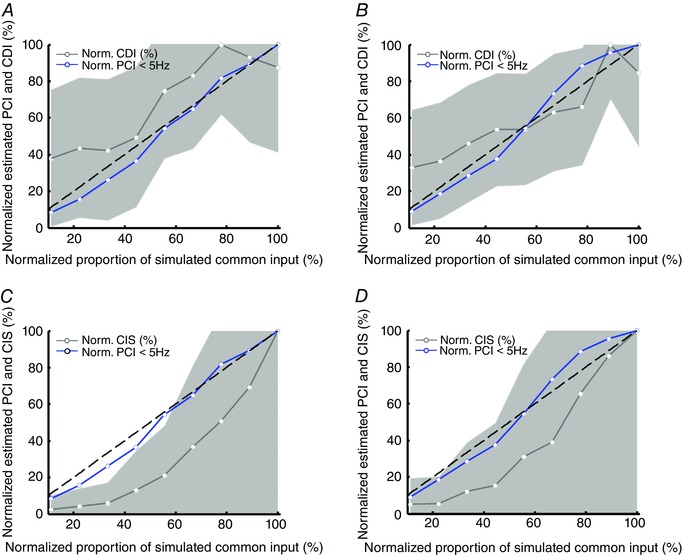
A and B, estimation of the CDI index for nine values of simulated proportion of common input between 10–90% and comparison with the proposed PCI index. The results are shown for two levels of activation: low (6 nA) (Fig. 4A) and high (10 nA) (Fig. 4B). C and D, same as in (A) and (B) for the CIS index. Grey areas show the SD of the estimates over the motor unit pairs for the CDI and CIS indices. Dashed lines show the theoretical regression with a slope of 1.
Table 1.
Regression parameters for the results reported in Fig. 4
| Figure | PCI vs. γ | CDI vs. γ | CIS vs. γ |
|---|---|---|---|
| 4A | y = 1.1* x – 7.5 (8.10) | y = 0.80* x + 27.0 (26.90) | |
| 4B | y = 1.1* x – 6.5 (13.04) | y = 0.67* x + 22.0 (22.04) | |
| 4C | y = 1.1* x – 7.5 (8.10) | y = 1.0* x – 24.0 (31.97) | |
| 4D | y = 1.1* x – 6.5 (13.04) | y = 1.1* x – 23.0 (28.78) |
The normalized regression error is given in parentheses.
The simulation results presented in Figs 3 and 4 indicate that the PCI measure is an accurate estimate of the absolute proportion of common input to the motor neuron pool, at least for relatively strong common inputs. Conversely, correlation measures of output correlation (e.g. CDI and CIS) do not provide a direct estimate and are also limited for relative comparisons because of a small sensitivity to changes in common input or dependency on motor neuron discharge rates.
Experiments
Across all subjects, the coefficients of variation of the generated force were 3.1 ± 1.0% (ADM), 1.8 ± 0.9% (TA) and 3.4 ± 1.3% (VM). The averaged (total) number of identified motor unit spike trains for a single trial was 9 ± 2 (45) for ADM, 13 ± 4 (51) for TA and 8 ± 2 (40) for VM. Motor unit discharge patters with obvious gaps or sharp changes in the estimated instantaneous discharge rates were excluded from the analysis. The average discharge rate was 12.1 ± 2.0 pps for ADM, 17.7 ± 8.9 pps for TA and 9.4 ± 1.9 pps for VM. The averaged coefficients of variation for the ISI were 18.4 ± 1.9% (ADM), 13.5 ± 1.4% (TA) and 12.7 ± 2.9% (VM).
Figure 5 shows a representative example of the analysis of motor unit spike trains. The smoothed discharge rates of the identified motor units are shown for each muscle (Fig. 5, upper). The average coherence profiles are shown for different numbers of spike trains used in the calculation (Fig. 5, middle). The average values of coherence in the bandwidth < 5 Hz are reported as a function of the number of motor unit spike trains used in the calculation (Fig. 5, lower), as in Fig. 1. The PCI values were 0.73, 0.83 and 0.80, respectively. For these results, the normalized errors in the fitting of the experimental data with eqn (4) were negligible: 0.1% (ADM), 0.3% (TA) and 0.2% (VM). The averaged fitting errors across all subjects were 0.2 ± 0.3% (ADM), 0.9 ± 0.7% (TA) and 8.7 ± 13.3% (VM). The values of CDI and CIS for the examples in Fig. 5 were, respectively, 0.34 and 0.98 pps (ADM), 0.55 and 0.54 pps (TA), and 0.47 and 0.16 pps (VM). The averaged values of CDI across all subjects were 0.38 ± 0.08 (ADM), 0.52 ± 0.10 (TA) and 0.42 ± 0.18 (VM). The averaged values of CIS across all subjects were 1.19 ± 0.50 (ADM), 1.15 ± 0.62 (TA) and 0.20 ± 0.07 pps (VM). The average values of PCI were 0.75 ± 0.12 (ADM), 0.82 ± 0.17 (TA) and 0.63 ± 0.20 (VM)
Figure 5. Example of analysis on experimentally recorded motor neuron spike trains on three muscles (ADM, TA and VM) .
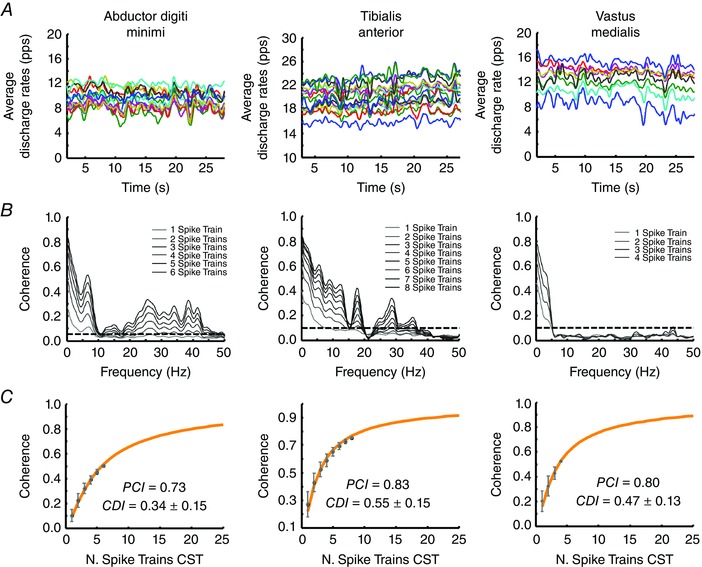
A, average discharge rates of the identified motor units. B, coherence analysis between CST of different numbers of motor unit spike trains. Each estimation is the average of 100 random combinations of the original spike trains. C, mean ± SD of the estimates as a function of the number of motor unit spike trains used in the calculation. The values refer to the average coherence in the delta band (<5 Hz). For comparison, the average CDI values are also reported. CST, cumulative or composite spike train.
The average coefficients of variation of the CDI index within subjects across the motor unit pairs were 30.6 ± 13.4% (ADM), 29.2 ± 10.4% (TA) and 35.2 ± 16.9% (VM). For the CIS index, the variability among motor unit pairs was 31.6 ± 13.7% (ADM), 62.0 ± 19.6% (TA) and 57.0 ± 24.0% (VM). When averaging across all pairs of motor units within each subject, the variability among subjects for CDI was 20.6% (ADM), 20.8% (TA) and 42.7% (VM) and, for CIS, it was 41.6% (ADM), 53.9% (TA) and 35.9% (VM). The coefficient of variation for PCI calculated across subjects was 16.0% (ADM), 20.7% (TA) and 31.7% (VM). The larger variability found in the VM muscle was probably a result of the lower number of motor units identified in this muscle.
The averaged values of PCI, CDI and CIS for the three muscles are shown in Fig. 6. Interestingly, the estimated proportion of common input was greater than 60% for the three muscles, and therefore constituted the majority of the input to the pool of motor neurons with respect to independent noise. PCI and CDI did not show a statistical difference across the muscles investigated (Fig. 6 A). Moreover, PCI and CDI were positively associated (r 2 = 0.52, P < 0.05) (Fig. 6 B). However, this association also showed a relatively high level of variability. For example, a PCI value of 0.8 could correspond to values of CDI in the range 0.30–0.55 (Fig. 6 B). CIS was significantly smaller for the VM muscle with respect to ADM and TA. This difference was determined by the observed absence of coherence for the VM muscle in the frequency range >5 Hz for all subjects (Fig. 5).
Figure 6. Averaged experimental results across all subjects .
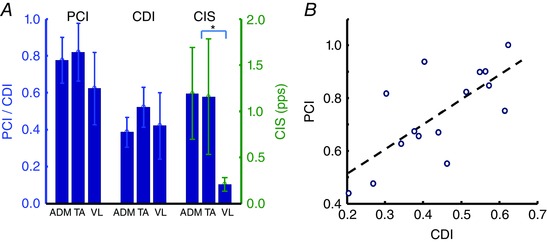
A, average values across all subjects of the proposed PCI index, the CDI index and the CIS index are shown for the three investigated muscles. B, correlation between the CDI and the PCI values (r 2 = 0.67, P < 0.05). *Statistically significant difference (P < 0.05).
To check for negative controls, we have also performed the calculation of the PCI index using several random sets (n = 100) of spike trains extracted from the recordings available (TA and ADM muscles, one spike train per recording). This procedure assured a fair control situation with completely uncorrelated spike trains. Under these conditions, the averaged estimation of the proportion of the common input was 5 ± 3%. A lower limit different from zero is expected because the coherence calculations are performed over signals with finite duration. Moreover, eqn (3) assumes the presence of a stimulus (common input); therefore, some indeterminacy is present in the case of fully uncorrelated spike trains.
Discussion
Our knowledge about the correlation between inputs to motor neurons derives almost entirely from analyses on pairs of motor unit spike trains (Farmer et al. 1997). These analyses have limitations and are not direct measures. In the present study, we provide a direct measure of the absolute proportion of common synaptic input received by a motor pool and report these estimates in three human muscles. The estimation is derived from a phenomenological model of motor neuron activity based on the observation that the summation of multiple spike trains recorded during voluntary contractions can reproduce the synaptic control signal (stimulus) better with an increasing number of spike trains (Negro et al. 2009; Negro & Farina, 2012; Farina et al. 2014; Farina & Negro, 2015). For the three muscles investigated, the estimated common input was the majority of the input to the respective motor neuron pools. Moreover, its proportion was similar across the three muscles studied.
The proposed measure is based on a theoretical derivation obtained for the LIF motor neuron model, which was derived using previous analytical results (Vilela & Lindner, 2009; Sharafi et al. 2013). Simulations performed with a more realistic motor neuron model were well in agreement with the theoretical derivation. The proposed technique was able to accurately estimate the proportion of common synaptic input simulated in a motor neuron pool in the low frequency band (<5 Hz). Because this bandwidth is the most important for voluntary control and force generation (Farina et al. 2014; Farina & Negro, 2015), the characterization of the common synaptic input received by motor neuron pools in this bandwidth provides an insight into the neural mechanisms of human muscle control.
An important aspect of the present study is that it re‐examines the use of correlation indices classically used to infer connectivity and commonality for the motor neuron pool. These measures are known to be quite variable across motor neuron pairs (de la Rocha et al. 2007; Negro & Farina, 2012). Indeed, pairs of motor neuron spike trains may show occasionally null or negative values of correlation (De Luca & Kline, 2014) as a result of the non‐linearity of motor neurons (Negro & Farina, 2012).
The theoretical derivation reported in eqn (3) (Sharafi et al. 2013) was validated extensively in simulation and experiments and proved to be a robust description of the coherence profiles calculated as a function of the number of spike trains in composite spike trains (Figs 2 and 3). The equation assumes a shared stimulus/synaptic input across the motor neuron pool but does not describe any specific connectivity to the motor neuron pool. Apart from the presence of some shared synaptic input, it defines only its average distribution. The derived measure (PCI) is therefore essentially a population measure that characterizes the pool on average and not the specific connectivity of individual neurons. Because the method used is a robust regression based on minimization of the mean square error, the error in the estimate of the parameters was relatively low in most cases (Fig. 2), even when only a small number of spike trains was available (Fig. 2 A). This is an important feature of the proposed method because the number of motor units that can be identified experimentally may be limited. Additionally, in contrast to CIS, the estimated proportion of common synaptic input derived by the coherence profiles was not significantly influenced by substantial changes in the average discharge rate of the motor neuron pool (Fig. 3). Because the proposed approach is an estimation of the proportion of common synaptic input, it was found to be linearly correlated to the true value of this variable (Fig. 4), in contrast to indices based on the correlation between pairs of spike trains (output).
The experimental results confirmed the features of the proposed approach that were revealed by the simulations. The experimental coherence profiles followed a similar dependence with the number of motor unit spike trains used in the cumulative or composite spike train (CST) (Fig. 5), as described in the theoretical and simulation results. The estimation of the proportion of common synaptic input on the data recorded on the ADM, TA and VM muscles in five subjects showed that the amount of common synaptic projections in the low frequency band is relatively large, ranging between 60% and 80% (Figs 5 and 6 A) but not statistically different among the muscles studied.
Interestingly, in the higher frequency bands, substantial differences were evident between the VM and the other two muscles investigated. In particular, the VM muscle did not show any significant coherence for frequencies >6 Hz. The origin of this substantial difference is not clear, although it probably originates from the combined differences in the descending commands and the peripheral muscular factors of these muscles. For example, VM is known to share most of its shared synaptic inputs with the vastus lateralis muscle (Laine et al. 2015), a phenomenon that may be partly explained by the specific organization of the crossed spindle afferent projections of the muscles. Additionally, it is worth noting that ADM and TA are more distal muscles compared to the VM. Because the afferent loop is known to play an important role in the generation of common oscillations in the motor neuron pools (Christakos et al. 2006), this may be an additional explanation to the lack of higher frequency components in the neural drive to VM.
The results show that human motor neurons receive the majority of their input as common (>60% of the input), at least in the functional frequency bandwidth. This is shown to be a reliable quantification of this proportion in humans. Previous studies have demonstrated that motor unit average discharge rates show in‐phase common modulations during sustained contractions in several muscles (De Luca et al. 1982; De Luca & Erim, 1994, 2002). Therefore, our results confirm these observations and provide a correct quantification of the phenomenon. The exact source of this relatively large proportion of shared input is unknown, although it may probably be found in the synaptic contributions of cortical and subcortical areas to motor neuron pools (Lawrence et al. 1985) and the shared synaptic inputs originated from muscle receptors (Ishizuka et al. 1979). Interestingly, the three muscles investigated (ADM, TA and VM) showed a similar proportion of common synaptic input in the delta band, even though they have very different functional roles. This contrasts with the hypothesis of a functional significance of synchronization and its variability across muscles. In particular, the strength of short‐term synchronization has been related to the shared synaptic input arising directly from corticomotoneural neurons (Porter & Lemon, 1993). The corticospinal projections are known to supply distal muscles in larger amounts compared to more proximal muscles. This phenomenon is considered to be related to the dexterity of primates and humans (Lemon, 2008) and to have an influence on the steadiness of the force output. Nonetheless, the results of the present study show that muscles with different steadiness, ISI variability and functional needs receive similar amounts of common inputs in the effective neural drive bandwidth.
The application of the proposed approach indicates that, despite having different variability in ISI and accuracy in force tracking, the three muscles receive similar, relatively large, proportions of common input. These observations have important implications. First, the proportion of common input needed to observe a small correlation between pairs of motor unit spike trains is very large. For example, pairs of motor unit spike trains would have a correlation in output (coherence values for frequencies <5 Hz) smaller than 0.2 even with a proportion of common input of 80% (Fig. 2). This is in agreement with the relative difficulty in inducing output correlation between motor neurons in in vitro studies (Türker & Powers, 2001). The reason for this decorrelation in output is the non‐linear nature of the motor neurons (Negro & Farina, 2011 a, 2012). The results of the present study indicate that the actual common input to motor neuron pools is the majority of the synaptic input that the pool receives, with respect to independent input. Second, the common input was similar between muscles showing a different accuracy in force control. The steadiness of force in our experiments was greater for the ADM and VM with respect to the TA. However, the estimated proportions of common input were similar for the three muscles. Therefore, there was no association between the actual proportion of common input and the accuracy in force control. This observation may underlie a similar relative level of independent synaptic input across different muscles. This noise is filtered out by the averaging process intrinsic in the determination of the neural drive to muscles (Farina et al. 2014). The relatively high level of common input implies that a small number of motor neurons is needed for full filtering of the independent synaptic input in the neural drive to the muscles. The combination between the proportion of common synaptic input and the number of active motor neurons probably provides an output minimally influenced by the level of independent synaptic input. Therefore, the results of the present study also indicate that the type of noise that determines accuracy in force control is not the independent one, but rather is the common one, because it remains after the averaging process generated at the muscular level (Farina et al. 2014; Farina & Negro, 2015).
In conclusion, in the present study, we provide for the first time a quantification of the proportion of common input to motor neuron pools with respect to total synaptic input. We show that, despite a relatively small correlation in output spike trains of pairs of motor units, the proportion of common input is very large (>60% of the input). This large proportion implies a fast averaging of independent synaptic input when the force increases such that the independent synaptic input does not influence the accuracy of the generated force. We also show that muscles with different functional properties and with different abilities to produce an accurate force have similar levels of common input, which implies that different motor pools essentially receive a total input with similar proportions of correlated activity.
Additional information
Competing interests
The authors declare that they have no competing interests.
Author contributions
F.N. and D.F. have contributed to the conception and design of the study, interpretation of data, and drafting of the article. F.N. and U.Ş.Y. have contributed to the analysis of the data. All authors have approved the final version of the manuscript for publication. All authors have read and approved the final submission. All authors agree to be accountable for all aspects of the work, ensuring that questions related to the accuracy or integrity of any part are appropriately investigated and resolved. All persons designated as authors qualify for authorship, and all those who qualify for authorship are listed.
Funding
Financial support was provided by the European Research Council Advanced Grant DEMOVE (contract #267888) (DF).
References
- Averbeck BB, Latham PE & Pouget A (2006). Neural correlations, population coding and computation. Nat Rev Neurosci 7, 358–366. [DOI] [PubMed] [Google Scholar]
- Castronovo AM, Negro F, Conforto S & Farina D (2015). The proportion of common synaptic input to motor neurons increases with an increase in net excitatory input. J Appl Physiol 119, 1337–1346. [DOI] [PubMed] [Google Scholar]
- Christakos CN, Papadimitriou NA & Erimaki S (2006). Parallel neuronal mechanisms underlying physiological force tremor in steady muscle contractions of humans. J Neurophysiol 95, 53–66. [DOI] [PubMed] [Google Scholar]
- Cisi RRL & Kohn AF (2008). Simulation system of spinal cord motor nuclei and associated nerves and muscles, in a web‐based architecture. J Comput Neurosci 25, 520–542. [DOI] [PubMed] [Google Scholar]
- de la Rocha J, Doiron B, Shea‐Brown E, Josić K & Reyes A (2007). Correlation between neural spike trains increases with firing rate. Nature 448, 802–806. [DOI] [PubMed] [Google Scholar]
- De Luca CJ & Erim Z (1994). Common drive of motor units in regulation of muscle force. Trends Neurosci 17, 299–305. [DOI] [PubMed] [Google Scholar]
- De Luca CJ & Erim Z (2002). Common drive in motor units of a synergistic muscle pair. J Neurophysiol 87, 2200–2204. [DOI] [PubMed] [Google Scholar]
- De Luca CJ & Kline JC (2014). Statistically rigorous calculations do not support common input and long‐term synchronization of motor‐unit firings. J Neurophysiol 112, 2729–2744. [DOI] [PMC free article] [PubMed] [Google Scholar]
- De Luca CJ, LeFever RS, McCue MP & Xenakis AP (1982). Control scheme governing concurrently active human motor units during voluntary contractions. J Physiol (Lond) 329, 129–142. [DOI] [PMC free article] [PubMed] [Google Scholar]
- De Luca CJ, Roy AM & Erim Z (1993). Synchronization of motor‐unit firings in several human muscles. J Neurophysiol 70, 2010–2023. [DOI] [PubMed] [Google Scholar]
- Dideriksen JL, Falla D, Baekgaard M, Mogensen ML, Steimle KL & Farina D (2009). Comparison between the degree of motor unit short‐term synchronization and recurrence quantification analysis of the surface EMG in two human muscles. Clin Neurophysiol 120, 2086–2092. [DOI] [PubMed] [Google Scholar]
- Dideriksen JL, Muceli S, Dosen S, Laine CM & Farina D (2015. a). Physiological recruitment of motor units by high‐frequency electrical stimulation of afferent pathways. J Appl Physiol 118, 365–376. [DOI] [PubMed] [Google Scholar]
- Dideriksen JL, Negro F & Farina D (2015. b). The optimal neural strategy for a stable motor task requires a compromise between level of muscle cocontraction and synaptic gain of afferent feedback. J Neurophysiol 114, 1895–1911. [DOI] [PMC free article] [PubMed] [Google Scholar]
- Enoka RM & Fuglevand AJ (2001). Motor unit physiology: some unresolved issues. Muscle Nerve 24, 4–17. [DOI] [PubMed] [Google Scholar]
- Farina D & Negro F (2015). Common synaptic input to motor neurons, motor unit synchronization, and force control. Exerc Sport Sci Rev 43, 23–33. [DOI] [PubMed] [Google Scholar]
- Farina D, Negro F & Dideriksen JL (2014). The effective neural drive to muscles is the common synaptic input to motor neurons. J Physiol (Lond) 592, 3427–3441. [DOI] [PMC free article] [PubMed] [Google Scholar]
- Farina D, Negro F & Jiang N (2013). Identification of common synaptic inputs to motor neurons from the rectified electromyogram. J Physiol (Lond) 591, 2403–2418. [DOI] [PMC free article] [PubMed] [Google Scholar]
- Farmer S, Halliday D, Conway B, Stephens J & Rosenberg J (1997). A review of recent applications of cross‐correlation methodologies to human motor unit recording. J Neurosci Methods 74, 175–187. [DOI] [PubMed] [Google Scholar]
- Fuglevand aJ, Winter Da & Patla aE (1993). Models of recruitment and rate coding organization in motor‐unit pools. J Neurophysiol 70, 2470–2488. [DOI] [PubMed] [Google Scholar]
- Heckman C & Enoka RM (2004). Physiology of the motor neuron and the motor unit. Handbook Clin Neurophysiol 4, 119–147. [Google Scholar]
- Heckman C & Enoka RM (2012). Motor unit. Compr Physiol 2, 2629–2682. [DOI] [PubMed] [Google Scholar]
- Hedayatpour N, Arendt‐Nielsen L & Farina D (2007). Motor unit conduction velocity during sustained contraction of the vastus medialis muscle. Exp Brain Res 180, 509–516. [DOI] [PubMed] [Google Scholar]
- Ishizuka N, Mannen H, Hongo T & Sasaki S (1979). Trajectory of group Ia afferent fibres stained with horseradish peroxidase in the lumbosacral spinal cord of the cat: three dimensional reconstructions from serial sections. J Comp Physiol 186, 189–211. [DOI] [PubMed] [Google Scholar]
- Keen DA, Chou L‐W, Nordstrom MA & Fuglevand AJ (2012). Short‐term synchrony in diverse motor nuclei presumed to receive different extents of direct cortical input. J Neurophysiol 108, 3264–3275. [DOI] [PMC free article] [PubMed] [Google Scholar]
- Kirkwood PA (1979). On the use and interpretation of cross‐correlations measurements in the mammalian central nervous system. J Neurosci Methods 1, 107–132. [DOI] [PubMed] [Google Scholar]
- Kirkwood PA & Sears TA (1978). The synaptic connexions to intercostal motoneurones as revealed by the average common excitation potential. J Physiol (Lond) 275, 103–134. [DOI] [PMC free article] [PubMed] [Google Scholar]
- Laine CM, Martinez‐Valdes E, Falla D, Mayer F & Farina D (2015). Motor neuron pools of synergistic thigh muscles share most of their synaptic input. J Neurosci 35, 12207–12216. [DOI] [PMC free article] [PubMed] [Google Scholar]
- Lawrence DG, Porter R & Redman SJ (1985). Corticomotoneuronal synapses in the monkey: light microscopic localization upon motoneurons of intrinsic muscles of the hand. J Comp Physiol 232, 499–510. [DOI] [PubMed] [Google Scholar]
- Lemon RN (2008). Descending pathways in motor control. Annu Rev Neurosci 31, 195–218. [DOI] [PubMed] [Google Scholar]
- McGill KC, Lateva ZC & Marateb HR (2005). EMGLAB: an interactive EMG decomposition program. J Neurosci Methods 149, 121–133. [DOI] [PubMed] [Google Scholar]
- Moritz CT, Barry BK, Pascoe MA & Enoka RM (2005). Discharge rate variability influences the variation in force fluctuations across the working range of a hand muscle. J Neurophysiol 93, 2449–2459. [DOI] [PubMed] [Google Scholar]
- Negro F & Farina D (2011. a). Decorrelation of cortical inputs and motoneuron output. J Neurophysiol 106, 2688–2697. [DOI] [PubMed] [Google Scholar]
- Negro F & Farina D (2011. b). Linear transmission of cortical oscillations to the neural drive to muscles is mediated by common projections to populations of motoneurons in humans. J Physiol (Lond) 589, 629–637. [DOI] [PMC free article] [PubMed] [Google Scholar]
- Negro F & Farina D (2012). Factors influencing the estimates of correlation between motor unit activities in humans. PloS ONE 7, e44894. [DOI] [PMC free article] [PubMed] [Google Scholar]
- Negro F, Holobar A & Farina D (2009). Fluctuations in isometric muscle force can be described by one linear projection of low‐frequency components of motor unit discharge rates. J Physiol (Lond) 587, 5925–5938. [DOI] [PMC free article] [PubMed] [Google Scholar]
- Negro F, Keenan K & Farina D (2015). Power spectrum of the rectified EMG: when and why is rectification beneficial for identifying neural connectivity? J Neural Eng 12, 036008. [DOI] [PubMed] [Google Scholar]
- Nordstrom MA, Fuglevand AJ & Enoka RM (1992). Estimating the strength of common input to human motoneurons from the cross‐correlogram. J Physiol (Lond) 453, 547–574. [DOI] [PMC free article] [PubMed] [Google Scholar]
- Nordstrom MA & Miles TS (1990). Fatigue of single motor units in human masseter. J Appl Physiol 68, 26–34. [DOI] [PubMed] [Google Scholar]
- Nordstrom MA, Miles TS & Veale JL (1989). Effect of motor unit firing pattern on twitches obtained by spike‐triggered averaging. Muscle Nerve 12, 556–567. [DOI] [PubMed] [Google Scholar]
- Porter R & Lemon R (1993). Corticospinal function and voluntary movement. Oxford University Press, Oxford. [Google Scholar]
- Santo Neto H, de Carvalho VC & Penteado CV (1985). Motor units of the human abductor digiti minimi. Ital J Anat Embryol 90, 47–51. [PubMed] [Google Scholar]
- Schmied A & Descarreaux M (2010). Influence of contraction strength on single motor unit synchronous activity. Clin Neurophysiol 121, 1624–1632. [DOI] [PubMed] [Google Scholar]
- Semmler JG (2002). Motor unit synchronization and neuromuscular performance. Exerc Sport Sci Rev 30, 8–14. [DOI] [PubMed] [Google Scholar]
- Semmler JG, Nordstrom MA & Wallace CJ (1997). Relationship between motor unit short‐term synchronization and common drive in human first dorsal interosseous muscle. Brain Res 767, 314–320. [DOI] [PubMed] [Google Scholar]
- Semmler JG, Sale MV, Meyer FG & Nordstrom MA (2004). Motor‐unit coherence and its relation with synchrony are influenced by training. J Neurophysiol 92, 3320–3331. [DOI] [PubMed] [Google Scholar]
- Shampine L (1975). Computer solution of ordinary differential equations: the initial value problem. WH Freeman, San Francisco, CA. [Google Scholar]
- Sharafi N, Benda J & Lindner B (2013). Information filtering by synchronous spikes in a neural population. J Comput Neurosci 34, 285–301. [DOI] [PMC free article] [PubMed] [Google Scholar]
- Taylor AM & Enoka RM (2004). Optimization of input patterns and neuronal properties to evoke motor neuron synchronization. J Comput Neurosci 16, 139–157. [DOI] [PubMed] [Google Scholar]
- Tchumatchenko T, Geisel T, Volgushev M & Wolf F (2010). Signatures of synchrony in pairwise count correlations. Front Comput Neurosci 4, 1. [DOI] [PMC free article] [PubMed] [Google Scholar]
- Tchumatchenko T, Geisel T, Volgushev M & Wolf F (2011). Spike correlations – what can they tell about synchrony? Front Neurosci Methods 5, 68. [DOI] [PMC free article] [PubMed] [Google Scholar]
- Tracy BL (2007). Force control is impaired in the ankle plantarflexors of elderly adults. Eur J Appl Physiol 101, 629–636. [DOI] [PubMed] [Google Scholar]
- Tracy BL, Mehoudar PD & Ortega JD (2007). The amplitude of force variability is correlated in the knee extensor and elbow flexor muscles. Exp Brain Res 176, 448–464. [DOI] [PubMed] [Google Scholar]
- Traub RD & Miles R (1991). Neuronal Networks of the Hippocampus, Volume 777 Cambridge University Press, Cambridge. [Google Scholar]
- Türker KS & Powers RK (2001). Effects of common excitatory and inhibitory inputs on motoneuron synchronization. J Neurophysiol 86, 2807–2822. [DOI] [PubMed] [Google Scholar]
- Vaughan CW & Kirkwood PA (1997). Evidence from motoneurone synchronization for disynaptic pathways in the control of inspiratory motoneurones in the cat. J Physiol (Lond) 503, 673–689. [DOI] [PMC free article] [PubMed] [Google Scholar]
- Vilela RD & Lindner B (2009). Comparative study of different integrate‐and‐fire neurons: spontaneous activity, dynamical response, and stimulus‐induced correlation. Physical Review E 80, 031909. [DOI] [PubMed] [Google Scholar]