

Abstract
Underglycosylated mucin 1 antigen (uMUC1) is a proven biomarker of cancer progression relevant to many malignancies including pancreatic ductal adenocarcinoma (PDAC). However, while ample evidence exists of the expression of total MUC1, little is known about the abundance of the underglycolsylated form of the antigen and its significance in disease progression. Such knowledge is important because the underglycosylated form of MUC1 is intimately linked to metastatic potential. Here, we investigated the expression uMUC1 at various stages of PDAC including pancreatic intraepithelial neoplasia (PanIN). Immunohistochemical analysis was performed on human tissue microarrays (TMAs) containing PDAC and PanIN using monoclonal antibody specific to uMUC1. uMUC1 expression was analyzed by a traditional pathological scoring system and using automatic imaging analysis software. Our results demonstrated low uMUC1 abundance in PanIN lesions and a transient increase in antigen availability in stage I PDAC, followed by decreased expression in later stages of the disease. An additional finding was that there was intermediate expression of uMUC1 in adjacent normal tissues from PDAC irrespective of the stage. These studies suggest the intriguing possibility that a pro-metastatic uMUC1 expression signature may appear at early stages of PDAC, providing an additional clue about the aggressive nature of pancreatic cancer.
Keywords: Pancreatic cancer, underglycosylated mucin 1, tumor antigen, immunohistochemistry
Introduction
Pancreatic cancer accounts for only 3% of all cancer cases in the US. However, it has the worse mortality rate within the 5 years after diagnosis (98%, http://www.cancer.org/cancer/pancreaticcancer/detailedguide/pancreatic-cancer-key-statistics [1]). More than 95% of pancreatic cancers represent exocrine tumors and most of them are pancreatic ductal adenocarcinoma in situ (PDAC) [1]. Currently, surgical resection is the only curative intervention for patients with PDAC. With the low detection rate of resectable lesions at the time of diagnosis (10-20%, [2]), about 45,000 newly diagnosed cases in 2014 resulted in about 40,000 of associated deaths [1]. This is mainly due to the lack of methods for early diagnosis and effective therapeutic intervention for this disease.
In addition to the highly metastatatic nature of pancreatic cancer, it is also highly resistant to chemo- and radiotherapies [3,4]. As a result, the 5 year survival rate of pancreatic cancer patients of all stages is poor (Stage IA-14%; Stage IB-12%; Stage IIA-7%; Stage IIB-5%; Stage III-3%; Stage IV-1% [1]. Therefore, the unmet clinical need is the development of diagnostic and therapeutic tools specifically targeted to the early stages of the disease.
It is known and widely accepted that the type I transmembrance glycoprotein, mucin 1 (MUC1; CD227) is overexpressed in multiple epithelial adenocarcinomas such as breast [5-7], colon [8,9], ovarian [10,12], and pancreatic [13]. Further, studies revealed that MUC1 plays an important role in the invasiveness [14] and drug resistance [15] of pancreatic cancer. Importantly, under normal conditions, MUC1 is heavily glycosylated and expressed on the apical surface of glandular epithelial cells. In tumor cells, MUC1 is aberrantly underglycosylated (uMUC1: underglycosylated MUC1) due to a lack of a core 1,3-galactosyl-transferase (T-synthase) [16]. This modification of the antigen reveals epitopes associated with the core protein which in the normal cells are masked by oligosaccharides, making it possible to design probes with discriminating capacity between normal cells and adenocarcinoma cells [17,19]. Based on these facts, MUC1 was given a second place among 75 tumor-associated antigens prioritized by the NCI Translational Research Work Group as a target antigen [20]. Clearly, MUC1 represents an ideal target for developing therapeutic and diagnostic methods [21,22]. Therefore, in our search for an early biomarker for pancreatic cancer, we focused on the underglycosylated mucin 1 (uMUC1) tumor antigen.
We have previously extensively investigated the utility of uMUC1 as a biomarker for breast cancer progression using histological [5] and imaging [22,25] methods. In clinical specimens derived from patients with breast adenocarcinoma, we found that uMUC1 was translocated from apical surface to cytoplasmic space during disease progression from the early to late stages. In addition, uMUC1 levels were elevated not only in cancer tissue but also in the normal adjacent tissues that were classified as “cancer free” on the pathology report [5]. We believed that aberrant uMUC1 expression in adjacent tissues might be crucial to tumor recurrence after resection.
While expression of various mucin core proteins and associated O-linked glycans has been studied in primary tumors and metastasis [26], the data on uMUC1 expression in PDAC is lacking. At this stage the tumor is still confined to the top layers of pancreatic ductal cells and has not invaded deeper tissues or spread outside of the pancreas. Unfortunately, very few pancreatic tumors are found at this stage. Our previous studies attempted to detect pancreatic adenocarcinoma in animal models using in vivo imaging with uMUC1-targeted contrast agents [27]. Recently, we demonstrated that uMUC1-targeted imaging could inform therapy by predicting tumor response in a transgenic pancreatic cancer mouse model [28]. However, the ability to detect tumors early and furthermore to predict tumor response to therapy heavily depends on our knowledge of the targeted antigen expression.
In the present study, we aimed to investigate the expression profiles of uMUC1 at various stages of PDAC including pancreatic intraepithelial neoplasia (PanIN) as well as in the adjacent tissues. Immunohistochemical analysis was performed on human tissue microarrays (TMAs) containing PDAC and PanIN using monoclonal antibody specific to uMUC1. The uMUC1 expression profiles were analyzed by traditional pathological scoring system and using automatic imaging analysis software. Our results demonstrated low uMUC1 abundance in PanIN lesions and a transient increase in antigen availability in stage I PDAC, followed by decreased expression in later stages of the disease. Noteworthy, there was intermediate expression of uMUC1 in adjacent normal tissues from PDAC irrespective of the stage.
Materials and methods
Tissue microarray (TMA) construction
Tissue microarrays (TMAs) constructed of human pancreatic epithelial tissues were obtained from US Biomax, Inc. (Rockville, MD). Each contained 5 μm-thick slices of formalin-fixed paraffin-embedded samples representing various stages of pancreatic intraepithelial neoplasia (PanIN), pancreas ductal adenocarcinomas (PDAC), and adjacent tissues. Three types of normal adjacent tissues (NATs) included normal adjacent tissue, chronic pancreatitis, and acute pancreatitis as determined by pathologist.
Immunohistochemical (IHC) staining for human uMUC1
For better adhesion of the tissue sections on TMAs to the charged glass slides, samples were heated to 60°C for 15 min. Before proceeding to the staining, the slides were deparaffinized in xylene and then rehydrated in the sequence of ethanol solutions (100%, 95%, 75%, and 50%) followed by distilled water. To unmask the antigen, the samples were incubated in citrate buffer (10 mM sodium citrate, pH. 6.0, Sigma-Aldrich, St. Louis, MO) at 100°C for 5 min and cooled down to room temperature. To reduce the nonspecific staining due to endogenous peroxidase, the samples were treated with 3% hydrogen peroxide (Sigma). The samples were then washed twice with Tris-based buffered saline containing 0.1% Tween-20 (TBST) for 5 min and incubated with 3% goat serum in TBST for 1 h at room temperature (R.T.). To stain for human uMUC1 antigen, the samples were incubated overnight at 4°C with a mouse monoclonal anti-MUC1 antibody that specifically targets human uMUC1 tandem repeats (clone: VU4H5; 1:200 in TBST with 3% goat serum; Cell Signaling, Danvers, MA). After rinsing with TBST, the samples were incubated with horseradish peroxidase (HRP)-conjugated goat anti-mouse IgG antibody (1:100 in TBST with 3% goat serum; Sigma) for 1 h at R.T. Then the samples were washed twice with TBST and the signal was revealed by incubation with 3, 3’-diaminobenzidine (DAB; Abcam, Cambridge, MA) for 10 min at R.T. The slides were counterstained with Harris’ hematoxylin (Sigma) for 30 sec. TMAs were then dehydrated through the sequence of ethanol solutions (50%, 75%, 95%, and 100%) and xylene. After mounting TMAs with cover slides, the sections were first analyzed under a Nikon Eclipse 50i microscope (Nikon Instruments Inc., Melville, NY, USA) and then scanned using a Tissue FAXS scanning system (Tissue Gnostics, Austria) attached to a Zeiss Axio Observer Z1 microscope (Zeiss, Germany) at the Imaging Core facilities of Rogan institute (Cambridge, MA) as described below.
Histopathology scoring
A histopathological scoring system was developed to assess the expression of human uMUC1 during the progression of PDAC. To minimize the bias that could result from visual observation and to enhance the confidence level, we used an ImageJ-assisted image quantification method (Figure 1). Briefly, images of DAB-stained TMAs were first acquired using a Nikon microscope with 100× objective and processed through interactive 3D surface plot in the ImageJ plugin package. The DAB staining intensity of the ductal regions or regions of interest (ROIs) were determined by the spectrum lookup table (LUT) via 3D rendering images. The highest intensity in long wavelength spectrum (red) was scored as 5 whereas the background intensity in short wavelength spectrum (blue) was scored as 0. Data were expressed as an average score of the ROIs on PDAC slides of the same stage.
Figure 1.
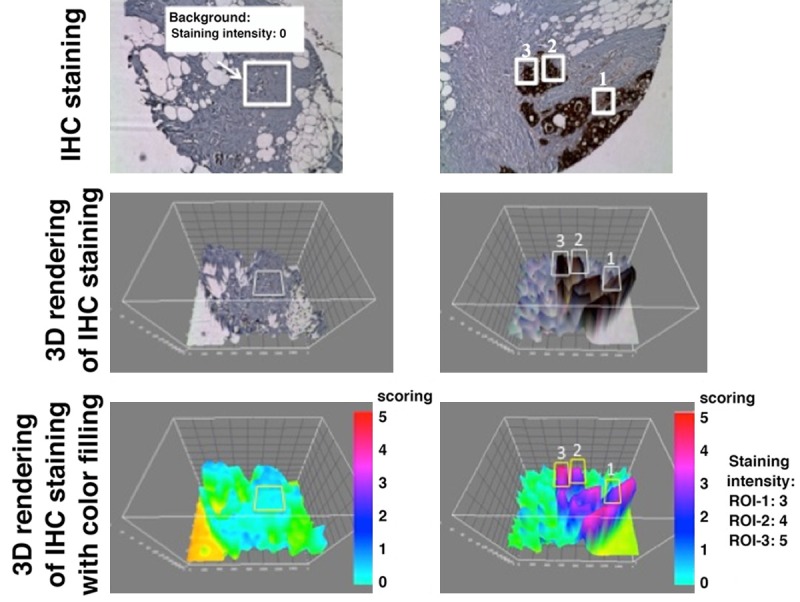
ImageJ-assisted scoring method for evaluating the staining intensity. 3D rendering was applied to the images of IHC-stained tissue. ROIs (white boxes) of the background (left) and ductal adenocarcinoma (right) were selected. To enhance the visualization of signal intensity, 3D rendered images were color-coded. Scoring was assigned according to the color scale (red: 5; pink: 4; purple: 3; blue: 2; light blue: 1).
FACS-like single cell analysis for human uMUC1 expression by HistoQuest software
To further evaluate human uMUC1 expression at the cellular level at different stages of PDAC, IHC-stained TMAs were scanned using 200× objective of a Tissue FAXS acquisition system (Tissue Gnostics, Austria) attached to a Zeiss Axio Observer Z1 microscope. Images from TissueFAXS were imported into automatic imaging analysis software, HistoQuest (Tissue Gnostics, Austria). The ROIs of the lesion sites were visually determined and manually selected. The cell population was identified by hematoxilin nucleus staining in selected ROIs. This approach can separate hematoxylin and uMU1-DAB stains by the optical density (OD) of each pixel in individual cell. The abundance of uMUC1 expression was evaluated by DAB intensity of each hematoxilin-positive cell in corresponding ROIs by this color separation method (Figure 2). Using this method, a FACS-like scattergram data were generated by Prism 6.0 software (GraphPad, La Jolla, CA) presenting DAB intensity as a function of hematoxilin intensity on x-axis. As a result, the distribution of uMUC1 expression at various stages of PDAC was obtained. To determine the staining intensity of uMUC1, we defined the optical density of each individual cell using the following threshold: low DAB intensity = less than 50; intermediate DAB intensity = higher or equal to 50 but less than 100; high DAB intensity: higher or equal to 100.
Figure 2.
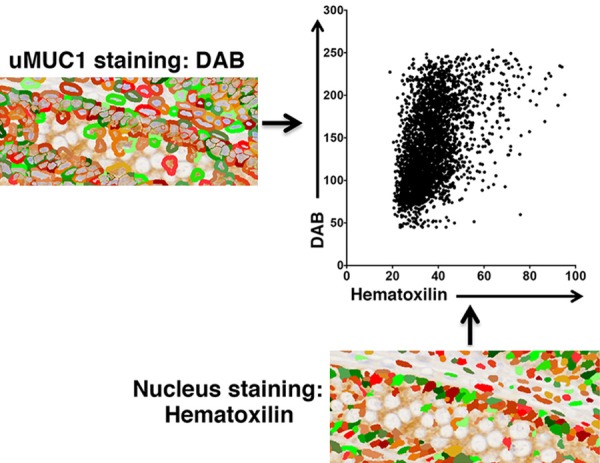
HistoQuest image analysis of uMUC1 expression in single cell populations defined by hematoxilin nucleus staining. uMUC1 expression was determined by DAB intensity in membranous and cytosolic regions of each hematoxilin-positive cell.
Statistical analysis
Prism 6.0 software was used for statistical analysis. Data are represented as mean ± SD. Unpaired two-tailed Student’s t test was used for comparison of two variables. P values less than 0.05 were considered significant.
Results
uMUC1 expression in early pancreatic intraepithelial neoplasia (PanIN)
Pancreatic intraepithelial neoplasia (PanIN) is a term for the pancreatic intraductal proliferation, which is believed to be a precursor of invasive pancreatic ductal adenocarcinoma (PDAC) [29]. Morphologically, PanINs are categorized into four types (1A, 1B, 2, and 3). PanIN-1A displays as a flat lesion with certain degree of hyperplasia whereas Pan-IN-1B is a papillary lesion without abnormal nucleus. PanIN-2 displays both architectural abnormality such as papillary lesion and cytological abnormality including loss of polarity, nuclear crowding, enlarged nuclei, pseudo-stratification and hyperchromatism. Finally, PanIN-3 displays higher degree of cytological abnormality compared to PanIN-2.
To investigate the expression of human uMUC1 in PanINs, we stained the TMA (Cat# BIC14011a; US Biomax) containing PanINs and the early stage PDAC with antibody against human uMUC1. As shown in Figure 3, low levels of uMUC1 were detected in PanIN-3 but the expression was negligible in PanIN-1 and PanIN-2. In contrast, uMUC1 was present strongly in the early stages of pancreatic ductal adenocarcinoma (PDAC), indicating that uMUC1 is a useful biomarker for the emergence of PDAC.
Figure 3.
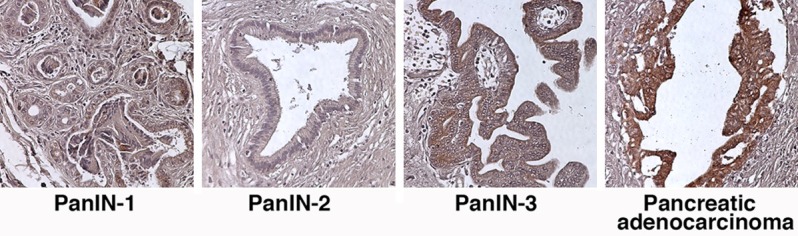
IHC staining for uMUC1 in PanIN tissues and stage 1 PDAC tissue. Original magnification; 100×.
Detection of uMUC1 in various stages of pancreatic ductal adenocarcinoma (PDAC)
As a second step towards the validation of uMUC1 as a biomarker of disease progression in PDAC, we investigated the correlation between uMUC1 expression and PDAC stage. Histologically, PDACs are graded as well differentiated, moderately differentiated, and poorly differentiated. Samples from the patients with stage I of PDAC exhibited a well-differentiated and clear glandular pattern with a high staining level of uMUC1 that appeared to be in both the cytosolic and membranous regions. This broad distribution was consistent with the reported literature [30]. In stage II of PDAC, the morphology of the ducts displayed an increasing architectural disorganization and dysplastic growth (Figure 4). Compared to stage I, decreased uMUC1 expression was observed in this stage of PDAC. In the later stages of PDAC (stages III and IV), the enlarged ductal architecture disappeared and poorly differentiated distribution of the adenocarcinoma was observed. Also, the presence of nuclear atypia and desmoplasia appeared which are classic characteristics of the invasive nature of the lesion. The expression of uMUC1 in these samples varied significantly. Overall, uMUC1 expression decreased with disease progression. In addition, uMUC1 expression stayed at intermediate levels in the adjacent tissues irrespective to their inflammation levels and the disease stages of the primary tumors. Visually, the expression in normal pancreas was similar to adjacent tissues.
Figure 4.
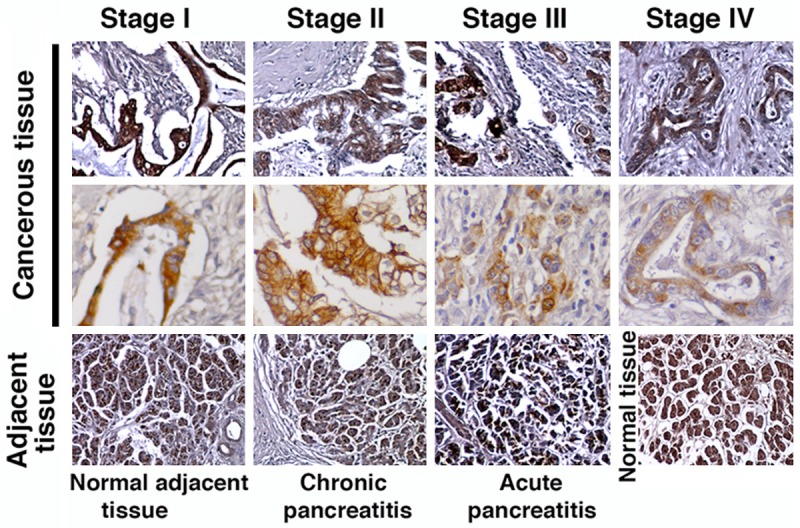
IHC staining for uMUC1 in PDAC (cancerous tissue), cancer adjacent tissue, and normal pancreatic tissue. Original magnification; top and bottom rows-100×; middle row-400×.
Histopathology scoring
To evaluate uMUC1 expression level, we applied an ImageJ-assisted method for histopathological scoring of intensity of IHC-stained TMA samples. In cancer adjacent tissues we scored the overall staining intensity whereas in tumor tissues we scored the average intensity of all the ducts appearing on each individual sample. As shown in Figure 5, the adjacent tissue and the stage I PDAC showed significantly higher staining intensity than the later stages of PDAC (P<0.05). Due to the small sample size of later stages, we could not assign a significant difference to uMUC1 expression between stages II and III (P = 0.07). However, there was a clear transition in uMUC1 expression from early stages (I and II) to later stages (III and IV). In addition, based on the TNM staging system provided by US Biomax (TMA# PA811; http://www.biomax.us/tissue-arrays/Pancreas/PA811), regional lymph node metastasis was observed in all stage III PDAC samples whereas distal organ metastasis was observed in all stage IV PDAC samples. This could point to correlation between the reduction of uMUC1 expression and the initiation of invasiveness of PDAC.
Figure 5.
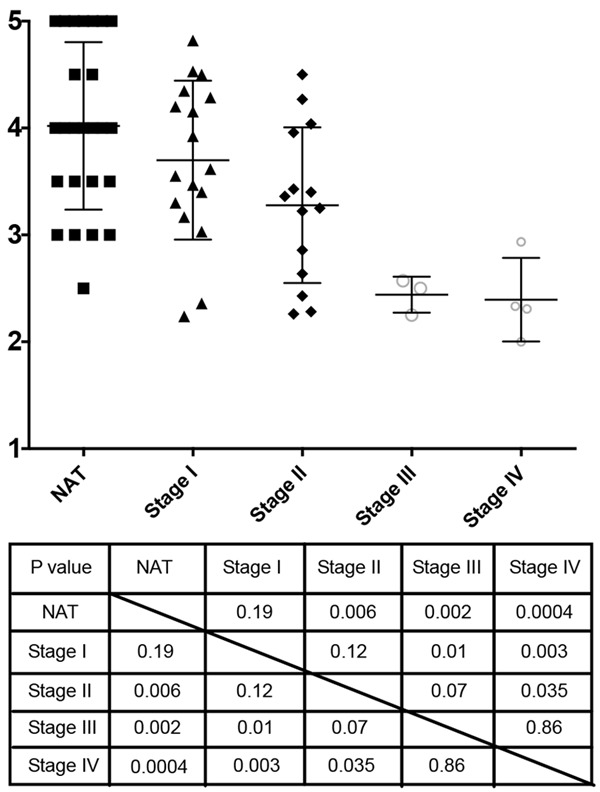
ImageJ-assisted visual scoring of uMUC1 expression. P values of unpaired two-tailed Student t-test of group comparison are shown in the table.
FACS-like single cell analysis of uMUC1 expression by HistoQuest
To evaluate uMUC1 expression in individual cell of PDAC during disease progression, lesion areas were selected using HistoQuest software and the signal intensities of hematoxilin and DAB were recorded. The expression levels of uMUC1 were defined by the DAB signal intensity as described in Materials and Methods. In the stage I PDAC lesion, over 64% of the PDAC cells expressed high level of uMUC1 (Figure 6A). During disease progression, the expression levels of uMUC1 decreased. This result was consistent with the previous visual histological scoring results (Figure 5). In the adjacent tissues, the expression of uMUC1 appeared to be at the intermediate to high level. Interestingly, in the adjacent tissues with acute inflammatory condition, uMUC1 expression was higher than that in the adjacent tissues with normal or chronic inflammatory conditions (Figure 6B).
Figure 6.
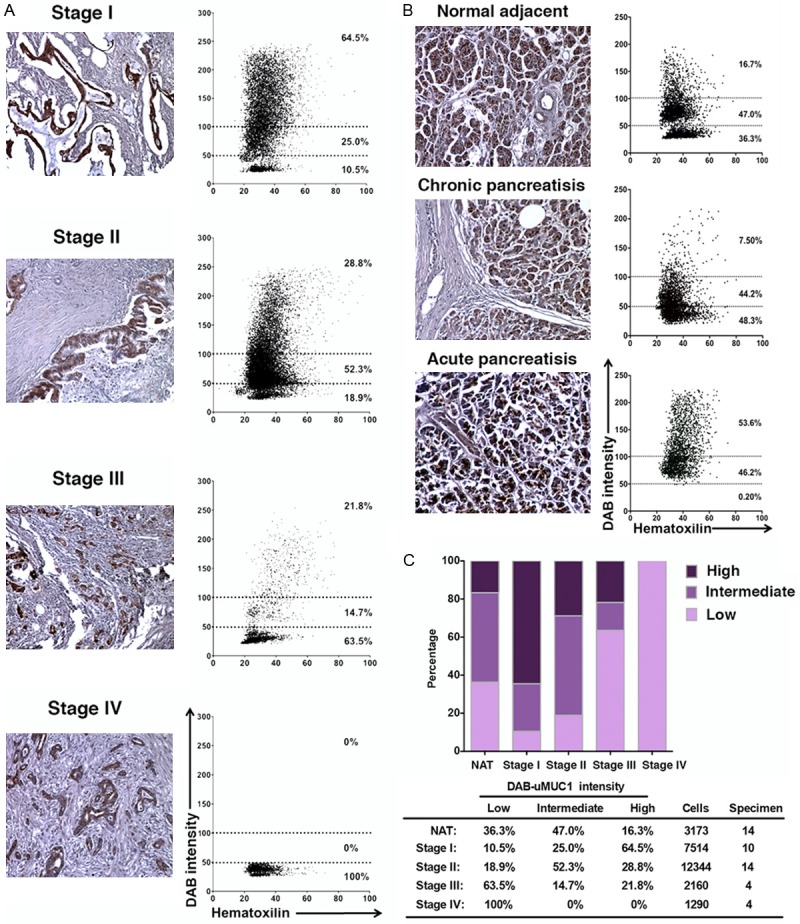
Automatic image analysis of the staining intensity using HistoQuest software. A. Representative image of various stages of PDAC and the corresponding scattergram of DAB and hematoxilin intensities of all PDAC samples. The graph was constructed using the data combined from multiple specimens (Stage I: n = 10; Stage II: n = 14; Stage III: n = 4; Stage IV: n = 4). B. Representative image of adjacent tissue under normal or inflammatory conditions and the corresponding scattergram of DAB and hematoxilin intensities of adjacent tissue samples. The graph was constructed using the data combined from multiple specimens (NAT: n = 7; chronic pancreatitis: n = 4; acute pancreatitis: n = 3). C. Overall uMUC1 expression in normal adjacent tissues (including normal adjacent and pancreatitis) and PDAC. Bottom table indicates percentage of cell populations with low, intermediate, and high expression levels of uMUC1. The total number of cells and specimens used for the data analysis is included in the table. Original magnification in all images-100×.
Combining all the data, we summarized the results in Figure 5C. The expression level of uMUC1 of individual PDAC cells decreased with tumor progression while uMUC1 expression level remained intermediate throughout the adjacent tissues. The results in adjacent tissues obtained by single cell analysis were slightly different than the visual scoring data (Figure 5). Previously, we observed that the overall uMUC1 expression in adjacent tissues was slightly higher but not significantly different than stage I PDAC, which was not the case with our results from HistoQuest imaging analysis. Based on these results we conclude that the computational image analysis can provide less subjective and more accurate results than visual histological evaluation.
Discussion
Protein glycosylation is a posttranslational process playing a crucial role in protein folding and trafficking, cell-cell interaction [31], cell signaling, and immune response [32]. Based on the SwissProt database, more than 50% of human proteins undergo this specific process [33]. Aberrant glycosylation was commonly observed in cancer cells. However, it is a debate whether aberrant glycosylation is a result or a cause of cancer [34]. Overexpression of uMUC1, a large, type I transmembrane glycoprotein, has been reported in multiple cancers. Particularly for pancreatic adenocarcinoma, overexpression of uMUC1 is significantly associated with tumor growth and invasiveness [35].
However, while most of the literature focuses on the aberrant expression of MUC1 in cancer, there is lack of discussion about the role of the hypoglycosylation or underglycosylation of MUC1 in cancer progression. The underglycosylated form of the antigen, in contrast to the total abundance of the antigen, represents a novel and distinct biomarker of disease progression due to the link between underglycosylation and cell-stroma/cell-cell adhesion. Namely, the underglycosylated MUC1 is known to serve as an anchor for cancer cells during metastasis. It interacts with selectins (E- and P-selectins) and ICAM-1, which facilitates the interaction between cancer cells and components of the extracellular matrix and vascular endothelium [36].
Here, our focal point was on the role of uMUC1 in PDAC progression. We used immunohistochemical analysis of PDAC TMAs to identify changes in uMUC1 expression and distribution with disease progression. The upregulation of uMUC1 was absent in PanIN-1 and PanIN-2 and expressed at low levels in PanIN-3. This indicated that uMUC1 might not serve as a useful biomarker of early dysplasia.
Interestingly, uMUC1 abundance reached a peak at stage I of PDAC while still minimal architectural disorganization and dysplastic growth were observed. In addition, the redistribution of uMUC1 cellular expression from the apical surface to the cytoplasm and cell membrane was already detected at this stage. On the other hand, the uMUC1 expression level varied significantly at Stage III. Reduced uMUC1 expression relative to stage I was observed in the later stage of invasive PDAC (Stage IV). This observation may indicate a transient upregulation of uMUC1 with the emergence of overt malignancy, followed by a decrease in the abundance of the antigen, possibly through a currently unknown compensatory mechanism.
Nevertheless, these results are consistent with a model according to which underglycosylated uMUC1, through its exposure of selectin-binding glycoproteins (sialyl Lewis), promotes interactions between the cancer cell and tumor stromal or endothelial cells. These interactions are known to play a crucial part in the early stages of metastasis. A key event is the binding of uMUC1 to ICAM-1 and E-selectin, which promotes the capacity of cancer cells to migrate through the microenvironment by enhancing the association with the local blood vessel endothelium [37].
These findings suggest an interesting phenomenon that is specific to PDAC. In particular, while in most cancers, uMUC1 is typically upregulated on cells that are overtly metastatic, in PDAC, uMUC1 is upregulated at stage I. The earlier time point of uMUC1 upregulation in PDAC may signify a different, more aggressive timeline of progression to malignancy in pancreatic cancer, according to which tumor cells initiate the process of metastasis/invasiveness at early stages of transformation.
An additional observation was that the upregulation of uMUC1 in the adjacent tissues was present regardless of the stages of the nearby tumor tissue. This observation was similar to the finding in our previous breast cancer study [5]. There is a possibility that these abnormalities can be associated with the transformation of the surrounding microenvironment of the lesion in what is known as the field effect.
We further analyzed the TMAs with HistoQuest, an automatic imaging analysis software. The advantage of using this method is to minimize the visual bias from the observers. At the same time, a single cell expression profile was generated via FACS-like scattergram. The expression profiles of uMUC1 in PDAC were consistent to the visual scoring results. The difference between the two methods was the uMUC1 expression in adjacent tissues. The reason behind this might be the higher background of the counterstaining in the inflammatory adjacent tissues. As a result, the visual scoring indicated higher expression of uMUC1. By contrast, the automatic imaging analysis only acquired the DAB color intensity as intermediate in these adjacent tissues. Along with this finding, the systematic tissue analysis protocol provided faster and accurate imaging analysis especially on the big data set such as TMAs.
Altogether, our findings suggested that uMUC1 could serve as biomarker for the diagnosis the early stage of PDAC. In addition it could forecast disease based on the emergence of uMUC1 overexpressing cells in adjacent normal tissues.
Acknowledgement
This work was supported in part by the award from the National Institute of Health R01CA135650 to A.M. (Contact PI) and Z.M. (Co-PI).
Disclosure of conflict of interest
None.
References
- 1.American Cancer Society website. American Cancer Society website. http://www.cancer.org/cancer/pancreaticcancer/detailedguide/pancreatic-cancer-key-statistics. Updated June 11, 2014. Accessed September 3, 2014. -See more at: http://www.ajmc.com/publications/evidence-based-oncology/2014/september-2014/immunotherapy-trials-offering-promise-in-hard-to-treat-pancreatic-cancer/2-sthash.2DP7A1qT.dpuf.
- 2.Li D, Xie K, Wolff R, Abbruzzese JL. Pancreatic cancer. Lancet. 2004;363:1049–1057. doi: 10.1016/S0140-6736(04)15841-8. [DOI] [PubMed] [Google Scholar]
- 3.Long J, Zhang Y, Yu X, Yang J, LeBrun DG, Chen C, Yao Q, Li M. Overcoming drug resistance in pancreatic cancer. Expert Opin Ther Targets. 2011;15:817–828. doi: 10.1517/14728222.2011.566216. [DOI] [PMC free article] [PubMed] [Google Scholar]
- 4.Souchek JJ, Baine MJ, Lin C, Rachagani S, Gupta S, Kaur S, Lester K, Zheng D, Chen S, Smith L, Lazenby A, Johansson SL, Jain M, Batra SK. Unbiased analysis of pancreatic cancer radiation resistance reveals cholesterol biosynthesis as a novel target for radiosensitisation. Br J Cancer. 2014;111:1139–1149. doi: 10.1038/bjc.2014.385. [DOI] [PMC free article] [PubMed] [Google Scholar]
- 5.Ghosh SK, Pantazopoulos P, Medarova Z, Moore A. Expression of underglycosylated MUC1 antigen in cancerous and adjacent normal breast tissues. Clin Breast Cancer. 2013;13:109–118. doi: 10.1016/j.clbc.2012.09.016. [DOI] [PMC free article] [PubMed] [Google Scholar]
- 6.Armon-Omer A, Hadary A, Hilu G, Tayar BE, Keren T, Sharabi-Nov A, Bickel A, Klein O. Detection of breast cancer from blood through analysis of lymphocyte fluorescent intensity using MUC1 antigen. Breast Cancer. 2015;22:626–633. doi: 10.1007/s12282-014-0529-z. [DOI] [PubMed] [Google Scholar]
- 7.Gheybi E, Amani J, Salmanian AH, Mashayekhi F, Khodi S. Designing a recombinant chimeric construct contain MUC1 and HER2 extracellular domain for prediagnostic breast cancer. Tumour Biol. 2014;35:11489–11497. doi: 10.1007/s13277-014-2483-y. [DOI] [PubMed] [Google Scholar]
- 8.Beatty PL, Plevy SE, Sepulveda AR, Finn OJ. Cutting edge: transgenic expression of human MUC1 in IL-10-/- mice accelerates inflammatory bowel disease and progression to colon cancer. J Immunol. 2007;179:735–739. doi: 10.4049/jimmunol.179.2.735. [DOI] [PubMed] [Google Scholar]
- 9.Block A, Milasinovic D, Mueller J, Schaefer P, Schaefer H, Greten H. Amplified Muc1-specific gene expression in colon cancer cells utilizing a binary system in adenoviral vectors. Anticancer Res. 2002;22:3285–3292. [PubMed] [Google Scholar]
- 10.Avichezer D, Taylor-Papadimitriou J, Arnon R. A short synthetic peptide (DTRPAP) induces anti-mucin (MUC-1) antibody, which is reactive with human ovarian and breast cancer cells. Cancer Biochem Biophys. 1998;16:113–128. [PubMed] [Google Scholar]
- 11.Hough CD, Sherman-Baust CA, Pizer ES, Montz FJ, Im DD, Rosenshein NB, Cho KR, Riggins GJ, Morin PJ. Large-scale serial analysis of gene expression reveals genes differentially expressed in ovarian cancer. Cancer Res. 2000;60:6281–6287. [PubMed] [Google Scholar]
- 12.Trevino LS, Giles JR, Wang W, Urick ME, Johnson PA. Gene expression profiling reveals differentially expressed genes in ovarian cancer of the hen: support for oviductal origin? Horm Cancer. 2010;1:177–186. doi: 10.1007/s12672-010-0024-8. [DOI] [PMC free article] [PubMed] [Google Scholar]
- 13.Burdick MD, Harris A, Reid CJ, Iwamura T, Hollingsworth MA. Oligosaccharides expressed on MUC1 produced by pancreatic and colon tumor cell lines. J Biol Chem. 1997;272:24198–24202. doi: 10.1074/jbc.272.39.24198. [DOI] [PubMed] [Google Scholar]
- 14.Roy LD, Sahraei M, Subramani DB, Besmer D, Nath S, Tinder TL, Bajaj E, Shanmugam K, Lee YY, Hwang SI, Gendler SJ, Mukherjee P. MUC1 enhances invasiveness of pancreatic cancer cells by inducing epithelial to mesenchymal transition. Oncogene. 2011;30:1449–1459. doi: 10.1038/onc.2010.526. [DOI] [PMC free article] [PubMed] [Google Scholar]
- 15.Nath S, Daneshvar K, Roy LD, Grover P, Kidiyoor A, Mosley L, Sahraei M, Mukherjee P. MUC1 induces drug resistance in pancreatic cancer cells via upregulation of multidrug resistance genes. Oncogenesis. 2013;2:e51. doi: 10.1038/oncsis.2013.16. [DOI] [PMC free article] [PubMed] [Google Scholar]
- 16.Ju T, Cummings RD. A unique molecular chaperone Cosmc required for activity of the mammalian core 1 beta 3-galactosyltransferase. Proc Natl Acad Sci U S A. 2002;99:16613–16618. doi: 10.1073/pnas.262438199. [DOI] [PMC free article] [PubMed] [Google Scholar]
- 17.Barratt-Boyes S. Making the most of mucin: a novel target for tumor immunotherapy. Cancer Immunol Immunother. 1996;43:142–151. doi: 10.1007/s002620050315. [DOI] [PubMed] [Google Scholar]
- 18.Burchell J, Taylor-Papadimitrou J. Effect of modification of carbohydrate side chains on the reactivity of antibodies with core-protein epitopes of the MUC1 gene product. Epith Cell Biol. 1993;2:155–162. [PubMed] [Google Scholar]
- 19.Spicer A, Rowse G, Lidner T, Gendler S. Delayed mammary tumor progression in Muc-1 null mice. J Biol Chem. 1995;270:30093–30101. doi: 10.1074/jbc.270.50.30093. [DOI] [PubMed] [Google Scholar]
- 20.Lang JM, Andrei AC, McNeel DG. Prioritization of cancer antigens: keeping the target in sight. Expert Rev Vaccines. 2009;8:1657–1661. doi: 10.1586/erv.09.134. [DOI] [PubMed] [Google Scholar]
- 21.Lakshminarayanan V, Thompson P, Wolfert MA, Buskas T, Bradley JM, Pathangey LB, Madsen CS, Cohen PA, Gendler SJ, Boons GJ. Immune recognition of tumor-associated mucin MUC1 is achieved by a fully synthetic aberrantly glycosylated MUC1 tripartite vaccine. Proc Natl Acad Sci U S A. 2012;109:261–266. doi: 10.1073/pnas.1115166109. [DOI] [PMC free article] [PubMed] [Google Scholar]
- 22.Ghosh SK, Uchida M, Yoo B, Ross AW, Gendler SJ, Gong J, Moore A, Medarova Z. Targeted imaging of breast tumor progression and therapeutic response in a human uMUC-1 expressing transgenic mouse model. Int J Cancer. 2013;132:1860–1867. doi: 10.1002/ijc.27872. [DOI] [PMC free article] [PubMed] [Google Scholar]
- 23.Medarova Z, Rashkovetsky L, Pantazopoulos P, Moore A. Multiparametric monitoring of tumor response to chemotherapy by noninvasive imaging. Cancer Res. 2009;69:1182–1189. doi: 10.1158/0008-5472.CAN-08-2001. [DOI] [PMC free article] [PubMed] [Google Scholar]
- 24.Kumar M, Yigit M, Dai G, Moore A, Medarova Z. Image-guided breast tumor therapy using a small interfering RNA nanodrug. Cancer Res. 2010;70:7553–7561. doi: 10.1158/0008-5472.CAN-10-2070. [DOI] [PMC free article] [PubMed] [Google Scholar]
- 25.Ghosh S, Yigit M, Uchida M, Ross A, Barteneva N, Moore A, Medarova Z. Sequence-dependent combination therapy with doxorubicin and a survivin-specific small interfering RNA nanodrug demonstrates efficacy in models of adenocarcinoma. Int J Cancer. 2014;134:1758–1766. doi: 10.1002/ijc.28499. [DOI] [PMC free article] [PubMed] [Google Scholar]
- 26.Remmers N, Anderson JM, Linde EM, DiMaio DJ, Lazenby AJ, Wandall HH, Mandel U, Clausen H, Yu F, Hollingsworth MA. Aberrant expression of mucin core proteins and o-linked glycans associated with progression of pancreatic cancer. Clin Cancer Res. 2013;19:1981–1993. doi: 10.1158/1078-0432.CCR-12-2662. [DOI] [PMC free article] [PubMed] [Google Scholar]
- 27.Medarova Z, Pham W, Kim Y, Dai G, Moore A. In vivo imaging of tumor response to therapy using a dual-modality imaging strategy. Int J Cancer. 2006;118:2796–2802. doi: 10.1002/ijc.21672. [DOI] [PubMed] [Google Scholar]
- 28.Wang P, Yoo B, Sherman S, Mukherjee P, Ross A, Pantazopoulos P, Petkova V, Farrar C, Medarova Z, Moore A. Predictive imaging of chemotherapeutic response in a transgenic mouse model of pancreatic cancer. Int J Cancer. 2016;139:712–8. doi: 10.1002/ijc.30098. [DOI] [PMC free article] [PubMed] [Google Scholar]
- 29.Hruban RH, Adsay NV, Albores-Saavedra J, Compton C, Garrett ES, Goodman SN, Kern SE, Klimstra DS, Kloppel G, Longnecker DS, Luttges J, Offerhaus GJ. Pancreatic intraepithelial neoplasia: a new nomenclature and classification system for pancreatic duct lesions. Am J Surg Pathol. 2001;25:579–586. doi: 10.1097/00000478-200105000-00003. [DOI] [PubMed] [Google Scholar]
- 30.Singh PK, Hollingsworth MA. Cell surface-associated mucins in signal transduction. Trends Cell Biol. 2006;16:467–476. doi: 10.1016/j.tcb.2006.07.006. [DOI] [PubMed] [Google Scholar]
- 31.Crocker PR, Feizi T. Carbohydrate recognition systems: functional triads in cell-cell interactions. Curr Opin Struct Biol. 1996;6:679–691. doi: 10.1016/s0959-440x(96)80036-4. [DOI] [PubMed] [Google Scholar]
- 32.Feizi T. Carbohydrate-mediated recognition systems in innate immunity. Immunol Rev. 2000;173:79–88. doi: 10.1034/j.1600-065x.2000.917310.x. [DOI] [PubMed] [Google Scholar]
- 33.Apweiler R, Hermjakob H, Sharon N. On the frequency of protein glycosylation, as deduced from analysis of the SWISS-PROT database. Biochim Biophys Acta. 1999;1473:4–8. doi: 10.1016/s0304-4165(99)00165-8. [DOI] [PubMed] [Google Scholar]
- 34.Hakomori S. Glycosylation defining cancer malignancy: new wine in an old bottle. Proc Natl Acad Sci U S A. 2002;99:10231–10233. doi: 10.1073/pnas.172380699. [DOI] [PMC free article] [PubMed] [Google Scholar]
- 35.Tsutsumida H, Swanson BJ, Singh PK, Caffrey TC, Kitajima S, Goto M, Yonezawa S, Hollingsworth MA. RNA interference suppression of MUC1 reduces the growth rate and metastatic phenotype of human pancreatic cancer cells. Clin Cancer Res. 2006;12:2976–2987. doi: 10.1158/1078-0432.CCR-05-1197. [DOI] [PubMed] [Google Scholar]
- 36.Geng Y, Yeh K, Takatani T, King MR. Three to Tango: MUC1 as a ligand for both E-Selectin and ICAM-1 in the breast cancer metastatic cascade. Front Oncol. 2012;2:76. doi: 10.3389/fonc.2012.00076. [DOI] [PMC free article] [PubMed] [Google Scholar]
- 37.Horm TM, Schroeder JA. MUC1 and metastatic cancer: expression, function and therapeutic targeting. Cell Adh Migr. 2013;7:187–198. doi: 10.4161/cam.23131. [DOI] [PMC free article] [PubMed] [Google Scholar]