

Abstract
Elevation gradients impose large differences in abiotic and biotic conditions over short distances, in turn, likely driving differences in gene expression more than would genetic variation per se, as natural selection and drift are less likely to fix alleles at such a narrow spatial scale. As elevation increases, the pressure exerted on plants by herbivores and on arthropod herbivores by predators decreases, and organisms spanning the elevation gradient are thus expected to show lower levels of defence at high elevation. The alternative hypothesis, based on the optimal defence theory, is that defence allocation should be higher in low-resource habitats such as those at high elevation, due to higher costs associated with tissue replacement. In this study, we analyse variation with elevation in (i) defence compound content in the plant Lotus corniculatus and (ii) gene expression associated with defence against predators in the specific phytophagous moth, Zygaena filipendulae. Both species produce cyanogenic glycosides (CNglcs) such as lotaustralin and linamarin as defence mechanisms, with the moth, in addition, being able to sequester CNglcs from its host plant. Specifically, we tested the assumption that the defence-associated phenotype in plants and the gene expression in the insect herbivore should covary between low- and high-elevation environments. We found that L. corniculatus accumulated more CNglcs at high elevation, a result in agreement with the optimal defence theory. By contrast, we found that the levels of expression in the defence genes of Z. filipendulae larvae were not related to the CNglc content of their host plant. Overall, expression levels were not correlated with elevation either, with the exception of the UGT33A1 gene, which showed a marginally significant trend towards higher expression at high elevation when using a simple statistical framework. These results suggest that the defence phenotype of plants against herbivores, and subsequent herbivore sequestration machineries and de novo production, are based on a complex network of interactions.
Keywords: cyanogenic glycosides, elevation gradient, gene expression, Lotus corniculatus, predation, Zygaena filipendulae
1. Introduction
Phenotypes are the result of variation in gene sequence, gene expression and subsequent molecular modifications within a metabolic scheme that varies across populations under distinct environmental pressures [1,2]. Adaptation along the dimensions of the ecological niche [3] can be caused by molecular changes occurring at the genetic [4], epigenetic [5] or transcription [6] levels, the latter being considered as the predominant driver of phenotypic plasticity [7,8]. Ultimately, fixation of adaptive alleles and epigenetic polymorphisms occurs in populations if natural selection is not counterbalanced by gene flow [9]. An increasing number of studies have documented differential gene expression along environmental gradients. For example, phenotypic differences and associated differential gene expression have been observed for genes dealing with cold and hypoxia stress, and haemoglobin polymorphisms [10–12]. However, few studies have investigated traits that are directly related to interactions among organisms along environmental clines [13,14].
Elevation gradients are particularly well suited to investigate variation in gene expression across contrasting biotic and abiotic conditions [15,16]. Following the optimal defence theory [17], the cost of tissue replacement at high elevation should select for higher defence levels, if plants cannot invest in tolerance [18,19]. In this scenario, insect populations that inhabit low-resource habitats, such as high-elevation environments, should have greater defence mechanisms than their counterparts at lower elevations, mainly as a response to the reduced offspring production, shortened reproductive season and decreased fecundity that they must face [15,20]. On the other hand, due to predictable variation in temperature regimes, one of the biotic parameters that varies most with elevation is the metabolic activity of ectothermic animals (which decreases at higher elevation) [15,21–24]. Therefore, it has been postulated that high-elevation plants, due to a reduction in herbivore pressure, should relax their defences [25,26]. Similarly, herbivores should be selected to invest little in defending against predators or parasitoids at high elevation [15]. However, if high-elevation plants contain reduced levels of chemical defences, we could postulate that there would be selection for those herbivores able to re-allocate plant secondary compounds into their own defence to compensate with increased sequestration activity and/or de novo production of defence compounds in herbivore arthropods at higher elevation, particularly in specialists [23,24,27,28].
Cyanogenic glycosides (CNglcs) are generally regarded as products of secondary metabolism that act as a defence mechanism in both plants and animals [29]. While toxic to most generalist herbivores [30–32], several specialized insects have evolved the ability to concentrate and store these toxic compounds upon feeding on plants, and use them for defence against their predators, as in the case of Zygaena moths [33–36]. Additionally, several Lepidoptera species within the genera Zygaena and Heliconius [34] have evolved the ability to produce CNglcs de novo, using enzymes analogous to those in the plants [37]. Zygaena species use two of the most abundant CNglcs, lotaustralin and linamarin, as defence compounds [36,38]. Following the hypothesis of lower predation at high elevation, we may expect a decrease in the production of linamarin and lotaustralin, and therefore lower defence-gene expression, at higher elevation. By contrast, if the predation rate becomes too costly in low-resource environments—as suggested by the optimal defence theory—we should expect an increase in defence-gene expression at higher elevation. Both hypotheses stand for the plants producing linamarin and lotaustralin as defence compounds, such as Lotus corniculatus, the host for several Zygaena species [39].
Here, we investigated whether: (i) elevation gradients drive variation in the CNglc content of the plant L. corniculatus, (ii) whether variation in CNglc production in the plant drives variation in the expression of genes associated with linamarin and lotaustralin production in the moth Zygaena filipendulae, a specialist herbivore on L. corniculatus and (iii) whether the elevation gradient drives variation in the expression of those defence-associated genes in the moth. We used the elevation gradient of the Swiss Alps, where both L. corniculatus and Z. filipendulae can be found in a broad range of elevations and habitats (from 300 up to 3000 m a.s.l.) [40,41], and measured CNglc concentrations in L. corniculatus and gene expression related to CNglc production in Z. filipendulae.
2. Material and methods
2.1. Study system
We focused on the six-spotted burnet moth Z. filipendulae (Lepidoptera) and its preferred host plant, the bird's-foot trefoil L. corniculatus (Fabaceae) to examine if defence mechanisms vary along the elevation gradient. The host plant L. corniculatus is also attacked by other specialized moths, such as Syncopacma cinctella and Trifurcula subnitidella, as well as by more than 30 generalist species [39]. As for Z. filipendulae, it is a known prey of a large number of parasitoids [42]. In this system, both the host plant and the lepidopteran herbivore produce CNglcs, as mentioned above: while L. corniculatus uses CNglcs to deter several generalist herbivores [43], the larvae and adults of Z. filipendulae can do the same against generalist predators such as toads and birds [44,45]; Z. filipendulae larvae have also evolved the ability to sequester the CNglcs linamarin and lotaustralin from the host plant [46]. It is already known that CNglc concentration in Z. filipendulae larvae varies depending on the concentration in the host plant on which they were reared [45]. De novo biosynthesis allows the adjustment of overall content, particularly for larvae feeding on low CNglc or acyanogenic host plants [37,45–47]. Genes involved in the biosynthesis of CNglcs in Z. filipendulae include CYP405A2, CYP332A3 and UGT33A1; the first two genes are part of the cytochrome P450s family (CYP) whose principal role is the assimilation of xenobiotics, and the third gene is part of the UDP glucuronosyltransferase (UGT) enzyme family, which have a role in detoxification of the compounds produced by the P450 enzymes. These genes also function in the physiological regulation of larval development [48–50].
2.2. Tissue sampling
Larvae of Z. filipendulae were collected in June and July 2014 in the Swiss Alps, from localities at low (less than or equal to 800 m a.s.l.) and high elevation (greater than or equal to 1500 m.a.s.l). A maximum of four individuals was collected from each locality. The caterpillars were identified in the field following Paolucci [51], sorted from first to seventh larval instar according to their size (with an eighth stage being used to categorize pupae), and later DNA barcoded (see below) to confirm their identification. Individuals were cut in half with sterilized scalpel and tweezers. The head, thorax and first three abdominal segments were preserved in 1 ml of 70% ethanol for DNA extraction. The last seven abdominal segments were preserved in 1 ml of RNAlater RNA Stabilization Reagent (Qiagen) for RNA extraction. Subsequently, the samples were transported to the laboratory and stored at −20°C. Samples of L. corniculatus host plants (from the plant on which each larva was found), were collected in envelopes, transported on ice, weighed (five leaves per sample) and stored individually at −80°C in 96-well PCR plates to preserve CNglc content.
2.3. CNglc content in Lotus corniculatus
CNglc concentration measurements were performed using the Feigl–Anger method following Takos et al. [32]. This test allows a semi-quantitative analysis of CNglcs based on the reaction of copper acetate in the presence of cyanide [52]. The test paper was placed on the PCR plate containing the frozen samples and they were then returned to the freezer at −20°C in order to destroy the cell wall and start the cyanogenesis reaction. A first assay confirmed that there was no need to macerate the tissue in order to quantify the cyanide present in the leaf samples. After 1 h of reaction the test papers were digitized and scored using the Dot Blot Analysis function in ImageJ 1.48v software [53]. From each plant, the mean of the IntDen index from five leaves was used. The index corresponds to the Integrated Density of an image, which is calculated from the area and the mean of the grey value of each image or selection [53]. We did not use a reference in order to quantify each sample according to its linamarin/lotaustralin content, but instead used relative index values. Relative quantities of CNglc compounds in plants were corrected for leaf mass, by dividing the mean IntDen index by the mean weight of the five leaves of each host plant.
2.4. Barcoding Zygaena moths with cytochrome c oxidase I
In order to confirm species identification of the larvae, we barcoded 29 sampled specimens from across the sampling locations. DNA extraction of larvae was performed using the DNeasy Blood & Tissue kit (Qiagen, Hombrechtikon, Switzerland). DNA quantification was performed using NanoDrop (Witec, Luzern, Switzerland) and barcoding was performed using cytochrome c oxidase I (COI) primers (F N2185; R N3014; [54]). Ten nanograms of DNA was used per reaction in 20 µl total volume with 0.25 U Qiagen Taq DNA Polymerase, 2 µl buffer 10×, 0.64 µl MgCl2 25 mM, 0.2 µl dNTPs 25 mM and 1 µl primers 10 µM. The PCR was run with the following conditions: 95°C for 1.5 min for denaturation and 35 cycles at 95°C for 35 s, 52°C for 1 min, and 72°C for 1 min, followed by final elongation at 72°C for 8 min. The QIAquick PCR Purification Kit (Qiagen) was used for PCR product purification. Cycle sequencing was carried out with the BigDye® Terminator v. 3.1 Cycle Sequencing Kit (Life Technologies, Zug, Switzerland) with the following conditions: denaturation at 96°C for 2 min, 35 cycles at 96°C for 15 s, 52°C for 15 s and 60°C for 3 s. Sequencing was carried out with both forward and reverse primers, purifying the products using ethanol precipitation and running them on an Automatic Sequencer 3730xl (Applied Biosystems, Foster City, USA). After incorporating sequences of additional Zygaena species and the outgroup Carposina sasakii, all retrieved from GenBank (see accession numbers in electronic supplementary material, figure S1), sequence alignment was performed using the ClustalW algorithm implemented in Bioedit 7.0 [55], followed by minor manual correction. A phylogenetic tree was generated using the maximum-likelihood algorithm implemented in RAxML [56] run on the CIPRES portal [57]. The analysis was performed using ten alternative runs on distinct starting trees, with the GTR + G substitution model, 25 substitution rate categories and 1000 bootstrap iterations.
2.5. Gene expression of defence-associated genes in Zygaena filipendulae
For all confirmed Z. filipendulae samples, total RNA was extracted with the RNeasy Mini Kit (Qiagen) from 10 mg of moth abdomen. RNA was eluted in 30 µl of RNA-free water and quantified with a Qubit® 2.0 Fluorometer (Life Technologies). Sample quality was assessed with a fragment analyser (Advanced Analytical Technology I, Labgene, Châtel-St-Denis, Switzerland). To avoid genomic DNA contamination, 1 µg of total RNA was treated with 5 U of DNAse I (Roche, Basel, Switzerland) at 37°C for 30 min in a 10 µl solution containing 10 µM Tris–HCl pH 8, 0.5 µM MgCl2, 1 mM DTT and 10 U Rnasin Plus RNase Inhibitor (Promega, Dübendorf, Switzerland), followed by enzyme deactivation at 65°C for 10 min. Then 1/10 of the DNAse I treated RNA was reverse transcribed using the SuperScript® III First-Strand Synthesis Kit (Life Technologies), with 50 ng of random hexamer primers (Microsynth, Balgach, Switzerland), 4 U of Rnasin Plus RNase Inhibitor (Promega), 500 µM of dNTP in 20 µl. To avoid qPCR inhibition, cDNAs were purified using ethanol precipitation with 0.5 volume of 5 M NH4OAc (pH 8), 2.5 volumes of ethanol 96% and resuspended in 20 µl of 10 mM Tris–HCl (pH 8) and 0.1 mM EDTA. Gene expression was assessed by quantitative real-time PCR (qRT-PCR) for CYP332A3, CYP405A2 and UGT33A1. RNA polymerase II (RPII), Actine (ACT) and glyceraldehyde 3-phosphate dehydrogenase (GAPDH) were used as reference genes in order to normalize expression levels. For UGT33A1 and RPII we used the primers and protocol of Fürstenberg-Hägg et al. [58]. New primers were designed using Primer3 [59] and PrimerSelect (DNASTAR, Madison, USA) for the amplification of the other genes, and their specificity was checked by BLASTN. The new sequences are:
(i) ACT forward 5′-GTA CGA GCT TCC CGA CGG TCA G-3′,
(ii) ACT reverse 5′-TAC CGC ACG ACT CCA TAC CCA G-3′,
(iii) GAPDH forward 5′-TTC CGT GTT CCA GTC CCC AAT GTT T-3′,
(iv) GAPDH reverse 5′-TCC TTC AGC GGC TTC CTT GAC TTT T-3′,
(v) CYP405A2 forward 5′-GTG ATG CTT TGC GAA CCA GAT GAC A-3′,
(vi) CYP405A2 reverse 5′-CTT GCG GGT CGA CTT CCA TTT CTC A-3′,
(vii) CYP332A3 forward 5′-CGA CGA TGT GAC TGT GGA AAA GGG T-3′, and
(viii) CYP332A3 reverse 5′-GCC ACA CTT CGG GAT CAG AGA ACT C-3′.
More detailed information about the qRT-PCR can be found in the MIQE guidelines (see electronic supplementary material, table S1).
The quantification cycle value (CT) was measured with the Applied Biosystems 7500 real-time PCR System using 10 µl SYBR® Green I master mix (Eurogentec, Liège, Belgium) in a total volume of 20 µl per sample with 2 µl of cDNA. PCR thermal cycler conditions for CYP405A2, CYP333A3, ACT and GAPDH began with a hot start stage at 50°C for 2 min, then pre-denaturation at 95°C for 10 min, followed by 40 cycles at 95°C for 15 s, 63.5°C for 30 s and 72°C for 1 min. In the case of UGT33A1, conditions were as in Fürstenberg-Hägg et al. [58]; for RPII the 40 cycles consisted of 95°C for 15 s, 62°C for 30 sec and 72°C for 1 min. To control for primer-dimer formation a dissocation stage was added to all runs. Two replicates per sample were performed, and when the differences between the CT values of the replicates were above 0.3, they were repeated. Primer efficiency for the genes was: CYP405A2 = 94.98%, CYP332A3 = 97.03%; UGT33A1 = 93.38%, ACT = 93.32%, GAPDH = 97.04% and RPII = 103.54%, thus CT values were corrected by the efficiency before normalization. The standard curve method was used for normalization of the data, and qBasePLUS 1.3 (Biogazelle, Zwijnaarde, Belgium) was used to calculate the relative expression of the defence genes.
2.6. Statistical analyses of CNglc concentration in Lotus corniculatus and differential gene expression in Zygaena filipendulae
Differences in CNglc concentration of the host plant samples between low- and high-elevation populations were compared using a general linear model in R CRAN [60]. Constancy in gene expression of the reference and the defence-associated genes across the different instars of Z. filipendulae was examined by computing Pearson correlations between expression levels and the larval instar stages. Using the lmer function from the lme4 package [61], we examined the level of gene expression in Z. filipendulae as a function of (i) the gene considered, (ii) elevation, and (iii) CNglc content of the plant (all fixed factors). We further performed a simple one-tailed Student's t-test between levels of expression at low versus high elevation (i.e. to examine optimal defence theory in a simplified framework without considering the CNglc content of the plants) for each gene separately.
3. Results
3.1. Zygaena filipendulae samples and barcoding
A total of 81 Zygaena larvae were collected, with 61 samples coming from elevations less than or equal to 800 m a.s.l., and 20 from elevations greater than or equal to 1500 m a.s.l. Among them, 29 specimens were identified as Z. filipendulae, and COI barcoding confirmed that 28 of those were correctly assigned (16 at low and 12 at high elevation; only sample L39 was misidentified and excluded from further analyses; GenBank accessions KX773462-KX773490). COI sequences showed low intra-specific genetic variation (see electronic supplementary material, figure S1). The total number of specimens used in qRT-PCR was reduced to 25 (i.e. 13 for low and 12 for high elevation) after RNA-quality analysis. The larval instars of the 25 samples that passed the RNA-quality threshold are given in electronic supplementary material, table S2, and their collection localities are given in electronic supplementary material, table S3.
3.2. CNglc content in Lotus corniculatus leaves
The CNglc content of the host plants where the specimens of Z. filipendulae were collected was variable among samples. Our results showed that the CNglc content of the plants differed between high- and low-elevation samples (F1,73 = 15.48, p < 0.01), with higher concentrations in high-elevation (greater than or equal to 1500 m a.s.l.) L. corniculatus individuals (figure 1).
Figure 1.
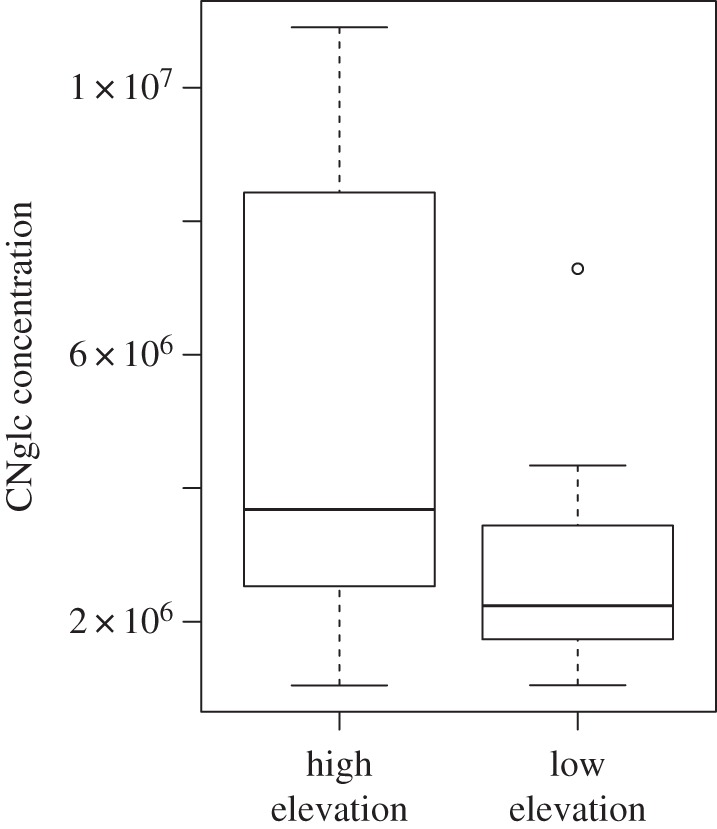
Quantitative analysis of cyanogenic glycoside (CNglc) content in L. corniculatus from high- versus low-elevation populations. Low (less than or equal to 800 m a.s.l.; n = 13) and high elevation (greater than or equal to 1500 m a.s.l.; n = 12) L. corniculatus were sampled across the Swiss Alps. CNglcs were quantified as the mean of five replicates of the integrated density value [53] divided by the weight of the leaf for each sample. High-elevation samples contain more CNglcs than low-elevation samples (p = 0.0375).
3.3. Expression of CNglc-associated genes
Measuring the gene expression of CNglc-associated genes in Z. filipendulae larvae allowed us to examine differential expression in the synthesis of CNglcs. RPII, ACT and GAPDH were used as reference genes to normalize expression levels because they (i) presented little variation among samples and (ii) did not show a correlation with the larval instar stage of the samples (ACT: F = 0.01, p = 0.90; GAPDH: F = 0.41, p = 0.53; RPII: F = 0.55, p = 0.47; see electronic supplementary material, figure S2). Levels of gene expression for CYP405A2, CYP332A3 and UGT33A1 did not vary as a function of the larval instar either (CYP405A2: F = 0.67, p = 0.42; CYP332A3: F = 1.62, p = 0.22; UGT33A1: F = 0.05, p = 0.82; see electronic supplementary material, figure S2).
Our linear model showed that gene expression did not vary among genes (F = 0.27, p = 0.25) or across elevations (F = 2.09, p = 0.15), and it was not correlated with the CNglc content of the host plants (F = 0.02, p = 0.89). Nevertheless, when omitting plant CNglc concentration from the analysis, we found a significant difference between gene expression in moths coming from high versus low elevation for UGT33A1 (t = 1.73, p = 0.048), with higher levels in high-elevation samples. Relative expression levels for the three genes are depicted in figure 2.
Figure 2.

Relative gene expression level of three defence-associated genes in Z. filipendulae from low- and high-elevation populations. Samples from low elevation are shown in black (L; less than or equal to 800 m a.s.l.; n = 13) and those from high elevation are shown in grey (H; greater than or equal to 1500 m a.s.l.; n = 12). Relative expression level in each of the 25 moth samples is given for each of the following genes: UGT33A1 (a; low-elevation mean = 1.087; high-elevation mean = 2.657), CYP405A2 (b; low-elevation mean = 2.070; high-elevation mean = 2.727) and CYP332A3 (c; low-elevation mean = 1.543; high-elevation mean = 1.354). One-tailed Student's t-tests revealed a marginally significant higher level of gene expression for UGT33A1 (p = 0.048), but no effect of elevation for CYP405A2 and CYP332A3. However, a more complete linear model showed that none of the genes displayed levels of expression related to elevation or to plant CNglc content (see text).
4. Discussion
Our study was performed in order to identify if high- and low-elevation populations are characterized by (i) differential phenotypic expression of defence compounds in L. corniculatus and (ii) differential gene expression in defence-associated genes in the specific phytophagous moth Z. filipendulae. In addition, we also tested whether gene expression in the moth was correlated with plant CNglc content. In accordance with the resource availability hypothesis [18], we found that high-elevation host plant populations of L. corniculatus produced higher levels of CNglcs compared with low-elevation populations. Secondly, we observed no correlation between the CNglc content of host plants and Z. filipendulae gene expression, and only a marginal effect of elevation on Z. filipendulae populations in the expression of one of the genes involved in CNglc production.
The higher production of CNglcs at high elevation may be linked to limitations on the resources and primary metabolism of plants; in such a situation, allocation to defences should be greater in low-resource (e.g. high elevation) habitats [26]. While, in general, the levels of plant defence compounds should be correlated with herbivore pressure [62,63], and several examples in the literature support this along elevation gradients, an increase in plant defences with elevation is not uncommon [23,24]. For instance, it was recently shown that within the genus Cardamine, high-elevation species constitutively produce more glucosinolates, while low-elevation species tend to rely on inducible defences after attack [64]. A potential alternative explanation for our findings is that in addition to providing defence, CNglcs may be involved in other metabolic pathways, such as nitrogen transport and carbon reserves [65,66]. This could result in greater accumulation at high elevation, due to the shorter developmental time that plant populations encounter there. Thus, variation in CNglc content might be uncoupled from levels of herbivory, and emerge as a consequence of other underlying factors, such as climate-driven physiological constraints.
Our second analysis did not show significant differences between low and high populations in the expression of three genes involved in the CNglc production of the moth (except for UGT33A1 in a simplified statistical framework, see below). The absence of an effect of elevation on the expression of the defence-associated genes could be viewed from the perspective of the plant–insect interaction: if the larvae obtain sufficient CNglcs from the plant—assuming that even if the CNglc content of the plant is lower at low elevation, the concentrations of such compounds are sufficiently high everywhere to fulfil the needs of the moth—there would be no reason to express these genes differently in contrasting environments. An important observation to corroborate our idea is that the larvae of Z. filipendulae prefer to feed on high-CNglc plants [47,67]. The pattern observed could also be explained by the disconnection that may occur between the phenotype and the expression of the genes related to this phenotype at a given moment. In this case, once a larva has sequestered or synthesized sufficient CNglcs, it may halt the transcription of genes associated with their production. Indeed, one could imagine that before being collected, the larvae had sequestered or produced enough CNglcs and stopped the transcription of genes associated with CNglc production, whereas its body CNglc concentration is actually high—this point may be particularly relevant given that moths were shown to prefer feeding on high-CNglc content plants, as sequestering defence compounds seems less costly than producing them de novo [67]. We could test for this hypothesis in future trials, by directly measuring the level of CNglcs in the larvae at the moment of collection. Nonetheless, when analysing CNglc data in a simplified statistical framework (i.e. with a one-tailed Student's t-test), the expression of UGT33A1 was found to be marginally higher at high versus low elevation (figure 2). Such marginally significant higher amounts of expression at high elevation may indicate, instead, that the optimal defence theory could also be at work here—i.e. as in other Zygaena species [68], eggs are laid in batches, making possible the application of the optimal defence theory when incorporating the concept of kin selection. However, one should note that UDP-glucose glycosyltransferase might also be involved in metabolic functions other than the production of defence compounds, as for instance in the regulation of endobiotics [49]. In plants, UDP-glucose glycosyltransferase has also shown to be involved in oxidative stress tolerance [69], a feature that, if it were also occurring in insects, could explain the higher levels of gene expression in moth specimens collected at higher elevations, where UV radiation may increase oxidative stress [70]. Unambiguously identifying whether or not UGT33A1 shows higher expression at higher elevations would anyway require an increased sample size, as our analyses are based on only 25 observations (13 and 12 at low and high elevation, respectively), meaning that our statistical power is limited. We cannot exclude the possibility that other abiotic factors, such as availability of resources, precipitation and radiation [15], or other molecular mechanisms such as priming [71,72], epigenetic modifications [73] or post-transcriptional effects [74,75] are influencing the expression of the genes involved in the production of CNglcs in Z. filipendulae. Finally, future research should also examine the effect of elevation on CNglc-associated gene expression in the plant, in order to gain a more complete picture of the ecological and evolutionary drivers in this plant–herbivore interaction.
Supplementary Material
Supplementary Material
Supplementary Material
Supplementary Material
Supplementary Material
Acknowledgements
We are grateful to Alejandra Ruales Falconí for her great help during sampling and to Mika Zagrobelny and all her team for granting information about the genetic basis of CNglcs in Z. filipendulae. Special thanks to the Lausanne Genomic Technologies Facility, which provided us with infrastructure, materials and laboratories, and to Russell Naisbit for correcting and editing the manuscript. Many thanks, also, to two anonymous reviewers and to the Centre Suisse de Cartographie de la Faune (CSCF), in particular, to Yannick Chittaro for providing information about the distribution of Z. filipendulae.
Ethics
None of the samples were collected from natural reserves, and only locations where Z. filipendulae was abundant were visited. This research was done in the context of the RechAlp platform (http://rechalp.unil.ch/).
Data accessibility
COI sequences are available as GenBank accessions KX773462-KX773490.
Authors' contributions
A.L.S., L.P., T.S. and N.A. designed the study. A.L.S. collected the samples. A.L.S., T.S. and A.-L.D. carried out the genetic analyses. A.L.S., L.P., A.-L.D. and N.A. analysed the data. A.L.S., L.P., S.R., A.-L.D. and N.A. drafted the manuscript. All authors read and approved the final manuscript.
Competing interests
None of the authors have competing interests.
Funding
This work was funded by a Swiss National Science Foundation grant (PP00P3_144870) awarded to N.A.
References
- 1.Reusch TB, Wood TE. 2007. Molecular ecology of global change. Mol. Ecol. 16, 3973–3992. (doi:10.1111/j.1365-294X.2007.03454.x) [DOI] [PubMed] [Google Scholar]
- 2.Theocharis A, Clément C, Barka EA. 2012. Physiological and molecular changes in plants grown at low temperatures. Planta 235, 1091–1105. (doi:10.1007/s00425-012-1641-y) [DOI] [PubMed] [Google Scholar]
- 3.Mayr E. 1954. Change of genetic environment and evolution. In Evolution as a process (eds Huxley J, Hardy AC, Ford EB), pp. 157–180. London, UK: Allen & Unwin. [Google Scholar]
- 4.Keller I, Alexander JM, Holderegger R, Edwards PJ. 2013. Widespread phenotypic and genetic divergence along altitudinal gradients in animals. J. Evol. Biol. 26, 2527–2543. (doi:10.1111/jeb.12255) [DOI] [PubMed] [Google Scholar]
- 5.Yakovlev IA, Asante DK, Fossdal CG, Junttila O, Johnsen Ø. 2011. Differential gene expression related to an epigenetic memory affecting climatic adaptation in Norway spruce. Plant Sci. 180, 132–139. (doi:10.1016/j.plantsci.2010.07.004) [DOI] [PubMed] [Google Scholar]
- 6.Sandve SR, Kosmala A, Rudi H, Fjellheim S, Rapacz M, Yamada T, Rognli OA. 2011. Molecular mechanisms underlying frost tolerance in perennial grasses adapted to cold climates. Plant Sci. 180, 69–77. (doi:10.1016/j.plantsci.2010.07.011) [DOI] [PubMed] [Google Scholar]
- 7.Sultan SE. 2007. Development in context: the timely emergence of eco-devo. Trends Ecol. Evol. 22, 575–582. (doi:10.1016/j.tree.2007.06.014) [DOI] [PubMed] [Google Scholar]
- 8.Whitman DW, Agrawal AA. 2009. What is phenotypic plasticity and why is it important? In Phenotypic plasticity of insects: mechanisms and consequences (eds Whitman DW, Ananthakrishna TN), pp. 1–63. Enfield, NH: Science Publishers, Inc. [Google Scholar]
- 9.Pfennig DW, Wund MA, Snell-Rood EC, Cruickshank T, Schlichting CD, Moczek AP. 2010. Phenotypic plasticity's impacts on diversification and speciation. Trends Ecol. Evol. 25, 459–467. (doi:10.1016/j.tree.2010.05.006) [DOI] [PubMed] [Google Scholar]
- 10.Appenzeller O, Minko T, Qualls C, Pozharov V, Gamboa J, Gamboa A, Wang Y. 2006. Gene expression, autonomic function and chronic hypoxia: lessons from the Andes. Clin. Auton. Res. 16, 217–222. (doi:10.1007/s10286-006-0338-3) [DOI] [PubMed] [Google Scholar]
- 11.Cheviron ZA, Whitehead A, Brumfield RT. 2008. Transcriptomic variation and plasticity in rufous-collared sparrows (Zonotrichia capensis) along an altitudinal gradient. Mol. Ecol. 17, 4556–4569. (doi:10.1111/j.1365-294X.2008.03942.x) [DOI] [PubMed] [Google Scholar]
- 12.Scott GR, Elogio TS, Lui MA, Storz JF, Cheviron ZA. 2015. Adaptive modifications of muscle phenotype in high-altitude deer mice are associated with evolved changes in gene regulation. Mol. Biol. Evol. 32, 1962–1976. (doi:10.1093/molbev/msv076) [DOI] [PMC free article] [PubMed] [Google Scholar]
- 13.McKay JK, Bishop JG, Lin JZ, Richards JH, Sala A, Mitchell-Olds T. 2001. Local adaptation across a climatic gradient despite small effective population size in the rare sapphire rockcress. Proc. R. Soc. Lond. B 268, 1715–1721. (doi:10.1098/rspb.2001.1715) [DOI] [PMC free article] [PubMed] [Google Scholar]
- 14.Anderson JT, Perera N, Chowdhury B, Mitchell-Olds T. 2015. Microgeographic patterns of genetic divergence and adaptation across environmental gradients in Boechera stricta (Brassicaceae). Am. Nat. 186, S60–S73. (doi:10.1086/682404) [DOI] [PMC free article] [PubMed] [Google Scholar]
- 15.Hodkinson ID. 2005. Terrestrial insects along elevation gradients: species and community responses to altitude. Biol. Rev. Camb. Philos. Soc. 80, 489–513. (doi:10.1017/S1464793105006767) [DOI] [PubMed] [Google Scholar]
- 16.Genung MA, Schweitzer JA, Ubeda F, Fitzpatrick BM, Pregitzer CC, Felker-Quinn E, Bailey JK. 2011. Genetic variation and community change–selection, evolution, and feedbacks. Funct. Ecol. 25, 408–419. (doi:10.1111/j.1365-2435.2010.01797.x) [Google Scholar]
- 17.McKey D. 1979. The distribution of secondary compounds within plants. In Herbivores: their interaction with secondary plant metabolites (eds Rosenthal GA, Janzen DH), pp. 56–134. Orlando, FL: Academic Press. [Google Scholar]
- 18.Coley PD, Bryant JP, Chapin FS III. 1985. Resource availability and plant antiherbivore defense. Science 230, 895–899. (doi:10.1126/science.230.4728.895) [DOI] [PubMed] [Google Scholar]
- 19.Herms DA, Mattson WJ. 1992. The dilemma of plants: to grow or defend. Q. Rev. Biol. 67, 283–335. (doi:10.1086/417659) [Google Scholar]
- 20.Boggs CL. 1992. Resource allocation: exploring connections between foraging and life history. Funct. Ecol. 6, 508–518. (doi:10.2307/2390047) [Google Scholar]
- 21.Liao W, Lu X. 2012. Adult body size = f (initial size + growth rate × age): explaining the proximate cause of Bergman's cline in a toad along altitudinal gradients. Evol. Ecol. 26, 579–590. (doi:10.1007/s10682-011-9501-y) [Google Scholar]
- 22.Vaupel A, Matthies D. 2012. Abundance, reproduction, and seed predation of an alpine plant decrease from the center toward the range limit. Ecology, 93, 2253–2262. (doi:10.1890/11-2026.1) [DOI] [PubMed] [Google Scholar]
- 23.Rasmann S, Pellissier L, Defossez E, Jactel H, Kunstler G. 2014. Climate-driven change in plant–insect interactions along elevation gradients. Funct. Ecol. 28, 46–54. (doi:10.1111/1365-2435.12135) [Google Scholar]
- 24.Rasmann S, Alvarez N, Pellissier L. 2014. The altitudinal niche breadth hypothesis in plant-insect interaction. In Insect-plant interactions. Annual plant reviews, vol. 47 (eds Voelckel C, Jander G), pp. 339–359. Oxford, UK: Wiley. [Google Scholar]
- 25.Pellissier L, Fiedler K, Ndribe C, Dubuis A, Pradervand JN, Guisan A, Rasmann S. 2012. Shifts in species richness, herbivore specialisation and plant resistance along elevation gradients. Ecol. Evol. 8, 1818–1825. (doi:10.1002/ece3.296) [DOI] [PMC free article] [PubMed] [Google Scholar]
- 26.Pellissier L, Roger A, Bilat J, Rasmann S. 2014. High elevation Plantago lanceolata plants are less resistant to herbivory than their low elevation conspecifics: is it just temperature? Ecography 37, 950–959. (doi:10.1111/ecog.00833) [Google Scholar]
- 27.Rodríguez-Castañeda G, Dyer LA, Brehm G, Connahs H, Forkner RE, Walla TR. 2010. Tropical forests are not flat: how mountains affect herbivore diversity. Ecol. Lett. 13, 1348–1357. (doi:10.1111/j.1461-0248.2010.01525.x) [DOI] [PubMed] [Google Scholar]
- 28.Rodríguez-Castañeda G, Brehm G, Fiedler K, Dyer LA. 2016. Ant predation on herbivores through a multitrophic lens: how effects of ants on plant herbivore defense and natural enemies vary along temperature gradients. Curr. Opin. Insect Sci. 14, 73–80. (doi:10.1016/j.cois.2016.02.001) [DOI] [PubMed] [Google Scholar]
- 29.Poulton JE. 1990. Cyanogenesis in plants. Plant Physiol. 94, 401–405. (doi:10.1104/pp.94.2.401) [DOI] [PMC free article] [PubMed] [Google Scholar]
- 30.Vetter J. 2000. Plant cyanogenic glycosides. Toxicon 38, 11–36. (doi:10.1016/S0041-0101(99)00128-2) [DOI] [PubMed] [Google Scholar]
- 31.Gleadow RM, Woodrow IE. 2002. Mini-review: constraints on effectiveness of cyanogenic glycosides in herbivore defense. J. Chem. Ecol. 28, 1301–1313. (doi:10.1023/A:1016298100201) [DOI] [PubMed] [Google Scholar]
- 32.Takos A, et al. 2010. Genetic screening identifies cyanogenesis-deficient mutants of Lotus japonicus and reveals enzymatic specificity in hydroxynitrile glucoside metabolism. Plant Cell 22, 1605–1619. (doi:10.1105/tpc.109.073502) [DOI] [PMC free article] [PubMed] [Google Scholar]
- 33.Witthohn K, Naumann CM. 1987. Cyanogenesis—a general phenomenon in the lepidoptera? J. Chem. Ecol. 13, 1789–1809. (doi:10.1007/BF01013229) [DOI] [PubMed] [Google Scholar]
- 34.Nahrstedt A. 1988. Cyanogenesis and the role of cyanogenic compounds in insects. Ciba Found. Symp. 140, 131–144. [DOI] [PubMed] [Google Scholar]
- 35.Nishida R. 2002. Sequestration of defensive substances from plants by Lepidoptera. Annu. Rev. Entomol. 47, 57–92. (doi:10.1146/annurev.ento.47.091201.145121) [DOI] [PubMed] [Google Scholar]
- 36.Zagrobelny M, Bak S, Rasmussen AV, Jørgensen B, Naumann CM, Møller BL. 2004. Cyanogenic glucosides and plant–insect interactions. Phytochemistry 65, 293–306. (doi:10.1016/j.phytochem.2003.10.016) [DOI] [PubMed] [Google Scholar]
- 37.Jensen NB, Zagrobelny M, Hjernø K, Olsen CE, Houghton-Larsen J, Borch J, Møller BL, Bak S. 2011. Convergent evolution in biosynthesis of cyanogenic defence compounds in plants and insects. Nat. Commun., 2, 273 (doi:10.1038/ncomms1271) [DOI] [PMC free article] [PubMed] [Google Scholar]
- 38.Zagrobelny M, Bak S, Møller BL. 2008. Cyanogenesis in plants and arthropods. Phytochemistry 69, 1457–1468. (doi:10.1016/j.phytochem.2008.02.019) [DOI] [PubMed] [Google Scholar]
- 39.Savela M.2016. Markku Savela's database on life forms http://www.nic.funet.fi/pub/sci/bio/life. (accessed 21 July 2016).
- 40.Geiger W. 1987. Les papillons de jour et leurs biotopes. Ligue Suisse pour la protection de la Nature, Bâle, Switzerland.
- 41.Lauber K, Wagner G, Gygax A, Eggenberg S, Michel A. 2001. Flora helvetica. Bern, Switzerland: Haupt.
- 42.Žikić V, Stanković SS, Petrović A, Ilić-Milošević M, Achterberg VK. 2013. Parasitoid complex of Zygaena filipendulae L. (Lepidoptera: Zygaenidae). Arch. Biol. Sci. 65, 1027–1035. (doi:10.2298/ABS1303027Z) [Google Scholar]
- 43.Jones DA, Turkington R. 1986. Lotus corniculatus L. J. Ecol. 74, 1185–1212. (doi:10.2307/2260243) [Google Scholar]
- 44.Zagrobelny M, Møller BL. 2011. Cyanogenic glucosides in the biological warfare between plants and insects: the Burnet moth-Birdsfoot trefoil model system. Phytochemistry 72, 1585–1592. (doi:10.1016/j.phytochem.2011.02.023) [DOI] [PubMed] [Google Scholar]
- 45.Zagrobelny M, Olsen CE, Pentzold S, Fürstenberg-Hägg J, Jørgensen K, Bak S, Møller BL, Motawia MS. 2014. Sequestration, tissue distribution and developmental transmission of cyanogenic glucosides in a specialist insect herbivore. Insect Biochem. Mol. Biol. 44, 44–53. (doi:10.1016/j.ibmb.2013.11.003) [DOI] [PubMed] [Google Scholar]
- 46.Fürstenberg-Hägg J, Zagrobelny M, Jørgensen K, Vogel H, Møller BL, Bak S. 2014. Chemical defense balanced by sequestration and de novo biosynthesis in a lepidopteran specialist. PLoS ONE 9, e108745 (doi:10.1371/journal.pone.0108745) [DOI] [PMC free article] [PubMed] [Google Scholar]
- 47.Zagrobelny M, Bak S, Ekstrøm CT, Olsen CE, Møller BL. 2007. The cyanogenic glucoside composition of Zygaena filipendulae (Lepidoptera: Zygaenidae) as effected by feeding on wild-type and transgenic lotus populations with variable cyanogenic glucoside profiles. Insect Biochem. Mol. Biol. 37, 10–18. (doi:10.1016/j.ibmb.2006.09.008) [DOI] [PubMed] [Google Scholar]
- 48.Zagrobelny M, Scheibye-Alsing K, Jensen NB, Møller BL, Gorodkin J, Bak S. 2009. 454 pyrosequencing based transcriptome analysis of Zygaena filipendulae with focus on genes involved in biosynthesis of cyanogenic glucosides. BMC Genomics 10, 574 (doi:10.1186/1471-2164-10-574) [DOI] [PMC free article] [PubMed] [Google Scholar]
- 49.Ahn SJ, Vogel H, Heckel DG. 2012. Comparative analysis of the UDP-glycosyltransferase multigene family in insects. Insect Biochem. Mol. Biol. 42, 133–147. (doi:10.1016/j.ibmb.2011.11.006) [DOI] [PubMed] [Google Scholar]
- 50.Chauhan R, Jones R, Wilkinson P, Pauchet Y. 2013. Cytochrome P450-encoding genes from the Heliconius genome as candidates for cyanogenesis. Insect Mol. Biol. 22, 532–540. (doi:10.1111/imb.12042) [DOI] [PubMed] [Google Scholar]
- 51.Paolucci P. 2013. Butterflies and burnets of the Alps, and their larvae, pupae and cocoons Verona, Italy: WBA Book. [Google Scholar]
- 52.Gleadow R, Bjarnholt N, Jørgensen K, Fox J, Miller R. 2011. Cyanogenic glycosides. In Research methods in plant sciences volume 1: soil allelochemicals (eds Narwal SS, Szajdak L, Sampietro DA), pp. 283–310. Houston, TX: Stadium Press LLC. [Google Scholar]
- 53.Schneider CA, Rasband WS, Eliceiri KW. 2012. NIH Image to ImageJ: 25 years of image analysis. Nat. Methods 9, 671–675. (doi:10.1038/nmeth.2089) [DOI] [PMC free article] [PubMed] [Google Scholar]
- 54.Simon C, Frati F, Beckenbach A, Crespi B, Liu H, Flook P. 1994. Evolution, weighting, and phylogenetic utility of mitochondrial gene sequences and a compilation of conserved polymerase chain reaction primers. Ann. Entomol. Soc. Am. 87, 651–701. (doi:10.1093/aesa/87.6.651) [Google Scholar]
- 55.Hall TA. 1999. BioEdit: a user-friendly biological sequence alignment editor and analysis program for Windows 95/98/NT. In Nucleic Acids Symp. Series 41, pp. 95–98. Oxford, UK: Oxford University Press..
- 56.Stamatakis A, Hoover P, Rougemont J. 2008. A rapid bootstrap algorithm for the RAxML web servers. Syst. Biol. 57, 758–771. (doi:10.1080/10635150802429642) [DOI] [PubMed] [Google Scholar]
- 57.Miller M, Pfeiffer W, Schwartz T. 2010. Creating the CIPRES Science Gateway for inference of large phylogenetic trees. In Gateway Computing Environments Workshop (GCE), pp. 1–8.
- 58.Fürstenberg-Hägg J, Zagrobelny M, Olsen CE, Jørgensen K, Møller BL, Bak S. 2014. Transcriptional regulation of de novo biosynthesis of cyanogenic glucosides throughout the life-cycle of the burnet moth Zygaena filipendulae (Lepidoptera). Insect Biochem. Mol. Biol. 49, 80–89. (doi:10.1016/j.ibmb.2014.04.001) [DOI] [PubMed] [Google Scholar]
- 59.Untergasser A, Cutcutache I, Koressaar T, Ye J, Faircloth BC, Remm M, Rozen SG. 2012. Primer3—new capabilities and interfaces. Nucleic Acids Res. 40, e115 (doi:10.1093/nar/gks596) [DOI] [PMC free article] [PubMed] [Google Scholar]
- 60.R Development Core Team. 2014. R. A language and environment for statistical computing. Vienna, Austria: R Foundation for Statistical Computing. [Google Scholar]
- 61.Bates D, Maechler M, Bolker B, Walker S. 2013. lme4: Linear mixed-effects models using Eigen and S4. R package version, 1.
- 62.Agrawal AA, Hastings AP, Johnson MTJ, Maron JL, Salminen J-P. 2012. Insect herbivores drive real-time ecological and evolutionary change in plant populations. Science 338, 113–116. (doi:10.1126/science.1225977) [DOI] [PubMed] [Google Scholar]
- 63.Züst T, Heichinger C, Grossniklaus U, Harrington R, Kliebenstein DJ, Turnbull LA. 2012. Natural enemies drive geographic variation in plant defenses. Science 338, 116–119. (doi:10.1126/science.1226397) [DOI] [PubMed] [Google Scholar]
- 64.Pellissier L, Moreira X, Danner H, Serrano M, Salamin N, van Dam NM, Rasmann S. 2016. The simultaneous inducibility of phytochemicals related to plant direct and indirect defences against herbivores is stronger at low elevation. J. Ecol. 104, 1116–1125. (doi:10.1111/1365-2745.12580) [Google Scholar]
- 65.Møller BL. 2010. Functional diversifications of cyanogenic glucosides. Curr. Opin. Plant Biol. 13, 337–346. (doi:10.1016/j.pbi.2010.01.009) [DOI] [PubMed] [Google Scholar]
- 66.Gleadow RM, Møller BL. 2014. Cyanogenic glycosides: synthesis, physiology, and phenotypic plasticity. Annu. Rev. Plant Biol. 65, 155–185. (doi:10.1146/annurev-arplant-050213-040027) [DOI] [PubMed] [Google Scholar]
- 67.Pentzold S, Zagrobelny M, Rook F, Bak S. 2014. How insects overcome two-component plant chemical defence: plant β-glucosidases as the main target for herbivore adaptation. Biol. Rev. 89, 531–551. (doi:10.1111/brv.12066) [DOI] [PubMed] [Google Scholar]
- 68.Hofmann A, Kia-Hofmann T. 2011. Ovipositing, egg-batch formation and embryonic development in burnet moths (Zygaena Fabricius, 1775) (Lepidoptera: Zygaenidae). Entomol. Gaz. 62, 35–68. [Google Scholar]
- 69.Ahrazem O, Rubio-Moraga A, Trapero-Mozos A, Climent MFL, Gómez-Cadenas A, Gómez-Gómez L. 2015. Ectopic expression of a stress-inducible glycosyltransferase from saffron enhances salt and oxidative stress tolerance in Arabidopsis while alters anchor root formation. Plant Sci. 234, 60–73. (doi:10.1016/j.plantsci.2015.02.004) [DOI] [PubMed] [Google Scholar]
- 70.Meng JY, Zhang CY, Zhu F, Wang XP, Lei CL. 2009. Ultraviolet light-induced oxidative stress: effects on antioxidant response of Helicoverpa armigera adults. J. Insect Physiol. 55, 588–592. (doi:10.1016/j.jinsphys.2009.03.003) [DOI] [PubMed] [Google Scholar]
- 71.van Hulten M, Pelser M, Van Loon LC, Pieterse CM, Ton J. 2006. Costs and benefits of priming for defense in Arabidopsis. Proc. Natl Acad. Sci. USA 103, 5602–5607. (doi:10.1073/pnas.0510213103) [DOI] [PMC free article] [PubMed] [Google Scholar]
- 72.Ahmad S, Gordon-Weeks R, Pickett J, Ton J. 2010. Natural variation in priming of basal resistance: from evolutionary origin to agricultural exploitation. Mol. Plant Pathol. 11, 817–827. (doi:10.1111/j.1364-3703.2010.00645.x) [DOI] [PMC free article] [PubMed] [Google Scholar]
- 73.Rasmann S, De Vos M, Casteel CL, Tian D, Halitschke R, Sun JY, Agrawal AA, Felton GW, Jander G. 2012. Herbivory in the previous generation primes plants for enhanced insect resistance. Plant Physiol. 158, 854–863. (doi:10.1104/pp.111.187831) [DOI] [PMC free article] [PubMed] [Google Scholar]
- 74.Gfeller A, Baerenfaller K, Loscos J, Chételat A, Baginsky S, Farmer EE. 2011. Jasmonate controls polypeptide patterning in undamaged tissue in wounded Arabidopsis leaves. Plant Physiol. 156, 1797–1807. (doi:10.1104/pp.111.181008) [DOI] [PMC free article] [PubMed] [Google Scholar]
- 75.Savchenko T, Pearse IS, Ignatia L, Karban R, Dehesh K. 2013. Insect herbivores selectively suppress the HPL branch of the oxylipin pathway in host plants. Plant J. 73, 653–662. (doi:10.1111/tpj.12064) [DOI] [PubMed] [Google Scholar]
Associated Data
This section collects any data citations, data availability statements, or supplementary materials included in this article.
Supplementary Materials
Data Availability Statement
COI sequences are available as GenBank accessions KX773462-KX773490.