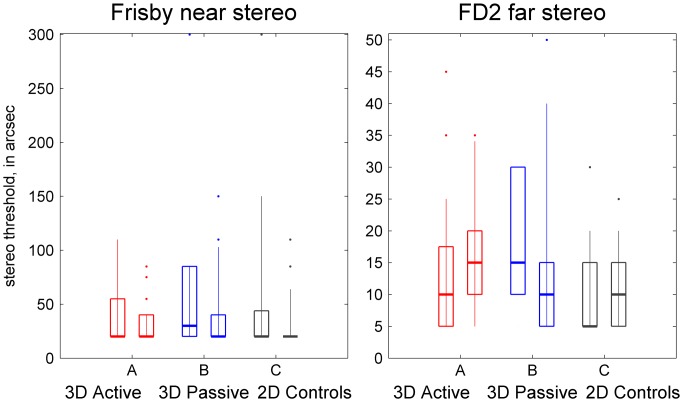
Figure 4.
Changes in stereoacuity.
Notes: Box-and-whisker plots of stereo thresholds measured with the Frisby and FD2 tests, for the three different TV-groups before (left box in each pair) and after (right boxes) the 8-week study. A higher threshold indicates worse stereo vision. Symbols and error bars as in Figure 2. Outlier dots do not show five stereonegative participants.

