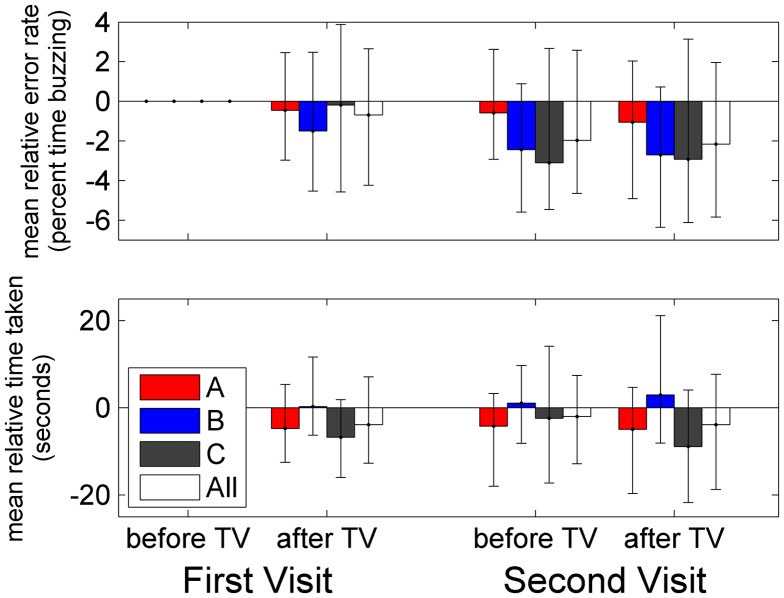
Figure 6.
Visuomotor coordination.
Notes: How performance on the coordination task varied on the four occasions of testing, i.e. before and after viewing a movie on TV, on the first visit and on a second visit after having had a new TV for around 2 months. Performance is assessed with two metrics, corresponding to accuracy and speed: (A) error rate, i.e. percentage of this time spent with the loop in contact with the track, and (B) time taken to complete the task. Both metrics are shown relative to performance the first time it was measured; the ‘First Visit, before TV’ results are therefore zero by definition for all groups. Results are shown only for the 83/116 participants who completed the same track on all four occasions. Coloured bars show results for the different TV-groups; white bars show results for all 83 participants. Height of bars show mean change in metric averaged across participants; error-bars run from the 16th to the 84th percentile.

