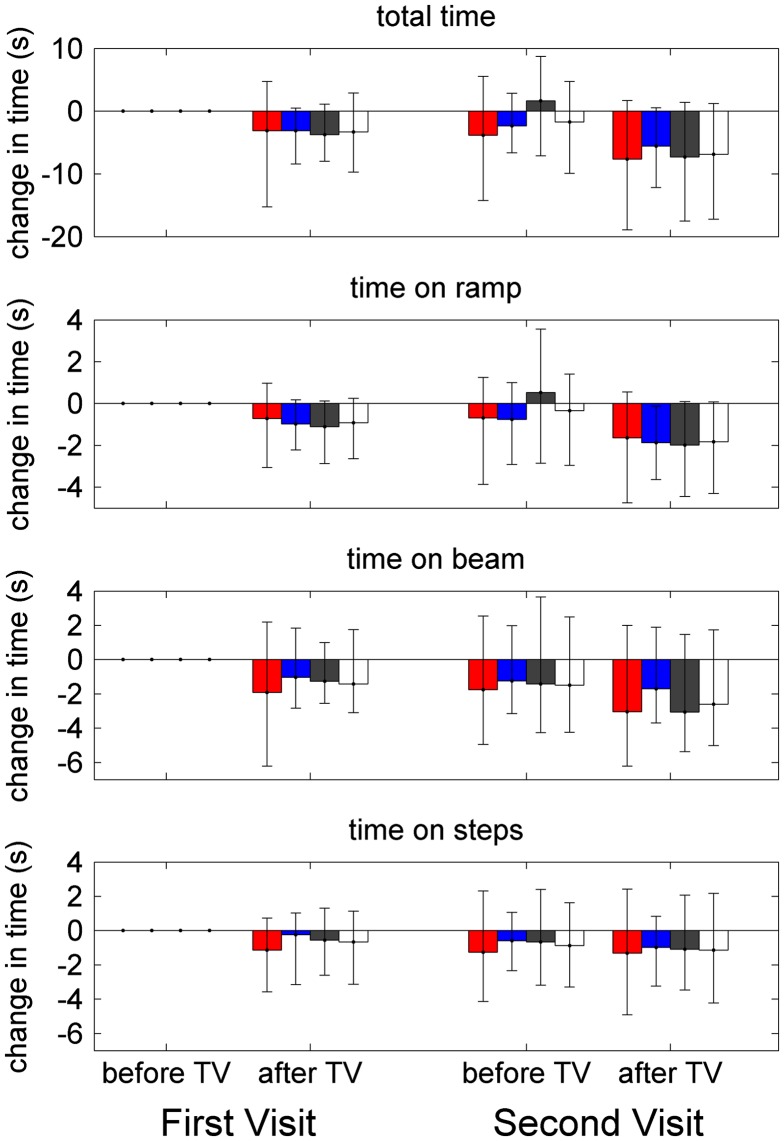
Figure 7.
Balance and postural stability.
Notes: How time taken on the balance task varied on the four occasions of testing. Coloured bars show results for the different TV-groups; white bars show results for all participants. Not all data were collected on all occasions for all participants, so N varies slightly between the plots. Data are available for between 107 and 112 participants depending on task/session (40–41 A-group, 36–38 B-group, 31–33 C-group). Height of bars shows mean change in time taken, averaged across participants; error bars run from the 16th to the 84th percentile. As before, data are shown relative to time on First Visit, before TV; these points are therefore zero by definition.

