

Abstract
In this review, the authors provide an approach to the study of health disparities in the US Latino population and evaluate the evidence, using mortality rates for discrete medical conditions and the total US population as a standard for comparison. They examine the demographic structure of the Latino population and how nativity, age, income, and education are related to observed patterns of health and mortality. A key issue discussed is how to interpret the superior mortality indices of Latino immigrants and the subsequent declining health status of later generations. Explanations for differences in mortality include selection, reverse selection, death record inconsistencies, inequalities in health status, transnational migration, social marginality, and adaptation to environmental conditions in the United States. The utility of the public health social inequality framework and the status syndrome for explaining Latino disparities is discussed. The authors examine excess mortality from 8 causes: diabetes, stomach cancer, liver cancer, cervical cancer, human immunodeficiency virus/acquired immunodeficiency syndrome, liver disease, homicide, and work-related injuries. The impact of intergenerational changes in health behavior within the Latino population and the contributory role of suboptimal health care are interpreted in the context of implications for future research, public health programs, and policies.
Keywords: health status disparities, Hispanic Americans, mortality, public health
INTRODUCTION
Overview of approach
In this review, we examine health disparities affecting the US Latino population. In conducting this review, we relied on the World Health Organization definition of disparities: “differences in health which are not only unnecessary and avoidable but, in addition, are considered unfair and unjust” (1, p. 7). The reasoning guiding our approach is briefly reviewed below and elaborated on throughout this review. We focus our analysis on medical conditions for which determinants are attributable to sustained social and economic marginality, and for which associated lifestyle adaptations and environmental exposures lead to accelerating mortality rates in postimmigrant generations of Latinos. The evidence of an increasing morbidity and mortality burden among US-born Latinos compared with foreign-born Latinos is overwhelming (2, 3). The primary differences in health status between the 2 Latino nativity groups have been attributed to systematic variations in social resources, socialization, and formative human experiences over the life course (3–13).
Today’s epidemiologic studies are inadequately designed to contend with the chain of multicausality and time-ordered relations that result in multidimensional correlation of micro- and macro-level causal factors (14). As Kaufman and Cooper have observed, social determinants are broadly linked to 3 domains of race, sex, and class, “reflecting the complex pathways through which they are thought to affect or determine exposures, behaviors, physical constitution, and other direct or contributory causes of disease” (15, pp. 113–114). Thus, we make no pretense that we can demonstrate causality from existing epidemiologic evidence. Rather, we apply deterministic reasoning to the state of knowledge regarding effects of social inequality and marginality on the health and mortality of Latinos to explain the population disparities identified in this review.
The primary method of deterministic analysis in epidemiology is to present evidence that specific exposures cause differences in health outcomes net of confounders. In the instance of Latino population health, there are 3 assumptions that support the causal role of social determinants in Latino morbidity and mortality disparities. First, there is no viable evidence to support an explanation of genetic determinants of differential morbidity and mortality outcomes by nativity in this population. Second, socioeconomic effects on population mortality cannot be demonstrated, because Latino immigrants have lower income and educational statuses yet experience superior mortality outcomes compared with wealthier and better-educated US-born Latinos (16–18). Third, the immigrant population is least likely to receive preventive health care, to have a usual source of health care, or to receive guideline-based health care (19). Good health in the context of marginal health-care access, as observed among immigrant Latinos, is instructive because it underscores how health care alone is not a preponderant determinant of population health and mortality. Nevertheless, poor access to health care can be a primary factor in mortality for immigrants when it results in inadequate disease detection or management (19).
We have selected causes of Latino population mortality in this review which we define as inequitable because their rates surpass normative mortality rates for the United States. Their root causes are embedded in minority status (e.g., socioeconomic status (SES), ethnicity, and sex) and include inadequate access to health care and poor screening rates, greater exposure to multiple lifestyle factors negatively affecting health behaviors, greater occupational hazards, higher rates of cumulative adversity, and exposure to adverse residential-environmental conditions over the life course. We believe this is a reasonable and conservative approach because the Latino population is a component of the US population reference group. We do not compare Latino disparities with those of other minority groups in this review because our conceptual approach was not designed for that purpose and space limitations were a constraint.
What is the state of health in the Latino population?
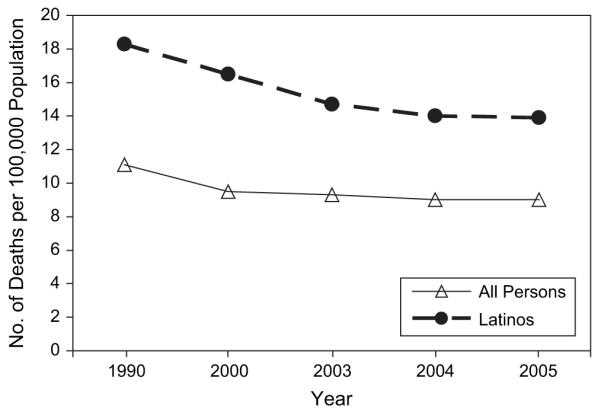
Today, over one-half of the US Latino population of nearly 45 million is comprised of immigrants, and most national health indices suggest that they are healthier than native-born Americans, including Latino Americans (2, 3). Death rates have decreased for the US population as a whole, and as Figure 1 shows (20), all-cause mortality for Latinos is lower than that for the US population (21). Nevertheless, there are several examples of excess mortality identified in this paper, and various contentions are examined regarding potential sources of error in mortality estimates (3). However, the most interesting story resides in the reasons for this enigmatic mortality profile and the reality that Latino population health is not static and is continually being reshaped by demography, secular trends in disease, and social forces (22).
Figure 1.
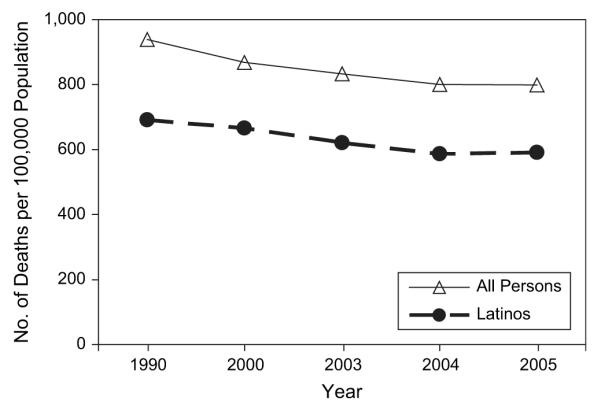
Age-adjusted rates of death from all causes for all persons and for Latinos, United States, selected years between 1990 and 2005. Data were obtained from the National Center for Health Statistics (20).
Demographic structure of the Latino population
When addressing population health, explanations for variation begin with demographic factors, because the structure of populations is a powerful determinant of health conditions. The Latino population is no exception. The high rate of population expansion among Latinos is due primarily to fertility and secondarily to immigration. In 1980, Latinos comprised only 5.4% of the US population; in 1990, they comprised 9.0%, in 2000 12.5%, in 2006 14.7%, and at this writing they comprise over 15%. This trend is even more pronounced for children and adolescents (23). It is expected that the Latino population will expand by 113% from 2000 to 2025 and by 273% from 2000 to 2050 (24, 25). As Table 1 shows (26), the number of first-generation Lationos (i.e., immigrants) is greater than the number of each subsequent generation of Latinos and is approximately the same as the number of all other first-generation US ethnic groups combined.
Table 1.
Population of the United States by Immigrant Generation and Self-Reported Race and Hispanic Origina, 2004–2008b
| Immigrant Generationc |
Total | % First-Generationd | |||
|---|---|---|---|---|---|
| First | Second | Third and Beyond | |||
| Race/ethnicity | |||||
| Hispanic | 19,021,000 | 9,484,000 | 14,757,000 | 43,263,000 | 44 |
| Mexican | 11,404,000 | 6,417,000 | 10,569,000 | 28,390,000 | 40 |
| Puerto Ricane | 1,347,000 | 858,000 | 1,611,000 | 3,816,000 | 35 |
| Cuban | 997,000 | 327,000 | 280,000 | 1,604,000 | 62 |
| Central/South American | 4,968,000 | 1,629,000 | 793,000 | 7,390,000 | 67 |
| Other | 305,000 | 254,000 | 1,505,000 | 2,063,000 | 15 |
| Non-Hispanic | |||||
| White | 9,067,000 | 5,179,000 | 181,582,000 | 195,827,000 | 5 |
| Black | 2,795,000 | 1,103,000 | 31,759,000 | 35,656,000 | 8 |
| Asian | 8,405,000 | 2,889,000 | 1,163,000 | 12,457,000 | 67 |
| Native American or Hawaiian/Pacific Islanderf |
370,000 | 139,000 | 4,358,000 | 4,867,000 | 8 |
| ≥2 races | 135,000 | 43,000 | 1,593,000 | 1,772,000 | 8 |
| Total for United States | 39,793,000 | 18,837,000 | 235,212,000 | 293,842,000 | 14 |
Based on self-reported responses to Current Population Survey questions on “race” and “Hispanic origin.” Population counts are averages for 2004–2008.
Source: merged data from the annual demographic files (March) of the Current Population Survey, 2004–2008 (26).
Immigrant generations were defined as follows: “first generation” = foreign-born; “second generation” = US-born with 1 or 2 foreign-born parents; “third and beyond” = US-born of US-born parents.
Percentage of total that was first-generation.
Persons born in Puerto Rico are US citizens; “first” and “second” generations refer to island birthplace versus mainland birthplace of oneself or one’s parents.
Includes persons of races mixed with Native Americans and Hawaiians/Pacific Islanders.
The fact that Latinos are disproportionately of immigrant background improves their population health profile, as does their relatively low median age of 28 years in 2007 (27). Almost two-thirds of the US Latino population is of Mexican origin—7 times more numerous than the next-largest Latino subgroup, Puerto Ricans (27). As Table 2 shows (26), this is a very youthful population, with over 11 million children aged 12 years or younger. By comparison, there are only about 5 million people aged 55 years or older, presenting a sharp contrast with the aging US population. As can be seen in Table 2, most first-generation immigrants are middle-aged (age 35 years) or older, and they outnumber US-born Latinos by approximately 2:1 in this age range. Almost three-fourths of US Latinos are adult immigrants and firstand second-generation children of immigrants (28).
Table 2.
Percentage of First-Generation Immigrants in the US Latino Population by Age Group and Hispanic Origin, 2004–2008a,b
| National Origin and Generation |
Age Group, years |
|||||||||||||
|---|---|---|---|---|---|---|---|---|---|---|---|---|---|---|
| 0–5 (Early Childhood) |
6–12 (Middle Childhood) |
13–17 (Adolescence) |
18–24 (Adult Transition) |
25–34 (Early Adulthood) |
35–54 (Middle Adulthood) |
≥55 (Late Adulthood) |
||||||||
| No. | % | No. | % | No. | % | No. | % | No. | % | No. | % | No. | % | |
| Mexican | ||||||||||||||
| First generation | 190,000 | 5 | 499,000 | 13 | 509,000 | 20 | 1,501,000 | 45 | 3,246,000 | 61 | 4,195,000 | 62 | 1,263,000 | 48 |
| Second generation and beyond |
3,789,000 | 3,393,000 | 2,000,000 | 1,860,000 | 2,064,000 | 2,522,000 | 1,357,000 | |||||||
| Puerto Ricanc | ||||||||||||||
| First generation | 22,000 | 6 | 64,000 | 12 | 66,000 | 18 | 87,000 | 21 | 202,000 | 34 | 466,000 | 48 | 439,000 | 82 |
| Second generation and beyond |
382,000 | 454,000 | 308,000 | 320,000 | 394,000 | 511,000 | 99,000 | |||||||
| Cuban | ||||||||||||||
| First generation | 7,000 | 5 | 21,000 | 16 | 25,000 | 25 | 35,000 | 30 | 109,000 | 54 | 365,000 | 78 | 434,000 | 96 |
| Second generation and beyond |
126,000 | 110,000 | 75,000 | 80,000 | 93,000 | 104,000 | 20,000 | |||||||
| Central/South American | ||||||||||||||
| First generation | 55,000 | 8 | 158,000 | 21 | 216,000 | 37 | 555,000 | 63 | 1,203,000 | 84 | 2,004,000 | 92 | 775,000 | 95 |
| Second generation and beyond |
676,000 | 614,000 | 366,000 | 320,000 | 235,000 | 169,000 | 42,000 | |||||||
| Other | ||||||||||||||
| First generation | 3,000 | 1 | 10,000 | 4 | 13,000 | 7 | 27,000 | 12 | 71,000 | 25 | 114,000 | 21 | 66,000 | 18 |
| Second generation and beyond |
228,000 | 243,000 | 162,000 | 194,000 | 211,000 | 424,000 | 295,000 | |||||||
| All Hispanics | ||||||||||||||
| First generation | 278,000 | 5 | 753,000 | 14 | 830,000 | 22 | 2,207,000 | 44 | 4,833,000 | 62 | 7,143,000 | 66 | 2,977,000 | 62 |
| Second generation and beyond |
5,201,000 | 4,814,000 | 2,911,000 | 2,774,000 | 2,998,000 | 3,730,000 | 1,813,000 | |||||||
Population counts are averages for 2004–2008. Percentages given are the percentage of the first-generation total for each age category.
Source: merged data from the annual demographic files (March) of the Current Population Survey, 2004–2008 (26).
Persons born in Puerto Rico are US citizens; “first” generation refers to island birthplace versus mainland birthplace.
There is disproportionate poverty in the Latino population, with 22% living below the poverty line in 2006 as compared with 10% of white non-Latinos (29). Latinos have lower rates of health insurance than other ethnic groups; 40% of Mexicans and Mexican Americans, 26% of Cubans, and 21% of Puerto Ricans were uninsured in 2006 as compared with 16% of white non-Latinos (30). This is an especially pronounced problem among immigrants, because they are less likely to be eligible for public insurance.
Another important factor in understanding Latino population health is the phenotypic variance in the Latino population, which has implications for demographic data such as US Census data. Latinos as an ethnic group may be counted as part of any “race.” Subgroups such as Mexicans, Puerto Ricans, and Cubans have significant genetic heterogeneity, with origins in continents outside the Americas, especially Europe and Africa, and differential levels of admixture with Amerindian populations (31). Latinos are the ethnic group most likely to identify themselves as mixed-race in the US Census, with 31% reporting being of 2 or more races in the 2000 Census (29). This population heterogeneity poses challenges for genomic and genetic health studies of nationalities with diverse migration and resettlement histories. There are also phenotypic implications for research on skin color and self-identification that underlie social determinants, as well as genotypic variation linked to disease susceptibility, that are being examined in contemporary research (32, 33).
Social structure, social adaptation, and genomic influences on Latino health
Current life expectancy at birth in Mexico is 76 years; in Puerto Rico it is 78 years; and in Cuba it is 77 years. US life expectancy is 78 years (34). For Latinos in the United States, life expectancy at birth is approximately 82 years. Thus, differences in life expectancy across these national populations are marginal despite vast differences in wealth and demographic structure. Latino immigrants have superior longevity, with death rates falling over a 15-year period between 1990 and 2005 for both Latinos and non-Latinos in a uniform trend (20, 35, 36).
Controversies in estimating Latino population disparities
Latino immigrants may gain some health advantage because they are generally healthy when they arrive in the United States, and US society provides a general improvement, albeit inconsistently, in standards of living, nutrition, and public health conditions. Some researchers have concluded that selection effects also contribute to this resilient immigrant profile (4). There is self-report evidence that the most recent immigrant generation is healthier than previous generations of immigrants (5). However, the selection explanation has strong contrary evidence, including a recent study that found moderate-to-strong selection effects (based on self-reported health status) in some immigrant groups but no positive selection effects for Mexican-origin immigrants (6).
There is evidence of reverse selection whereby the healthiest Latinos may remain in the United States while the less healthy return to their nations of origin. Presumably the return emigrants are at greater risk of death than the foreign-born Latinos who remain in the United States. Past research confirmed a “salmon bias” of return migration that could explain some, but not all, of the Latino all-cause mortality advantages reported in national health surveys, primarily because rates of return before death were too low to explain mortality differences (7–9).
A final explanation for the superior mortality of Latino immigrants is a technical one, having to do with misclassification of surnames and ethnicity/nationality of origin on death certificates, resulting in systematic omission (estimated at 15%–20%) of Latino deaths (10). The underascertainment is possibly accentuated at older ages (11). However, 2 national surveys using linked data files have corrected for this misclassification, and the Hispanic mortality advantage remained (8, 12, 13).
These 3 explanations provide alternative ways of interpreting the superior health of immigrants. However, neither singly nor collectively do they provide adequate explanations for a wide range of consistent findings showing markedly better immigrant morbidity profiles, a trend toward a “normalizing” of morbidity and mortality patterns to US norms in the second and subsequent generations of Latinos born in the United States, and the development of excess mortality in specific disease categories (8, 37–40). To sort out these and similar questions requires knowing much more than we know at present about Latino life-course epidemiologic factors in both sending and receiving nations. Transdisciplinary research is needed to investigate mechanisms that increase risk behaviors among Latino youth in US environments (41, 42). This subgroup of US youth, formed partly by children arriving in early childhood and partly by children born in the United States to foreign-born parents, constitutes the heart of the demographic transition. They represent the tip of emergent health disparities in the Latino population that will be largely determined by differential environmental exposures and the intergenerational social stratification patterns of US society (43).
Are inequality models useful for explaining Latino health disparities?
Social position and SES are overriding social determinants producing unequal health, an explanation known as the status syndrome (44, 45). Social determinants such as poverty, menial and unstable employment, living in caustic environments, and confronting trauma and persistent social stressors compromise people’s autonomy and affect their lifestyles, health status, and mortality (46). Early and prolonged adverse exposures can precipitate high allostatic loads (47). Marmot (48) believes it is not social position per se that is the critical determinant; rather, persons exposed to these conditions are prone to low social participation and have a weak sense of control over macro- and micro-level social conditions affecting them. He has postulated a mechanism by which social position acts on disease pathways at a population level (48). The hypothalamic-pituitary-adrenal axis produces hormonal and metabolic dysregulation and vascular abnormalities. Resulting effects include higher rates of obesity and metabolic syndrome (49) and ultimately systematic mortality differences (50). This pattern is especially salient in developed societies with the greatest income inequalities (51).
Cooper (52) has postulated that social adaptation caused by human migration can trigger selective gene–environment adaptive responses that increase disease liability. There are multiple pathways for preexisting genotypes, which are latent in the societies of origin, to be transformed as pathologic. Potentially, these disease phenotypes are expressed through main effects of genes, and others are expressed through gene alteration after exposure to a new environmental context. These processes are more likely to occur progressively in our view, primarily in the US-born second or subsequent generations, who experience extended exposure to environmental and social behavioral factors that were not present in the nation of origin. This process of selective response to environmental exposures is referred to as context dependence and applies to infectious agents, toxins, and health behaviors, and potentially their interactions (52–54). A health behavior example is smoking, which increases markedly in the United States for Latinos and results in higher (age-adjusted) rates of lung cancer death in the United States as compared with Mexico (US Latinos: 36.6 per 100,000 in men and 14.7 per 100,000 in women; Mexicans: 13.2 per 100,000 in men and 5.4 per 100,000 in women). Lung cancer will disproportionately affect persons genetically predisposed to both nicotine addiction and lung cancer (55). It is illustrative that rates of tobacco dependence increase much more rapidly for US Latino women than for men in comparison with the foreign-born of both sexes (56).
There are also problems in applying causal models of social factors and social position to Latinos because of potential intergenerational variability in appraisal and social adjustment processes. Immigrants may use very different standards for self-evaluation of their personal situation in the United States. Autonomy, personal control, and quality of life for Latino immigrants are logically based on normative expectations rooted in early life socialization in their nations of origin. Many immigrants perceive themselves as sojourners, even as they become long-term residents with the passage of time. The aversive impact of minority status on health in the United States appears to differ between foreign- and US-born groups, and differences in the protective utility of social support resources may also contribute directly and indirectly to disease outcomes. An implication is that causal frameworks based on inequality may be better suited to explain patterns in US-born Latinos and Latinos who immigrated to the United States during childhood. A gradient effect of SES on the health of Latino adolescents, similar to that observed in other ethnic groups, has been reported in recent research (57).
Latino population health disparities
We turn our attention to identifying health disparities defined as prominent health problems responsible for Latino excess mortality in comparison with US national rates per 100,000 population. While acknowledging that other major health problems exist for Latinos—including cardiovascular disease, which is a primary cause of death but does not qualify as showing excess mortality by the definition used—we have not included them in this review. Our review method consisted of conducting electronic Medline (National Library of Medicine) and Google (Google Inc., Mountain View, California) searches scanning approximately 2,000 articles, including only those published between 1985 and 2009, and selectively reviewing them. Key terms used included “Latino,” “Hispanic,” “Latina,” and “disparities,” in combination with a wide range of diseases and medical conditions. We also examined the reference lists of all articles reviewed to obtain more information in areas of interest. To determine whether additional and recent material existed, we contacted staff of the Centers for Disease Control and Prevention, and they provided us with a list of Web sites which proved fruitful as primary sources. For mortality information, we relied on the relatively few national data sets that contain sufficient time-ordered information to plot longitudinal patterns comparing Latinos with non-Latinos. Very few national or regional data on Latino morbidity and mortality patterns were available before 1980, and even after that time, information about immigrants was inconsistently collected because of Spanish-language exclusions and other problems (58).
We highlight several categories of excess mortality below, and their relative mortality burden is displayed in Table 3 (20, 59). Diabetes mellitus constituted the greatest burden of mortality disparities (as defined in this review) for Latinos in the United States. Also included in the review was homicide among younger men, work-related injuries, human immunodeficiency virus (HIV), liver disease (including liver cirrhosis), and specific types of digestive system cancers, including cervical, stomach, and liver cancer. Table 3 summarizes current rates for prominent causes of death that we define as showing disparities.
Table 3.
Age-Adjusted Rates of US Mortality Per 100,000 Population From All Causes and Causes for Which There Was a Prominent Disparity for Latinos Versus All Persons in 2005a
| Cause of Mortality | Latinos | All Persons |
|---|---|---|
| All causes | 590.7 | 798.8 |
| Causes with a prominent disparity | ||
| Diabetes mellitus | 33.6 | 24.6 |
| Stomach cancer | 13.6b | 8.6b |
| Liver cancer | 16.2b | 10.4b |
| Cervical cancer | 3.2b | 2.5b |
| Human immunodeficiency virus | 4.7 | 4.2 |
| Liver disease | 13.9 | 9.0 |
| Homicide | 7.5 | 6.1 |
| Work-related injury | 4.9 | 4.0 |
SELECTED MORTALITY RATES FOR DISPARITIES IN US LATINOS
Diabetes mellitus
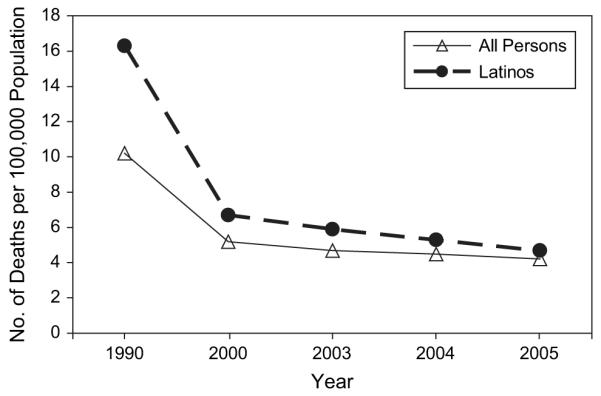
Latinos experience greater disparities in risk for diabetes (60). Rates of death due to diabetes increased in the 1990s and then decreased slightly until 2006 (Figure 2) (20, 61). The national mortality data are not concurrently disaggregated by race and age. However, in 2006, 33.3 Latino deaths per 100,000 population were attributable to diabetes as compared with 24.6 deaths per 100,000 in the general population. In 2006, 9.9% of Latino men had diabetes compared with 8.0% of all men. Similarly, in 2006, 10.8% of Latinas had diabetes compared with 7.5% of all women. Diabetes morbidity has increased across the years, with diabetes among Latinos increasing at greater rates. There is support for an association between duration of residence in the United States among immigrants and increased rates of diabetes (62). Latinos who have lived in the United States longer are shown to have higher (adjusted) rates and incidences of obesity. This demonstrates that greater exposure to US society can play a role in the development of obesity and ultimately contributes to higher risk of diabetes (63).
Figure 2.
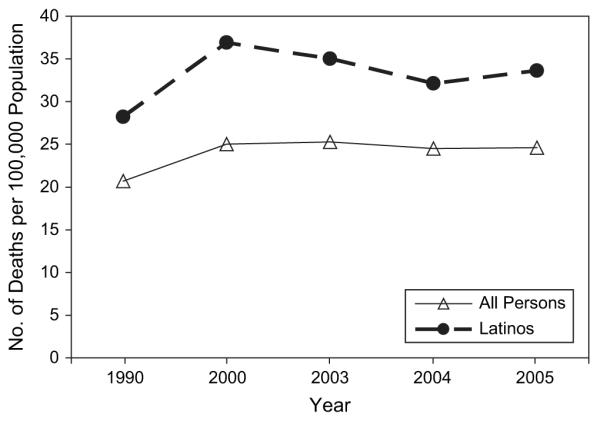
Age-adjusted rates of death from diabetes mellitus for all persons and for Latinos, United States, selected years between 1990 and 2005. Data were obtained from the National Center for Health Statistics (20).
Cancer
Although overall cancer rates are not elevated among Latinos, there are specific examples of disparities in cervical, liver, and stomach cancer (64). While cervical cancer mortality (but not morbidity) is elevated for women in national data (Figure 3) (59), these differences have not been reported in smaller studies—a discrepancy that may be due to regional differences in screening rates (64, 65). Late-stage detection of cervical cancer is probably caused by lower screening rates (66, 67). Language barriers, high levels of poverty, and lack of health insurance are all barriers to care that have been cited in previous research (68). Of note are higher rates of cervical cancer mortality among foreign-born Latinas compared with US-born Latinas, which poses a countertrend to lower morality among the foreign-born in other examples of mortality disparities (69). Male excess mortality for cancer is primarily concentrated in liver and stomach cancers (Figure 4) (59). It is unclear to what extent the liver cancer rates are related to alcoholism and other disease complications stemming from alcoholism, including excess liver cirrhosis (discussed below). These rates are consistent with previous reports for gastric cancer (70), liver cancer (71), and cervical cancer (72).
Figure 3.
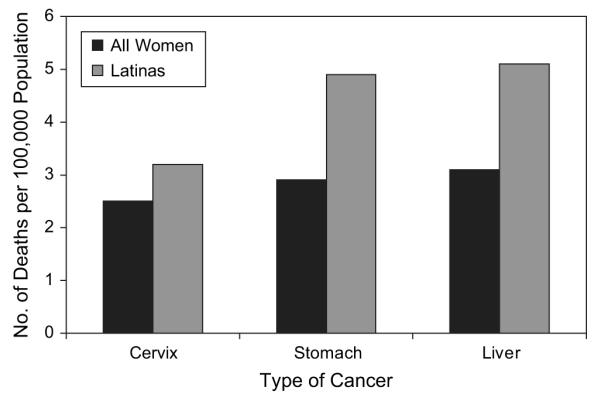
Age-adjusted rates of death from selected cancers for all women and for Latinas, United States, 2001–2005. Data were obtained from the US Cancer Statistics Working Group (59).
Figure 4.
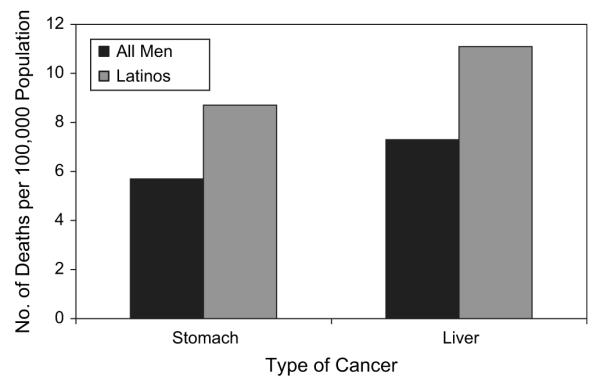
Age-adjusted rates of death from selected cancers for all men and for male Latinos, United States, 2001–2005. Data were obtained from the US Cancer Statistics Working Group (59).
More socially assimilated Latinos may have superior health literacy and health-care resources and as a result may be more likely to know about cancer screening and more activated in seeking screening (73). In many studies, immigrant Latinos are not equally aware of the resources available to them. One study found that only 37% of Latino participants knew about free cancer screening programs, despite the 85% who reported an interest in increasing their knowledge of cancer (74). There also seem to be discrepancies between perceived cancer risk in Latinos and low adherence to screening and prevention measures (75).
Liver disease
Although national data indicate that rates of alcohol-related disorders are not higher among Latinos than in the white non-Latino population (76), there are disparities in the mortality due to chronic liver disease and cirrhosis (Figure 5) (20). While 13.9 per 100,000 Latinos died from liver disease in 2005, only 9 out of 100,000 persons in the general US population died from these diseases (61). There are several hypotheses for the elevated mortality due to liver disease. There is a subgroup of Latino men who are binge drinkers, and US-born Latinos are more likely to be daily drinkers (77). In addition, other disparities may be cofactors in elevated levels of nonalcoholic fatty liver disease (78–81). Latinos also appear to have higher levels of hepatitis C virus infection, which thereby acts as a cofactor in liver disease (82).
Figure 5.
Age-adjusted rates of death from chronic liver disease for all persons and for Latinos, United States, selected years between 1990 and 2005. Data were obtained from the National Center for Health Statistics (20).
Human immunodeficiency virus
Among the narrowing disparities in causes of death for Latinos is HIV mortality. Despite narrowing HIV disparities, HIV is the fourth-leading cause of death for Latinos between the ages of 35 and 44 years and is among the top 10 causes of death for Latinos aged 15–54 years (83). Puerto Ricans account for the highest HIV infection rates among Latinos in the United States (84). While mortality due to HIV has decreased significantly over the past 18 years, the current rate for Latinos is 4.7 per 100,000 deaths, whereas it is only 1.8 per 100,000 deaths for whites (Figure 6) (20, 61). While Latinos constituted approximately 13% of the US population in 2006, Latinos accounted for 18% of new infections, 19% of male cases, and 16% of female cases (a rate 4 times higher than that for white non-Latino women). HIV is affecting a younger group of Latinos than white non-Latinos. While most of the new cases of HIV among white men having sex with men have occurred primarily among men aged 30–39 years, among Latinos most new cases have occurred among men between the ages of 13 and 29 years (85). Language and lower income and educational levels appear to be important covariates of inadequate knowledge about the disease and testing rates (86). For many Latinos already living with HIV, misconceptions about preventive or treatment services, as well as perceived discrimination, can inhibit willingness to receive proper care and may contribute to higher death rates.
Figure 6.
Age-adjusted rates of death from human immunodeficiency virus disease, for all persons and for Latinos, United States, selected years between 1990 and 2005. Data were obtained from the National Center for Health Statistics (20).
Homicide
Total rates of mortality due to homicide are decreasing, yet there are persistent disparities between Latinos and other ethnic groups. In 2005, Latinos had homicide rates of 7.5 per 100,000 population, as compared with 6.1 per 100,000 for all persons and 2.7 per 100,000 for white non-Latinos (Figure 7) (20, 87). This trend is most pronounced among young men. When comparing rates of mortality due to homicide among men aged 15–24 years, we find greater disproportions. In 2005, 31 deaths per 100,000 population were due to homicide for Latinos, and 10.6 per 100,000 were due to homicide for white non-Latinos (61). Many Latinos, especially immigrants, reside in densely populated urban neighborhoods where poverty and low education are commonplace. These factors are associated with an increase in homicide rates (88, 89). Latino immigrants are far less likely to be either victims or perpetrators of homicide than Latinos born in the United States (90).
Figure 7.

Age-adjusted rates of death from homicide for all persons and for Latinos, by age group, United States, selected years between 1990 and 2005. Data were obtained from the National Center for Health Statistics (20).
Work-related injury
Disparities between Latinos and all workers in rates of death due to work-related injury persisted from 1992 to 2006 (91). Among Latinos, foreign-born workers had a 59% higher work-related injury death rate than their native-born counterparts from 2003 to 2006. In 1995, there were 5.5 deaths per 100,000 population as compared with 4.9 per 100,000 for non-Latinos. Following a consistent pattern, in 2006 the rates were 5.0 per 100,000 for Latinos and 4.0 per 100,000 for all workers.
There are several reasons why the Latino rates are likely to be underreported, and these reasons are often linked to the sub-rosa status of immigrant labor markets. Injuries, even those that are life-threatening, are less likely to be reported by informal labor contractors and smaller employers and are also less likely to be treated (92). There are obvious disincentives to reporting by injured workers who are undocumented and vulnerable to detection and deportation. The regulatory safety-inspection monitoring of employers by the federal government is frequently ineffective, allowing hazardous workplace practices and conditions (93), including inadequate use of safety equipment and toxic exposures, particularly in many industries where Latino labor is concentrated, such as manufacturing, construction, and agricultural work (94). Over one-third of all occupational deaths occurring during the period 1992–2006 were among persons working in construction positions, with the incidence of falls increasing by 370% between 1992 and 2006 (91). In this labor sector, employer-based health insurance is the exception rather than the rule, and the exclusion of undocumented workers from the US health-care system increases the likelihood that immigrants will continue to work when ill or injured and will fail to report accidents (92, 95).
Many Latinos, especially immigrants who work in hazardous jobs, often as occasional laborers, fail to receive proper training to help prevent injuries (96). Whether due to a reporting artifact or to improved occupational safety conditions, in 2007 the number of illnesses and injuries experienced by Latinos on the job declined (97).
WHAT DOES THIS REVIEW TELL US ABOUT LATINO HEALTH DISPARITIES?
In this review, we have documented Latinos’ overall positive mortality profile and have addressed several causes of excess mortality (including diabetes, cancers of the liver, cervix, and stomach, liver disease, HIV, homicide, and work-related injury) for which Latinos have higher death rates than the total US population. We used data from the National Center for Health Statistics and the National Program of Cancer Registries that represent the US civilian population. Whereas many previous articles have focused selectively on disease morbidity, in this study we examined multiple mortality disparities using data points covering up to 15 years, and sometimes shorter intervals, depending on the availability of national data sets with adequate sample sizes. This review increases our understanding of health disparities among Latinos and identifies those disparities persisting and contributing to differential mortality that need specific attention in public health programs.
Implications of the findings
With the large and growing Latino population, which is expected to reach 30% of the total US population by 2050, disparity trends are extremely concerning and deserve increased attention. The most useful paradigm for interpreting these results, we believe, is social adaptation—specifically, social learning in contexts that supply opportunities, environmental conditions, and psychological reinforcement for health-degrading behaviors that increase in prevalence between generations after immigration. These behavior-change processes have profound influences on human health and biology, and ultimately mortality. The essential drivers for trends in health disparities are demographic and are rooted in population structure and socioeconomic inequalities. These inequalities are nonrandom and have depleted the resources and social institutions of many neighborhoods, creating high-risk conditions for persons residing in those areas. Most adult parents of Latino children are middle-aged or older immigrants and formed their health and social behaviors before entering the United States. These protective features include the human organization of material resources and emotional support, sustained by intensive social interaction in coethnic immigrant social networks of family and friends, even in “bad” neighborhoods. However, children born into these environments will experience static socioeconomic mobility and will not fully benefit from the protective factors afforded to their parents by virtue of their distinctive personal histories.
Latino heterogeneity by SES is important, as death rates vary within Latino groups by SES (98). SES differentials decrease with age, whereby overall mortality advantages are observed more frequently in low SES categories, with little or no advantage being seen at higher SES levels (99). Latino immigrants may have fewer fatal health problems over the life course than white non-Latinos (100). The health advantage of lower-SES persons of Mexican origin continues to be an area of intense scrutiny, and many research questions can be productively addressed using comparative (multiethnic) epidemiologic sampling frames. These comparisons should adequately sample Latino subgroups, African Americans, and other ethnic groups.
Decreasing social inequalities in health with aging, especially in the last quarter of life, have been attributed to biologically driven frailty associated with SES factors and selective mortality (101, 102). These findings support the need to incorporate potential interactions between SES, sex, generation, and age in analyses of mortality. The role of SES in health and mortality among Latinos is complex both within and across populations in the Americas. SES differentials in Mexico and other areas of Latin America may be weak or reversed for some health-related variables such as smoking and obesity, since the poor in some nations are less able to afford cigarettes and high-calorie foods (103–105). Low-income immigrants carry health behaviors with them to the United States, conferring protective benefits, and are less likely to adopt new health-degrading behaviors than are their children.
Lifestyle behaviors
Differences in lifestyle behaviors and environmental factors underlie several of the disparities described, and we believe these are “unnecessary and avoidable” health outcomes. Factors associated with the disparities described in this paper include dietary behavior, physical activity, use of tobacco, alcohol, and other substances, and sexual practices. Cervical cancer can result from infection with sexually transmitted human papilloma virus and sexual intercourse at young ages, as well as high numbers of sexual partners—behaviors which increase with US nativity. In addition to human papilloma virus and cervical cancer, other infections associated with cancer disparity rates in Latinos include Helicobacter pylori in stomach cancer and hepatitis B and C in liver cancer. Environmental and lifestyle factors are major contributors to gastric cancer as well (106). For HIV, other risk factors include coinfection with hepatitis C virus, unprotected sexual intercourse, injection drug use, alcohol use, and severe mental illness leading to early death.
Persons born in the United States have higher prevalences than foreign-born persons of liver cancer risk factors such as hepatitis C infection, heavy alcohol consumption, nonalcoholic steatohepatitis, and diabetes (83). In fact, foreign-born Latinos have 45% lower mortality risks than US-born Latinos (39). Palloni and Arias (8) examined the Latino mortality advantage and concluded that the advantage is specific to Mexican Americans and “other Latinos” and does not apply to Puerto Ricans and Cubans. The advantage is strongest for foreign-born Mexican Americans compared with US-born Mexican Americans and strongest among the oldest groups of Mexican Americans.
Lower mortality rates among Latinos, especially immigrants, are referred to as the Latino health paradox because their health outcomes are better than expected given the low educational attainment and high poverty level of the Latino population (16–18). More work is needed to examine disease trends by category and risk factors over the life course to determine whether any enduring mortality paradox exists and its rate of decline for specific medical conditions. While both acculturation and assimilation have been variously defined across academic disciplines, the most dominant inference in the epidemiologic literature has been causal; for example, changing beliefs, knowledge, and health behaviors of Latinos in sequential generations have resulted in differential morbidity and mortality outcomes. Eschbach et al. (107) have reported mortality advantages for Latinos as a function of residential concentration. However, concentrated poverty may result in adverse effects on the health status and development of their children (108). Identifying the specific factors that help to account for the positive health effects of living in these ethnic enclaves may help to provide additional understanding and strategies for addressing health disparities among Latinos who have few residential alternatives.
Health care gaps and disparities
Latinos have a lower likelihood of seeking and receiving health-care services than the total US population (19). Lower access to and receipt of health care is related to lower health insurance coverage (76% vs. 91%) and language barriers (19). Latinos have rates of uninsurance that are among the highest, primarily because they work for employers who do not offer it, and may feel that they do not need it because they are healthy (109). Lack of health insurance is associated with not having a usual source of care, fewer referrals for procedures, and increased unmet health-care needs in general. In addition, insurance policies are changing and are trending toward fewer benefits and higher co-payments. Barriers in access to medical care may contribute to poorer health status and higher rates of morbidity and mortality in specific instances of deficient preventive care, late detection of disease, poor chronic disease management, and lack of consistent care for the elderly.
Screening and treatment are particularly important for the control and prevention of conditions such as diabetes and cervical cancer. Decreased screening and treatment have been demonstrated in several published reports, even after adjustment for health insurance (66, 67, 87, 110). Disparities in rates of health-care utilization can contribute to progression of advanced disease and worse outcomes, including death.
Limitations
Some limitations of this review must be acknowledged. First, the review was limited to English-language research articles. In addition, the underrepresentation of studies with Spanish-speaking respondents and the total underrepresentation of Latinos in national databases prior to 1980 limited our ability to identify intergenerational trends. Another limitation is that this review focused on adults; studies based on child samples were excluded. Examining disparities among Latino children is very important and raises other issues, especially those associated with development, long-range stress exposures, and the impact of undetected and untreated biologic and psychological impairments (111). Death rates for Latinos, particularly at a lower SES, may be biased downward because of age misreporting (112) and errors related to matching of death records to data from the National Health Interview Survey (113). Poor data quality has also been mentioned with respect to ethnic classification, age reporting, and mortality ascertainment. In addition, data were not always stratified by nativity, confounding interpretation of disparity outcomes.
While mortality was the focus of this paper, morbidity patterns that underlie these mortality disparities are also important, including areas that are known cofactors of mortality such as mental health, obesity, substance use, and oral health.
What should happen next?
Despite generally good health reinforced by a youthful population structure, persisting disparities in health and adverse environmental conditions that contribute to unhealthy behaviors undermine opportunities for the Latino community to progress in improving their SES in order to maintain any “immigrant health advantage” in subsequent generations. It is not good public policy to depend on immigration to solve mortality disparities in the United States by importing healthier populations and then allowing their health to deteriorate across subsequent generations. The increasing rates of obesity in particular are a concern with regard to their contribution to multiple mortality disparities in the future. In addition to the health implications, health disparities can adversely affect productivity, lead to declines in tax revenues, and elevate the costs of social services. The factors that contribute to disparities in the Latino community are complex and suggest a need for comprehensive strategies, including policies to bring about environmental changes that promote health and elimination of deficiencies in access to medical services, thereby improving overall community health.
Clinical research on health-care processes and treatments that incorporates greater representation of Latinos, including all types of intervention development, genetics, and basic research, will help in improving knowledge about emerging health disparities and identifying effective interventions. Research is also needed to better measure and assess the role of contributory social factors related to mortality disparities among Latinos, such as concentrated poverty, intergenerational low educational attainment, racism, violence (and related trauma), and discrimination as persistent social stressors that can adversely affect health.
Health literacy
Clinicians and health-care systems can play an important role in motivating Latinos to be screened and treated for diseases such as diabetes and cervical cancer, as well as risk factors for these conditions. Educational programs and materials tailored to Latinos are important for increased awareness and early detection. Educational campaigns should use multiple vehicles, including television, radio, newspapers, and magazines, in both English and Spanish. These educational campaigns can be supported by federal, state, local, and private resources. Given Latinos’ low rates of health insurance, policies that address the needs of uninsured Latinos are particularly needed (114).
Policy
The current economic crisis brings great opportunities for our country to make investments that will help revive our national potential for productivity by promoting the health of all communities and targeting disparities in population health and the quality of medical care (115). An increased focus on chronic disease prevention and control programs that include both individual and population strategies and that engage Latino communities in addressing environmental, policy, and behavioral changes is needed. The major sources of mortality (cancer, cardiovascular, and diabetes) in Latinos and other US ethnic groups have direct and indirect causes that are modifiable and preventable. Public health policy that encourages immunization within marginalized populations against hepatitis B virus and human papilloma virus will reduce infections and related cancers. The above examples underscore the need for the US Public Health Service to address these issues nationally using a well-articulated plan implemented by coordinated federal and state health agencies, with benchmarks to assure accountability.
ACKNOWLEDGMENTS
This project was supported by the Network for Multicultural Research on Health and Healthcare, Department of Family Medicine, David Geffen School of Medicine, University of California, Los Angeles, which is funded by the Robert Wood Johnson Foundation. Dr. Michael A. Rodriguez also received support from Drew/UCLA/RAND Project EXPORT (Charles Drew University of Medicine and Science, Los Angeles, California) and the National Center on Minority Health and Health Disparities (grants P20MD000148 and P20MD000182).
Abbreviations
- HIV
human immunodeficiency virus
- SES
socioeconomic status
Footnotes
Conflict of interest: none declared.
REFERENCES
- 1.Whitehead M. The concepts and principles of equity and health. Int J Health Serv. 1992;22(3):429–445. doi: 10.2190/986L-LHQ6-2VTE-YRRN. [DOI] [PubMed] [Google Scholar]
- 2.Argeseanu Cunningham S, Ruben JD, Narayan KM. Health of foreign-born people in the United States: a review. Health Place. 2008;14(4):623–635. doi: 10.1016/j.healthplace.2007.12.002. [DOI] [PubMed] [Google Scholar]
- 3.Smith DP, Bradshaw BS. Rethinking the Hispanic paradox: death rates and life expectancy for US non-Hispanic white and Hispanic populations. Am J Public Health. 2006;96(9):1686–1692. doi: 10.2105/AJPH.2003.035378. [DOI] [PMC free article] [PubMed] [Google Scholar]
- 4.Palloni A, Ewbank DC. Selection processes in the study of racial and ethnic differentials in adult health and mortality. In: Anderson NB, Bulatao RA, Cohen B, editors. Critical Perspectives on Racial Differences in Health in Later Life. National Research Council; Washington, DC: 2004. pp. 171–226. [Google Scholar]
- 5.Stephen EH, Foote K, Hendershot GE, et al. Health of the foreign-born population: United States, 1989–90. Adv Data. 1994;(241):1–12. [PubMed] [Google Scholar]
- 6.Akresh IR, Frank R. Health selection among new immigrants. Am J Public Health. 2008;98(11):2058–2064. doi: 10.2105/AJPH.2006.100974. [DOI] [PMC free article] [PubMed] [Google Scholar]
- 7.Abriado-Lanza AF, Dohrenwend BP, Ng-Mak DS, et al. The Latino mortality paradox: a test of the “salmon bias” and MRFIT Latino risk-adjusted mortality healthy migrant hypotheses. Am J Public Health. 1999;89(10):1543–1548. doi: 10.2105/ajph.89.10.1543. [DOI] [PMC free article] [PubMed] [Google Scholar]
- 8.Palloni A, Arias E. Paradox lost: explaining the Hispanic adult mortality advantage. Demography. 2004;41(3):385–415. doi: 10.1353/dem.2004.0024. [DOI] [PubMed] [Google Scholar]
- 9.Turra CM, Elo IT. The impact of salmon bias on the Hispanic mortality advantage: new evidence from Social Security data. Popul Res Policy Rev. 2008;27(5):515–530. doi: 10.1007/s11113-008-9087-4. [DOI] [PMC free article] [PubMed] [Google Scholar]
- 10.Rosenberg HM, Maurer JD, Sorlie PD, et al. Quality of death rates by race and Hispanic origin: a summary of current research, 1999. Vital Health Stat. 1999;2(128):1–13. [PubMed] [Google Scholar]
- 11.Eschbach K, Kuo YF, Goodwin JS. Ascertainment of Hispanic ethnicity on California death certificates: implications for the explanation of Hispanic mortality advantage. Am J Public Health. 2006;96(12):2209–2215. doi: 10.2105/AJPH.2005.080721. [DOI] [PMC free article] [PubMed] [Google Scholar]
- 12.Ho A, Shih M, Simon P. Hispanic paradox [letter] Am J Public Health. 2007;97(3):392. doi: 10.2105/AJPH.2006.105320. [DOI] [PMC free article] [PubMed] [Google Scholar]
- 13.Sorlie PD, Backlund E, Johnson NJ, et al. Mortality by Hispanic status in the United States. JAMA. 1993;270(20):2464–2468. [PubMed] [Google Scholar]
- 14.Krieger N, Rowley DL, Herman AA, et al. Racism, sexism, and social class: implications for studies of health, disease, and well being. Am J Prev Med. 1993;9(6 suppl):82–122. [PubMed] [Google Scholar]
- 15.Kaufman JS, Cooper RS. Seeking causal explanations in social epidemiology. Am J Epidemiol. 1999;150(2):113–120. doi: 10.1093/oxfordjournals.aje.a009969. [DOI] [PubMed] [Google Scholar]
- 16.Markides KS, Coreil J. The health of Hispanics in the southwestern United States: an epidemiologic paradox. Public Health Rep. 1986;101(3):253–265. [PMC free article] [PubMed] [Google Scholar]
- 17.Hayes-Bautista DE, Baezconde-Garbanati L, Hayes-Bautista M. Latino health in Los Angeles: family medicine in a changing minority context. Fam Pract. 1994;11(3):318–324. doi: 10.1093/fampra/11.3.318. [DOI] [PubMed] [Google Scholar]
- 18.Markides KS, Eschbach K. Aging, migration, and mortality: current status of research on the Hispanic paradox. J Gerontol B Psychol Sci Soc Sci. 2005;60(spec. no. 2):68–75. doi: 10.1093/geronb/60.special_issue_2.s68. [DOI] [PubMed] [Google Scholar]
- 19.Centers for Disease Control and Prevention Access to health-care and preventive services among Hispanics and non-Hispanics—United States, 2001–2002. MMWR Morb Mortal Wkly Rep. 2004;53(40):937–941. [PubMed] [Google Scholar]
- 20.National Center for Health Statistics . Health, United States, 2008, With Chartbook on Trends in the Health of Americans. National Center for Health Statistics; Hyattsville, MD: 2008. [Google Scholar]
- 21.Singh GK, Hiatt RA. Trends and disparities in socioeconomic and behavioral characteristics, life expectancy, and cause-specific mortality of native-born and foreign-born populations in the United States, 1979–2003. Int J Epidemiol. 2006;35(4):903–919. doi: 10.1093/ije/dyl089. [DOI] [PubMed] [Google Scholar]
- 22.Zsembik BA, Fennell D. Ethnic variation in health and the determinants of health among Latinos. Soc Sci Med. 2005;61(1):53–63. doi: 10.1016/j.socscimed.2004.11.040. [DOI] [PubMed] [Google Scholar]
- 23.Bernstein R. Hispanic Population Passes 40 Million, Census Bureau Reports [news release] Bureau of the Census, US Department of Commerce; Washington, DC: 2005. [Google Scholar]
- 24.Population Division, Bureau of the Census, US Department of Commerce . Projected Change in Population Size by Race and Hispanic Origin for the United States 2000–2050. Bureau of the Census, US Department of Commerce; Washington, DC: 2008. [Google Scholar]
- 25.Passel JS, Cohn DV. A Portrait of Unauthorized Immigrants in the United States. (Pew Hispanic Center report) Pew Research Center; Washington, DC: 2009. [Google Scholar]
- 26.National Bureau of Economic Research . CPS March Supplement. (Annual demographic files from the Current Population Survey for 2004–2008) National Bureau of Economic Research; Cambridge, MA: [Accessed January 29, 2009]. 2009. http://www.bls.census.gov/cps_ftp.html#cpsmarch. [Google Scholar]
- 27.Bernstein R. U.S. Hispanic Population Surpasses 45 Million—Now 15 Percent of Total [news release] Bureau of the Census, US Department of Commerce; Washington, DC: 2008. [Google Scholar]
- 28.Rumbaut R. Ages, life stages, and generational cohorts: decomposing the immigrant first and second generations. Int Migr Rev. 2004;38(3):1160–1205. [Google Scholar]
- 29.Ramirez RR. We the People: Hispanics in the United States. (Census 2000 special reports) Bureau of the Census, US Department of Commerce; Washington, DC: 2004. [Google Scholar]
- 30.Rutledge MS, McLaughlin CG. Hispanics and health insurance coverage: the rising disparity. Med Care. 2008;46(10):1086–1092. doi: 10.1097/MLR.0b013e31818828e3. [DOI] [PubMed] [Google Scholar]
- 31.Wang S, Ray N, Rojas W, et al. Geographic patterns of genome admixture in Latin American Mestizos [electronic article] PLoS Genet. 2008;4(3):e1000037. doi: 10.1371/journal.pgen.1000037. [DOI] [PMC free article] [PubMed] [Google Scholar]
- 32.Krieger N. Stormy weather: race, gene expression, and science of health disparities. Am J Public Health. 2005;95(12):2155–2160. doi: 10.2105/AJPH.2005.067108. [DOI] [PMC free article] [PubMed] [Google Scholar]
- 33.Escamilla M, Hare E, Dassori AM, et al. A schizophrenia gene locus on chromosome 17q21 in a new set of families of Mexican and Central American ancestry: evidence from the NIMH Genetics of Schizophrenia in Latino Populations Study. Am J Psychiatry. 2009;166(4):442–449. doi: 10.1176/appi.ajp.2008.08040612. [DOI] [PubMed] [Google Scholar]
- 34.Bureau of the Census, US Department of Commerce . The 2009 Statistical Abstract: Births, Deaths, Marriages, and Divorces. Bureau of the Census, US Department of Commerce; Washington, DC: 2008. Life expectancy. [Google Scholar]
- 35.Huh J, Pruase JA, Dooley CD. The impact of nativity on chronic diseases, self-related health and comorbidity status of Asian and Hispanic immigrants. J Immigr Minor Health. 2008;10(2):103–118. doi: 10.1007/s10903-007-9065-7. [DOI] [PubMed] [Google Scholar]
- 36.Jerant A, Rose A. Health status among US Hispanics: ethnic variation, nativity, and language moderation. Med Care. 2008;46(7):709–717. doi: 10.1097/MLR.0b013e3181789431. [DOI] [PubMed] [Google Scholar]
- 37.Eschbach K, Stimpson JP, Kuo YF, et al. Mortality of foreign-born and US-born Hispanic adults at younger ages: a reexamination of recent patterns. Am J Public Health. 2007;97(7):1297–1304. doi: 10.2105/AJPH.2006.094193. [DOI] [PMC free article] [PubMed] [Google Scholar]
- 38.Hunt KJ, Williams K, Resendez RG, et al. All-cause and cardiovascular mortality among diabetic participants in the San Antonio Heart Study: evidence against the “Hispanic Paradox. Diabetes Care. 2002;25(9):1557–1563. doi: 10.2337/diacare.25.9.1557. [DOI] [PubMed] [Google Scholar]
- 39.Singh GK, Siahpush M. Ethnic-immigrant differentials in health behaviors, morbidity, and cause-specific mortality in the United States: an analysis of two national data bases. Hum Biol. 2002;74(1):83–109. doi: 10.1353/hub.2002.0011. [DOI] [PubMed] [Google Scholar]
- 40.Morales LS, Lara M, Kington RS, et al. Socioeconomic, cultural, and behavioral factors affecting Hispanic health outcomes. J Health Care Poor Underserved. 2002;13(4):477–503. doi: 10.1177/104920802237532. [DOI] [PMC free article] [PubMed] [Google Scholar]
- 41.Cherpitel CJ, Tam TW. Variables associated with DUI offender status among whites and Mexican Americans. J Stud Alcohol. 2000;61(5):698–703. doi: 10.15288/jsa.2000.61.698. [DOI] [PubMed] [Google Scholar]
- 42.Rutter M. Natural experiments, causal influences, and policy development. In: Rutter M, Tienda M, editors. Ethnicity and Causal Mechanisms. Cambridge University Press; New York, NY: 2005. pp. 1–20. [Google Scholar]
- 43.Tienda M, Mitchell F, editors. Hispanics and the Future of America: Panel on Hispanics in the United States. National Academies Press; Washington, DC: 2006. [PubMed] [Google Scholar]
- 44.Williams DR. The health of men: structured inequalities and opportunities. Am J Public Health. 2003;93(5):724–731. doi: 10.2105/ajph.93.5.724. [DOI] [PMC free article] [PubMed] [Google Scholar]
- 45.Courtwright A. Health disparities and autonomy. Bioethics. 2008;22(8):431–439. doi: 10.1111/j.1467-8519.2008.00671.x. [DOI] [PubMed] [Google Scholar]
- 46.Williams DR, Collins C. Racial residential segregation: a fundamental cause of racial disparities in health. Public Health Rep. 2001;116(5):404–416. doi: 10.1093/phr/116.5.404. [DOI] [PMC free article] [PubMed] [Google Scholar]
- 47.McEwen BS. Protection and damage from acute and chronic stress: allostasis and allostatic overload and relevance to the pathophysiology of psychiatric disorders. Ann N Y Acad Sci. 2004;1032:1–7. doi: 10.1196/annals.1314.001. [DOI] [PubMed] [Google Scholar]
- 48.Marmot MG. Status syndrome: a challenge to medicine. JAMA. 2006;295(11):1304–1307. doi: 10.1001/jama.295.11.1304. [DOI] [PubMed] [Google Scholar]
- 49.Brunner E, Marmot M. Social organization, stress, and health. In: Marmot M, Wilkinson RG, editors. Social Determinants of Health. Oxford University Press; New York, NY: 2006. pp. 6–30. [Google Scholar]
- 50.Marmot MG, Shipley MJ, Hemingway H, et al. Biological and behavioural explanations of social inequalities in coronary heart disease: the Whitehall II study. Diabetologia. 2008;51(11):1980–1988. doi: 10.1007/s00125-008-1144-3. [DOI] [PMC free article] [PubMed] [Google Scholar]
- 51.Marmot MG. Influence of income on health: views of an epidemiologist. Health Aff. 2002;21(2):31–46. doi: 10.1377/hlthaff.21.2.31. [DOI] [PubMed] [Google Scholar]
- 52.Cooper R. Gene-environment interactions and the etiology of common complex disease. Ann Intern Med. 2003;139(5):437–440. doi: 10.7326/0003-4819-139-5_part_2-200309021-00011. [DOI] [PubMed] [Google Scholar]
- 53.Peccoud J, Velden KV, Podlich D, et al. The selective values of alleles in a molecular network model are context dependent. Genetics. 2004;166(4):1715–1725. doi: 10.1534/genetics.166.4.1715. [DOI] [PMC free article] [PubMed] [Google Scholar]
- 54.Hernandez LM, Blazer DG. Genes, Behavior, and the Social Environment: Moving Beyond the Nature/Nurture Debate. National Academies Press; Washington, DC: 2006. [PubMed] [Google Scholar]
- 55.Ruíz-Godoy L, Rizo Rios P, Sánchez Cervantes F, et al. Mortality due to lung cancer in Mexico. Lung Cancer. 2007;58(2):184–190. doi: 10.1016/j.lungcan.2007.06.007. [DOI] [PubMed] [Google Scholar]
- 56.Wilkinson AV, Spitz MR, Strom SS, et al. Effects of nativity, age at migration, and acculturation on smoking among adult Houston residents of Mexican descent. Am J Public Health. 2005;95(6):1043–1049. doi: 10.2105/AJPH.2004.055319. [DOI] [PMC free article] [PubMed] [Google Scholar]
- 57.Seeman T, Merkin SS, Crimmins E, et al. Education, income and ethnic differences in cumulative biological risk profiles in a national sample of US adults: NHANES III (1988–1994) Soc Sci Med. 2007;66(1):72–87. doi: 10.1016/j.socscimed.2007.08.027. [DOI] [PMC free article] [PubMed] [Google Scholar]
- 58.Vega WA, Amaro H. Latino outlook: good health, uncertain prognosis. Annu Rev Public Health. 1994;15(1):39–67. doi: 10.1146/annurev.pu.15.050194.000351. [DOI] [PubMed] [Google Scholar]
- 59.US Cancer Statistics Working Group . United States Cancer Statistics: 1999–2005 Incidence and Mortality Web-based Report. Centers for Disease Control and Prevention and National Cancer Institute; Atlanta, GA, and Bethesda, MD: 2009. [Google Scholar]
- 60.Shai I, Jiang R, Manson JE, et al. Ethnicity, obesity, and risk of type 2 diabetes in women: a 20-year follow-up study. Diabetes Care. 2006;29(7):1585–1590. doi: 10.2337/dc06-0057. [DOI] [PubMed] [Google Scholar]
- 61.National Center for Health Statistics . Health, United States, 2007, With Chartbook on Trends in the Health of Americans. National Center for Health Statistics; Hyattsville, MD: 2007. p. 195. [PubMed] [Google Scholar]
- 62.Kandula NR, Diez-Roux AV, Chan C, et al. Association of acculturation levels and prevalence of diabetes in the Multi-Ethnic Study of Atherosclerosis (MESA) Diabetes Care. 2008;31(8):1621–1628. doi: 10.2337/dc07-2182. [DOI] [PMC free article] [PubMed] [Google Scholar]
- 63.Hubert HB, Snider J, Winkleby MA. Health status, health behaviors, and acculturation factors associated with over-weight and obesity in Latinos from a community and agricultural labor camp survey. Prev Med. 2005;40(6):642–651. doi: 10.1016/j.ypmed.2004.09.001. [DOI] [PubMed] [Google Scholar]
- 64.Byrd TL, Chavez R, Wilson KM. Barriers and facilitators of cervical cancer screening among Hispanic women. Ethn Dis. 2007;17(1):129–134. [PubMed] [Google Scholar]
- 65.Owusu GA, Eve SB, Cready CM, et al. Race and ethnic disparities in cervical cancer screening in a safety-net system. Matern Child Health J. 2005;9(3):285–295. doi: 10.1007/s10995-005-0004-8. [DOI] [PubMed] [Google Scholar]
- 66.Fernández LE, Morales A. Language and use of cancer screening services among border and non-border Hispanic Texas women. Ethn Health. 2007;12(3):245–263. doi: 10.1080/13557850701235150. [DOI] [PubMed] [Google Scholar]
- 67.Kang-Kim M, Betancourt JR, Avanian JZ, et al. Access to care and use of preventive services by Hispanics: state-based variations from 1991 to 2004. Med Care. 2008;46(5):507–515. doi: 10.1097/MLR.0b013e31816dd966. [DOI] [PubMed] [Google Scholar]
- 68.Rodríguez MA, Ward LM, Pérez-Stable EJ. Breast and cervical cancer screening: impact of health insurance status, ethnicity, and nativity of Latinas. Ann Fam Med. 2005;3(3):235–241. doi: 10.1370/afm.291. [DOI] [PMC free article] [PubMed] [Google Scholar]
- 69.Downs LS, Smith JS, Scarinci I, et al. The disparity of cervical cancer in diverse populations. Gynecol Oncol. 2008;109(2 suppl):S22–S30. doi: 10.1016/j.ygyno.2008.01.003. [DOI] [PubMed] [Google Scholar]
- 70.Wu X, Chen VW, Andrews PA, et al. Incidence of esophageal and gastric cancers among Hispanics, non-Hispanic whites and non-Hispanic blacks in the United States: subsite and histology differences. Cancer Causes Control. 2007;18(6):585–593. doi: 10.1007/s10552-007-9000-1. [DOI] [PubMed] [Google Scholar]
- 71.El-Serag HB, Lau M, Eschbach K, et al. Epidemiology of hepatocellular carcinoma in Hispanics in the United States. Arch Intern Med. 2007;167(18):1983–1989. doi: 10.1001/archinte.167.18.1983. [DOI] [PubMed] [Google Scholar]
- 72.Barnholtz-Sloan J, Patel N, Rollison D, et al. Incidence trends of invasive cervical cancer in the United States by combined race and ethnicity. Cancer Causes Control. 2009;20(7):1129–1138. doi: 10.1007/s10552-009-9317-z. [DOI] [PubMed] [Google Scholar]
- 73.Sussner KM, Thompson HS, Valdimarsdottir HB, et al. Acculturation and familiarity with, attitudes towards and beliefs about genetic testing for cancer risk within Latinas in East Harlem, New York City. J Genet Couns. 2008;18(1):60–71. doi: 10.1007/s10897-008-9182-z. [DOI] [PMC free article] [PubMed] [Google Scholar]
- 74.Ricker CN, Hiyama S, Fuentes S, et al. Beliefs and interest in cancer risk in an underserved Latino cohort. Prev Med. 2007;44(3):241–245. doi: 10.1016/j.ypmed.2006.08.018. [DOI] [PubMed] [Google Scholar]
- 75.Graves KD, Huerta E, Cullen J, et al. Perceived risk of breast cancer among Latinas attending community clinics: risk comprehension and relationship with mammography adherence. Cancer Causes Control. 2008;19(10):1373–1382. doi: 10.1007/s10552-008-9209-7. [DOI] [PMC free article] [PubMed] [Google Scholar]
- 76.Alegría M, Canino G, Shrout PE, et al. Prevalence of mental illness in immigrant and non-immigrant U.S. Latino groups. Am J Psychiatry. 2008;165(3):359–369. doi: 10.1176/appi.ajp.2007.07040704. [DOI] [PMC free article] [PubMed] [Google Scholar]
- 77.Flores YN, Yee HF, Jr, Leng M, et al. Risk factors for chronic liver disease in blacks, Mexican Americans, and whites in the United States: results from NHANES IV, 1999–2004. Am J Gastroenterol. 2008;103(9):2231–2238. doi: 10.1111/j.1572-0241.2008.02022.x. [DOI] [PMC free article] [PubMed] [Google Scholar]
- 78.Alfine ME, Treem WR. Nonalcoholic fatty liver disease. Pediatr Ann. 2006;35(4):290–294. 297–299. doi: 10.3928/0090-4481-20060401-14. [DOI] [PubMed] [Google Scholar]
- 79.Clark JM. The epidemiology of nonalcoholic fatty liver disease in adults. J Clin Gastroenterol. 2006;40(suppl 1):S5–S10. doi: 10.1097/01.mcg.0000168638.84840.ff. [DOI] [PubMed] [Google Scholar]
- 80.Kallwitz ER, Guzman G, TenCate V, et al. The histologic spectrum of liver disease in African-American, non-Hispanic white and Hispanic obesity surgery patients. Am J Gastroenterol. 2009;104(1):64–69. doi: 10.1038/ajg.2008.12. [DOI] [PubMed] [Google Scholar]
- 81.Alazmi WM, Regev A, Molina EG, et al. Predictors of cirrhosis in Hispanic patients with nonalcoholic steatohepatitis. Dig Dis Sci. 2006;51(10):1725–1729. doi: 10.1007/s10620-005-9065-1. [DOI] [PubMed] [Google Scholar]
- 82.Blessman DJ. Chronic hepatitis C in the Hispanic/Latino population living in the United States: a literature review. Gastroenterol Nurs. 2008;31(1):17–25. doi: 10.1097/01.SGA.0000310931.64854.5f. [DOI] [PubMed] [Google Scholar]
- 83.Centers for Disease Control and Prevention Subpopulation estimates from the HIV incidence surveillance system—United States, 2006. MMWR Morb Mortal Wkly Rep. 2008;57(36):985–989. [PubMed] [Google Scholar]
- 84.Espinoza L, Hall HI, Selik RM, et al. Characteristics of HIV infection among Hispanics, United States 2003–2006. J Acquir Immune Defic Syndr. 2008;49(1):94–101. doi: 10.1097/QAI.0b013e3181820129. [DOI] [PubMed] [Google Scholar]
- 85.Ritieni A, Moskowitz J, Tholandi M. HIV/AIDS misconceptions among Latinos: findings from a population based survey of California adults. Health Educ Behav. 2008;35(2):245–259. doi: 10.1177/1090198106288795. [DOI] [PubMed] [Google Scholar]
- 86.Bowden WP, Rhodes SD, Wilkin AM, et al. Sociocultural determinants of HIV/AIDS risk and service use among immigrant Latinos in North Carolina. Hisp J Behav Sci. 2006;28(4):546–562. [Google Scholar]
- 87.National Center for Injury Prevention and Control, Centers for Disease Control and Prevention . WISQARS Injury Mortality Reports, 1999–2006. National Center for Injury Prevention and Control, Centers for Disease Control and Prevention; Atlanta, GA: [Accessed April 1, 2008]. 2008. http://webappa.cdc.gov/sasweb/ncipc/mortrate10_sy.html. [Google Scholar]
- 88.Wang F, Arnold MT. Localized income inequality, concentrated disadvantage and homicide. Appl Geogr. 2008;28(4):259–270. [Google Scholar]
- 89.Rodríguez MA, Brindis CD. Violence and Latino youth: prevention and methodological issues. Public Health Rep. 1995;110(3):260–276. [PMC free article] [PubMed] [Google Scholar]
- 90.Nielsen AL, Martinez R, Jr, Rosenfeld R. Firearm use, injury, and lethality in assaultive violence: an examination of ethnic differences. Homicide Stud. 2005;9(2):83–108. [Google Scholar]
- 91.Centers for Disease Control and Prevention Work-related injury deaths among Hispanics—United States, 1992–2006. MMWR Morb Mortal Wkly Rep. 2008;57(22):597–600. [PubMed] [Google Scholar]
- 92.Ortega AN, Fang H, Perez VH, et al. Health care access, use of services, and experiences among undocumented Mexicans and other Latinos. Arch Intern Med. 2007;167(21):2354–2360. doi: 10.1001/archinte.167.21.2354. [DOI] [PubMed] [Google Scholar]
- 93.Robertson RE. Workplace Safety and Health: OSHA Could Improve Federal Agencies’ Safety Programs With a More Strategic Approach to Its Oversight. DIANE Publishing; Darby, PA: 2006. [Google Scholar]
- 94.Silverstein M. Getting home safe and sound: Occupational Safety and Health Administration at 38. Am J Public Health. 2008;98(3):416–423. doi: 10.2105/AJPH.2007.117382. [DOI] [PMC free article] [PubMed] [Google Scholar]
- 95.Berdahl TA. Racial/ethnic and gender differences in individual workplace injury risk trajectories: 1988–1998. Am J Public Health. 2008;98(12):2258–2263. doi: 10.2105/AJPH.2006.103135. [DOI] [PMC free article] [PubMed] [Google Scholar]
- 96.O’Connor T, Loomis D, Runyan C, et al. Adequacy of health and safety training among young Latino construction workers. J Occup Environ Med. 2005;47(3):272–277. doi: 10.1097/01.jom.0000150204.12937.f5. [DOI] [PubMed] [Google Scholar]
- 97.Bureau of Labor Statistics, US Department of Labor . Non-fatal Occupational Injuries and Illnesses Requiring Days Away From Work, 2007 [news release] Bureau of Labor Statistics, US Department of Labor; Washington, DC: 2008. [Google Scholar]
- 98.Turra CM, Goldman N. Socioeconomic differences in mortality among U.S. adults: insights into the Hispanic paradox. J Gerontol B Psychol Sci Soc Sci. 2007;62(3):S184–S192. doi: 10.1093/geronb/62.3.s184. [DOI] [PubMed] [Google Scholar]
- 99.Goldman N, Kimbro RT, Turra CM, et al. Socioeconomic gradients in health for white and Mexican-origin populations. Am J Public Health. 2006;96(12):2186–2193. doi: 10.2105/AJPH.2005.062752. [DOI] [PMC free article] [PubMed] [Google Scholar]
- 100.Wei M, Valdez RA, Mitchell BD, et al. Migration status, socioeconomic status, and mortality rates in Mexican Americans and non-Hispanic whites: the San Antonio Heart Study. Ann Epidemiol. 1996;6(4):307–313. doi: 10.1016/s1047-2797(96)00026-9. [DOI] [PubMed] [Google Scholar]
- 101.Backlund E, Sorlie PD, Johnson NJ. The shape of the relationship between income and mortality in the United States: evidence from the National Longitudinal Mortality Study. Ann Epidemiol. 1996;6(1):12–20. doi: 10.1016/1047-2797(95)00090-9. [DOI] [PubMed] [Google Scholar]
- 102.Beckett M. Converging health inequalities in later life—an artifact of mortality selection? J Health Soc Behav. 2000;41(1):106–119. [PubMed] [Google Scholar]
- 103.Kain J, Vio F, Albala C. Obesity trends and determinant factors in Latin America. Cad Saude Publica. 2003;19(suppl 1):S77–S86. doi: 10.1590/s0102-311x2003000700009. [DOI] [PubMed] [Google Scholar]
- 104.Rivera JA, Sepúlveda Amor J. Conclusions from the Mexican National Nutrition Survey 1999: translating results into nutrition policy. Salud Publica Mex. 2003;45(suppl 4):S565–S575. doi: 10.1590/s0036-36342003001000013. [DOI] [PubMed] [Google Scholar]
- 105.Vázquez-Segovia LA, Sesma-Vázquez S, Hernández-Avila M. Tobacco use in Mexican households: results of the Income and Expenses Survey of Households, 1984–2000. Salud Publica Mex. 2002;44(suppl 1):S76–S81. [PubMed] [Google Scholar]
- 106.Crew KD, Neugut AI. Epidemiology of gastric cancer. World J Gastroenterol. 2006;12(3):354–362. doi: 10.3748/wjg.v12.i3.354. [DOI] [PMC free article] [PubMed] [Google Scholar]
- 107.Eschbach K, Ostir GV, Patel KV, et al. Neighborhood context and mortality among older Mexican Americans: is there a barrio advantage? Am J Public Health. 2004;94(10):1807–1812. doi: 10.2105/ajph.94.10.1807. [DOI] [PMC free article] [PubMed] [Google Scholar]
- 108.Krueger PM, Bond Huie SA, Rogers RG, et al. Neighborhoods and homicide mortality: an analysis of race/ethnic differences. J Epidemiol Community Health. 2004;58(3):223–230. doi: 10.1136/jech.2003.011874. [DOI] [PMC free article] [PubMed] [Google Scholar]
- 109.McWilliams JM, Zaslavsky AM, Meara E, et al. Health insurance coverage and mortality among the near-elderly. Health Aff (Millwood) 2004;23(4):223–233. doi: 10.1377/hlthaff.23.4.223. [DOI] [PubMed] [Google Scholar]
- 110.Morrissey NJ, Giacovelli J, Egorova N, et al. Disparities in the treatment and outcomes of vascular disease in Hispanic patients. J Vasc Surg. 2007;46(5):971–978. doi: 10.1016/j.jvs.2007.07.021. [DOI] [PMC free article] [PubMed] [Google Scholar]
- 111.Acevedo-Garcia D, Osypuk TL, McArdle N, et al. Toward a policy-relevant analysis of geographic and racial/ethnic disparities in child health. Health Aff (Millwood) 2008;27(2):321–330. doi: 10.1377/hlthaff.27.2.321. [DOI] [PubMed] [Google Scholar]
- 112.Preston SH, Elo IT, Stewart Q. Effects of age misreporting on mortalityestimatesatolderages. PopulStud. 1999;53(2):165–177. [Google Scholar]
- 113.Elo IT, Turra CM, Kestenbaum B, et al. Mortality among elderly Hispanics in the United States: past evidence and new results. Demography. 2004;41(1):109–128. doi: 10.1353/dem.2004.0001. [DOI] [PubMed] [Google Scholar]
- 114.Ku L. Health insurance coverage and medical expenditures of immigrants and native-born citizens in the United States. Am J Public Health. 2009;99(7):1322–1328. doi: 10.2105/AJPH.2008.144733. [DOI] [PMC free article] [PubMed] [Google Scholar]
- 115.Williams DR. Race and health: trends and policy implications. In: Auerbach JA, Krimgold BK, editors. Income, Socioeconomic Status, and Health: Exploring the Relationships. National Policy Association, Academy for Health Services Research and Health Policy; Washington, DC: 2001. pp. 67–85. [Google Scholar]