Abstract
The Pemberton Happiness Index (PHI) is a recently developed integrative measure of well-being that includes components of hedonic, eudaimonic, social, and experienced well-being. The PHI has been validated in several languages, but not in Portuguese. Our aim was to cross-culturally adapt the Universal Portuguese version of the PHI and to assess its psychometric properties in a sample of the Brazilian population using online surveys.
An expert committee evaluated 2 versions of the PHI previously translated into Portuguese by the original authors using a standardized form for assessment of semantic/idiomatic, cultural, and conceptual equivalence. A pretesting was conducted employing cognitive debriefing methods. In sequence, the expert committee evaluated all the documents and reached a final Universal Portuguese PHI version. For the evaluation of the psychometric properties, the data were collected using online surveys in a cross-sectional study. The study population included healthcare professionals and users of the social network site Facebook from several Brazilian geographic areas. In addition to the PHI, participants completed the Satisfaction with Life Scale (SWLS), Diener and Emmons’ Positive and Negative Experience Scale (PNES), Psychological Well-being Scale (PWS), and the Subjective Happiness Scale (SHS). Internal consistency, convergent validity, known-group validity, and test–retest reliability were evaluated. Satisfaction with the previous day was correlated with the 10 items assessing experienced well-being using the Cramer V test. Additionally, a cut-off value of PHI to identify a “happy individual” was defined using receiver-operating characteristic (ROC) curve methodology.
Data from 1035 Brazilian participants were analyzed (health professionals = 180; Facebook users = 855). Regarding reliability results, the internal consistency (Cronbach alpha = 0.890 and 0.914) and test–retest (intraclass correlation coefficient = 0.814) were both considered adequate. Most of the validity hypotheses formulated a priori (convergent and know-group) was further confirmed. The cut-off value of higher than 7 in remembered PHI was identified (AUC = 0.780, sensitivity = 69.2%, specificity = 78.2%) as the best one to identify a happy individual.
We concluded that the Universal Portuguese version of the PHI is valid and reliable for use in the Brazilian population using online surveys.
Keywords: happiness, instrument, subjective well-being, survey, validation
1. Introduction
The number of studies aiming at discovering what happiness is and how happy people are has increased over time. There are many definitions of happiness, most of which allude to a positive emotional state, including feelings of well-being and pleasure, as well a fulfilling satisfactory life.[1,2] Subjective well-being has been defined as “a person's cognitive and affective evaluations of his or her life as a whole”[3]; “happiness” and “subjective well-being” can be considered synonymous and are used interchangeably in the present paper. One of the findings with the widest consensus is that human beings actively look for to increase or to maintain their personal well-being independently from the meaning each individual attributes to it.[4–6]
The relevance of human happiness is supported by the fact that United Nations (UN) passed a resolution recognizing the pursuit of happiness as a fundamental human goal. More than an individual endeavor, the UN emphasizes the importance of public policies to promote well-being and encourage each country to elaborate measures of happiness reflecting their own characteristics.[7]
Several studies sought to correlate the determinants of subjective well-being with personal experiences. Some recent research found a strong relationship between a person's positive or negative experiences and his or her state of physical and mental health. Therefore, emotional constructs demonstrate the different ways individuals react to stressing or negative events that can affect their physical health.[8,9]
Subjective well-being is typically measured based on self-report data.[10] Different questionnaires have been developed for this purpose without a gold-standard measure. Among several instruments available to measure happiness[2,11–14] we identified and selected the Pemberton Happiness Index (PHI),[15] as it was initially designed as a comprehensive measure of well-being using a cross-cultural approach. The PHI has demonstrated adequate psychometric properties (good internal consistence, single-factor structure, and adequate convergent and incremental validity), and has been previously validated in 7 different languages, but not in Portuguese language. The PHI consists of 11 items related to different domains of remembered well-being (i.e., general, hedonic, eudaimonic, and social well-being) and 10 items related to experienced well-being (i.e., positive and negative events that occurred the day before). As the PHI exhibits satisfactory psychometric properties, this simple and integrative index may be used as an instrument to monitor changes in subjective well-being in future clinical and population studies.[15] Of note, we are particularly interested in its potential use as an online validated tool, as it would ease to collect data in larger and diverse samples with lower costs.
The aims of the present study were to cross-culturally adapt the Universal Portuguese version of the PHI and to assess its psychometric properties in a large sample of the Brazilian population using online surveys.
2. Methods
2.1. Study design and participant selection
This cross-sectional study applied techniques for the adaptation and validation of the assessment instrument. The data were collected from November 2014 to November 2015 using SurveyMonkey. The study population included professionals from the Barretos Cancer Hospital (HCB, Barretos, São Paulo, Brazil), a reference center for cancer care in Brazil, and users of the social network site Facebook (Facebook, Inc., Menlo Park, CA; http://www.facebook.com) from several Brazilian regions across the whole country. Individuals above 18 years old from both genders were included.
2.2. Sample
Two different samples were analyzed together: Sample 1 consisted of 180 professionals of a large Oncology hospital (HCB), and Sample 2 consisted of 855 individuals from the Brazilian general population. The total combined sample consisted of 1035 participants. Given that a separate data analyses using item response theory was planned, but not reported in the present paper, a sample of at least 1000 individuals was judged statistically robust for that analyses.
2.3. Ethical issues
The study was performed in accordance with the ethical standards of the Declaration of Helsinki and the Brazilian National Health Council Resolution no. 466/2012 and was approved by the Ethics Committee of the Barretos Cancer Hospital (no. HCB 886/2014 and 940/2015). Volunteers manifested their agreement to participate in the study via the informed consent form included in the survey form.
2.4. Data collection
Sample 1: E-mails were sent to 372 health professionals whose e-mail addresses were registered with the hospital, explaining the study and containing a link that directed the participants to the survey. Invitations were sent up to 4 times at 1-week intervals.
Sample 2: The survey link, along with an invitation to participate, was published on the personal Facebook profile pages of 3 of the authors (BSRP, MGC, and CEP). Participants were also encouraged to share the link on their own pages, thus spreading the link among potential participants. Only participants who had complete data on all the questionnaire variables used were entered in the analyses.
After clicking the study link, the respondents in both Samples 1 and 2 were directed to the study's page on the online program SurveyMonkey by registering on the site (https: //pt.surveymonkey.com).
To assess the test–retest reliability, a second e-mail was sent to the healthcare professionals 15 days after the first one. This time interval for the retest was chosen according with Terwee et al[16] and based on previous similar validation studies.[17–19]
2.5. Instrument under validation
2.5.1. Pemberton Happiness Index (PHI)
The PHI was designed to measure happiness in the general population. It consists of 11 items related to remembered well-being, each with a 11-point Likert scale, and 10 items related to experienced well-being (positive and negative events that occurred the day before), with dichotomous response options (yes/no). Although initially developed covering hedonic, eudaimonic, and social aspects of well-being, the remembered well-being scale of PHI is considered unidimensional. The remembered well-being score is calculated with the mean score of the first 11 items (items r1 to r11) and may vary from 0 to 10; the 10 items from the experienced well-being (items e1 to e10) is converted into a single score from 0 (zero positive experiences and 5 negative experiences) to 10 (5 positive experiences and no negative experiences). Thus, PHI produces both remembered and experienced well-being scores, and the sum of the corresponding scores produces a combined well-being index (total PHI). In previous validation studies, Cronbach alpha (internal consistency) was 0.82 to 0.83.[15]
2.6. Validation measures
The following instruments were selected because they have been widely used worldwide and have been previously validated in Brazil. Additionally, they were used as validation measures in the initial validation study of PHI.[15] Both the Satisfaction with Life Scale (SWLS) and the Subjective Happiness Scale (SHS) were chosen to be used in the present study in order to correlate general and social aspects of well-being with the PHI scores (items r1, r2, and r11); the Diener and Emmons’ Positive and Negative Experience Scale (PNES) was used to correlate hedonic negative and positive affect scores with the PHI scores (items r9 and r10); and the Psychological Well-being Scale (PWBS) was used to correlate eudaimonic construct measures with the PHI scores (items r3 to r8). Detailed characteristics of the validation instruments are described below.
2.6.1. Satisfaction with Life Scale (SWLS)
The SWLS consists of 5 items that assess the cognitive component of SWLS that are answered on a 7-point scale ranging from a score of 1 (strongly disagree) to 7 (strongly agree).[20] In the Brazilian validation study,[21] the SWLS was named Escala de Satisfação com a Vida (ESV) and exhibited a Cronbach alpha of 0.89. It is a brief, simple, and multiple-item scale with a single-factor structure, which makes SWLS the most widely used instrument to assess global satisfaction with life. It has been applied in various languages and cultures exhibiting satisfactory psychometric properties.[22,23] It has been validated using Internet surveys.[24]
2.6.2. Diener and Emmons’ Positive and Negative Experience Scale (PNES)
The Diener and Emmons’ PNES assesses positive and negative affect by inquiring as to the extent to which respondents experienced each of the listed emotions (1 none, 7 extremely) in the past days. The original version of the scale consisted of 9 items, 4 for positive affect and 5 for negative affect.[25] To balance the number of items in the 2 subscales, the adjective “optimist” was added to the list of positive affects in the Brazilian version, thus increasing the number of items to 10. In the modified Brazilian Diener and Emmons’ PNES (with addition of the adjective “optimist”), both the negative (α = 0.78) and positive (α = 0.81) experience scales exhibited high internal consistency.[26]
2.6.3. Psychological Well-being Scale (PWBS)
The 6 dimensions of the construct psychological well-being were established based on humanistic-existentialist theories of human development and mental health, resulting in the PWBS,[27] known in Brazil as Escala de Bem-estar Psicológico (EBEP). The scale consists of 36 items and 6 dimensions that assess eudaimonic well-being: positive relations with others, autonomy, environmental mastery, personal growth, purpose in life and self-acceptance.[28] These dimensions are positively associated with measures of satisfaction with life, positive affect, and balanced affect and are negatively associated with measures of negative affect and depression.
2.6.4. Subjective Happiness Scale (SHS)
The SHS is based on the respondents’ subjective assessment of their happiness from their own perspective. It consists of 4 items; the first 2 seek to characterize respondents in absolute (how happy they consider themselves to be) and relative (how happy they feel compared to others) terms. The last 2 items describe happy and unhappy individuals, respectively, and respondents are requested to grade the extent to which the characterizations apply to them. The SHS assesses the respondents’ overall appreciation of life and their personal feelings of happiness. It has been validated in several countries with different types of samples, and the results indicated high internal consistency and adequate test–retest reliability.[29] It has also been validated using Internet surveys.[24]
2.7. Other assessment instruments (developed for the present study)
Sociodemographic data, including age, gender, marital status, religion, and region of origin, among others, along with self-perceived health and beliefs of optimism/pessimism were included in the survey. In addition, the following question addressing perception of happiness was developed for the present survey: “in general, do you consider yourself as…” The possible answers were “very unhappy,” “unhappy,” “more or less happy,” “happy,” and “very happy.”
2.8. Validation procedures
Two phases were included in the validation procedure:
2.8.1. Phase I—cultural adaptation
The PHI previously translated into universal Portuguese by Hervás and Vázquez[15] had 2 versions constructed following the forward and back-translation procedure.[30] We analyzed both and concluded that a single version should be developed. An expert committee composed of 2 doctors, a nurse, a Portuguese teacher, and 2 biomedical researchers evaluated the 2 versions using a standardized form for assessment of semantic/idiomatic, cultural and conceptual equivalence. Of the 6 members of the expert committee, 2 were born in Portugal and the others in Brazil. The members independently assessed each instrument item and scored them relative to each type of equivalence as follows: (−1) nonequivalent; (0) impossible to assess/I do not know; or (+1) equivalent. Changes were suggested for items scored −1 or 0. The panel met at a later time to discuss the assessments and arrived at a consensus version. A pretesting was conducted in Brazilian participants using a cognitive debriefing with think-aloud method (asking each participant what each item means).[31] After the pretesting, the expert committee evaluated all the documents and reached a final consensus. The final adapted version was discussed and approved by the authors of the original scale.[30]
2.8.2. Phase II—psychometric properties
2.8.2.1. Internal consistency
Internal consistency was assessed using Cronbach alpha coefficient, which should be ≥0.70 to be considered adequate.[16]
2.8.2.2. Test–retest reliability
Test–retest reliability was assessed using the intraclass correlation coefficient; values above 0.70 were rated as adequate.[16]
2.8.2.3. Hypothesis testing (construct validity)
Construct validity was assessed by testing the following predefined hypotheses:
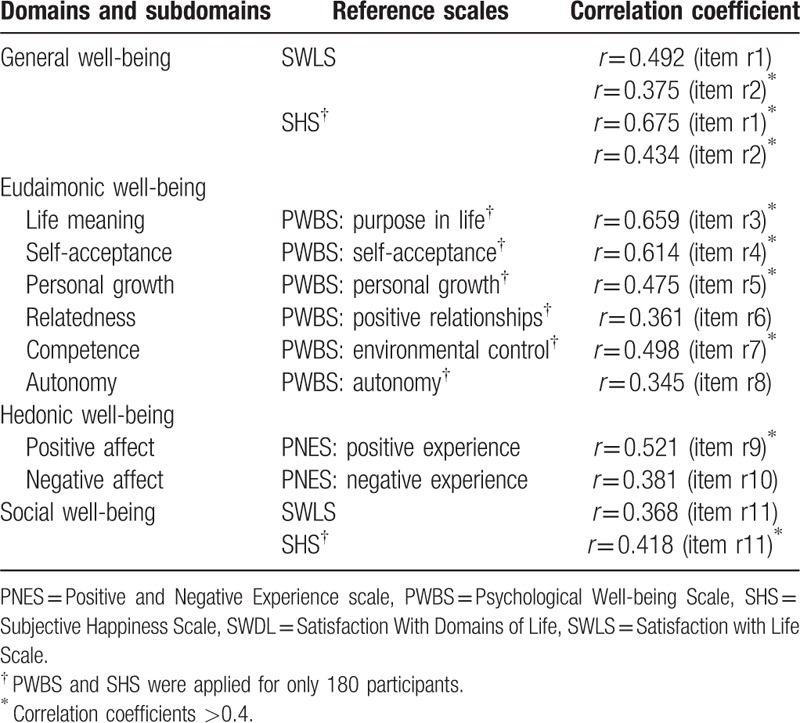
Convergent validity—We expected that the total PHI and remembered PHI scores would be positively correlated with the global scores on the SWLS and SHS and with the PWBS domains. Correlation coefficients higher than 0.4 were expected.[32] In addition, we expected positive correlations with the PNES (positive experiences) and negative correlations with the PNES (negative experiences). In addition, similarly to the original development study, analyses of other possible correlations were planned a priori (as described in Table 1).
Known-group validity—Known-groups method (also known as extreme-groups method) is one of the approaches of evaluating construct validity. An instrument is considered to exhibit known-groups validity if its scores clearly discriminate between groups of participants with known different features.[16,33] In the present study, the participants were inquired as to whether they are pessimistic, neither pessimistic nor optimistic, or optimistic. Our hypothesis was that the happiness scores would be higher among the optimistic participants compared to all others. A second known-group analysis was performed relative to self-perceived happiness; the participants were divided into 2 groups: not happy and happy. Our hypothesis was that the happiness scores would be higher among the participants self-described as happy compared to the unhappy. Although findings can be considered obvious, the addition of this second know-group analysis were considered important by the authors because compared groups were clearly distinct (extreme) in relation to the construct measured (i.e., happiness). These comparisons were performed using parametric t tests and analysis of variance (ANOVA).
Table 1.
Pearson correlations for remembered well-being items and the PHI's remembered score (excluding experienced well-being).
2.8.2.4. Assessment of experienced happiness
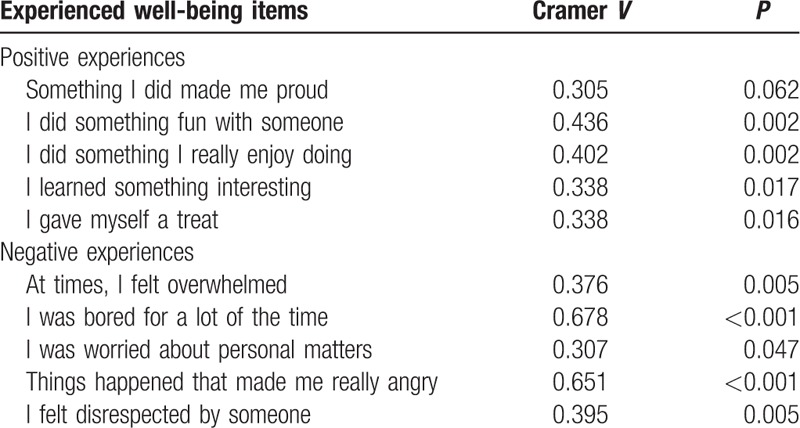
To validate experienced happiness, the participants were asked: “Overall, how did you feel yesterday?” Possible answers were “very bad,” “bad,” “neither bad nor well,” “well,” and “very well.” Then, each item of the experiential PHI (5 items describing negative experiences the day before and 5 items describing positive ones) was correlated with the overall perception of the previous day using Cramer V.
2.8.3. Determination of a cut-off point to identify happy individuals using the PHI
To establish a cutoff point likely to identify happy individuals accurately, a receiver-operating characteristic (ROC) curve was plotted. The happiness criterion was defined by asking the participants to what extent they considered themselves “very unhappy,” “unhappy,” “more or less happy,” “happy,” or “very happy.” Categories “very unhappy,” “unhappy,” and “more or less happy” were analyzed together as “not happy,” and categories “happy” and “very happy” were analyzed together as “happy.” The mutual accuracy of the total PHI, experienced PHI, and remembered PHI scores was compared following DeLong et al.[34] The sensitivity and specificity values and the positive (LR+) and negative (LR−) likelihood ratios were calculated.
Statistical analyses were performed using SPSS (version 20.0; SPSS, Chicago, IL) and MedCalc (version 14.8.1, MedCalc Software, Ostend, Belgium) statistical softwares. P-values below 0.05 were considered statistically significant.
3. Results
3.1. Phase I—cultural adaptation
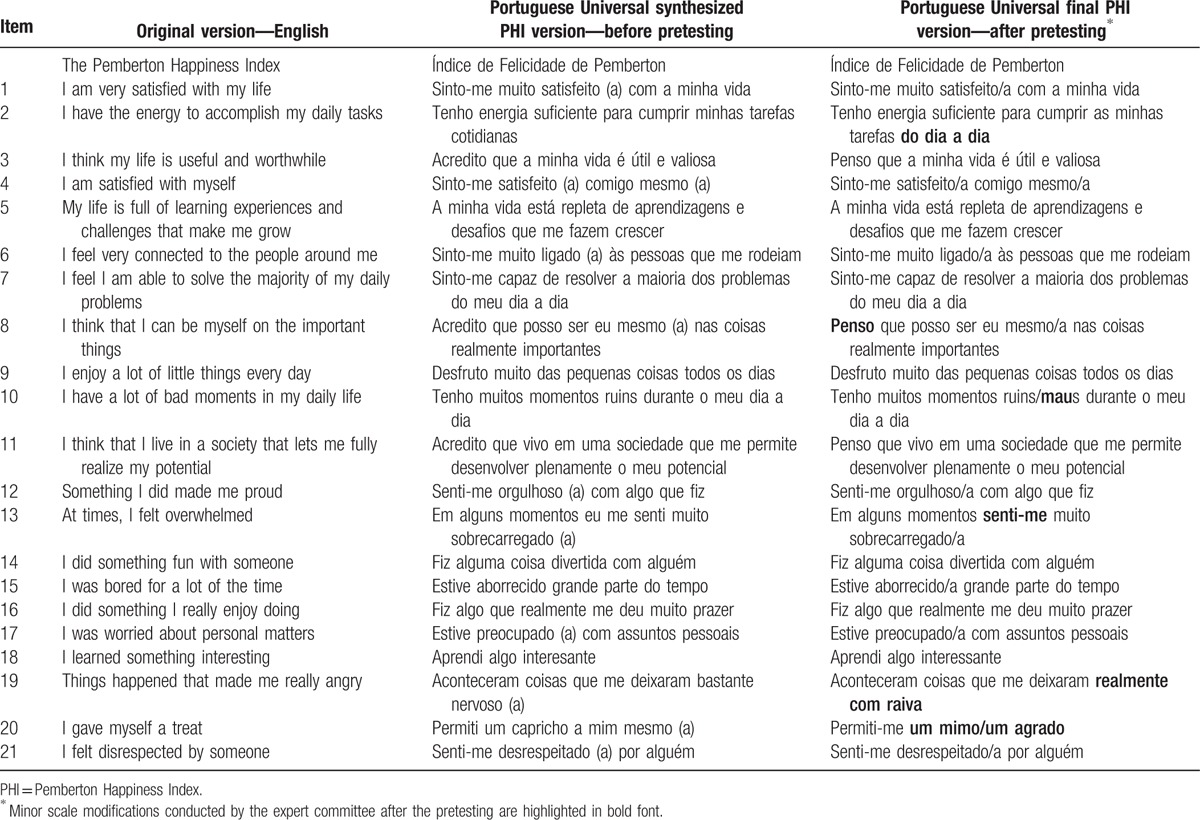
In the pretesting, 10 patients with cancer (2 were illiterate and 4 had low than 8 years of education) and 5 health professionals answered the scale in “paper and pencil” form and 12 health professionals completed the scale using the online survey. In general, both forms were adequately understood by the participants. Of the 21 items, 8 suffered minor modifications by the expert committee after the pretesting. The original, the translated, and the final versions are presented in Table 2; modifications needed are highlighted in the table.
Table 2.
Description of the original English PHI version, synthesized PHI version, and final Portuguese Universal PHI version.
3.2. Phase II—psychometric properties
3.2.1. Sample
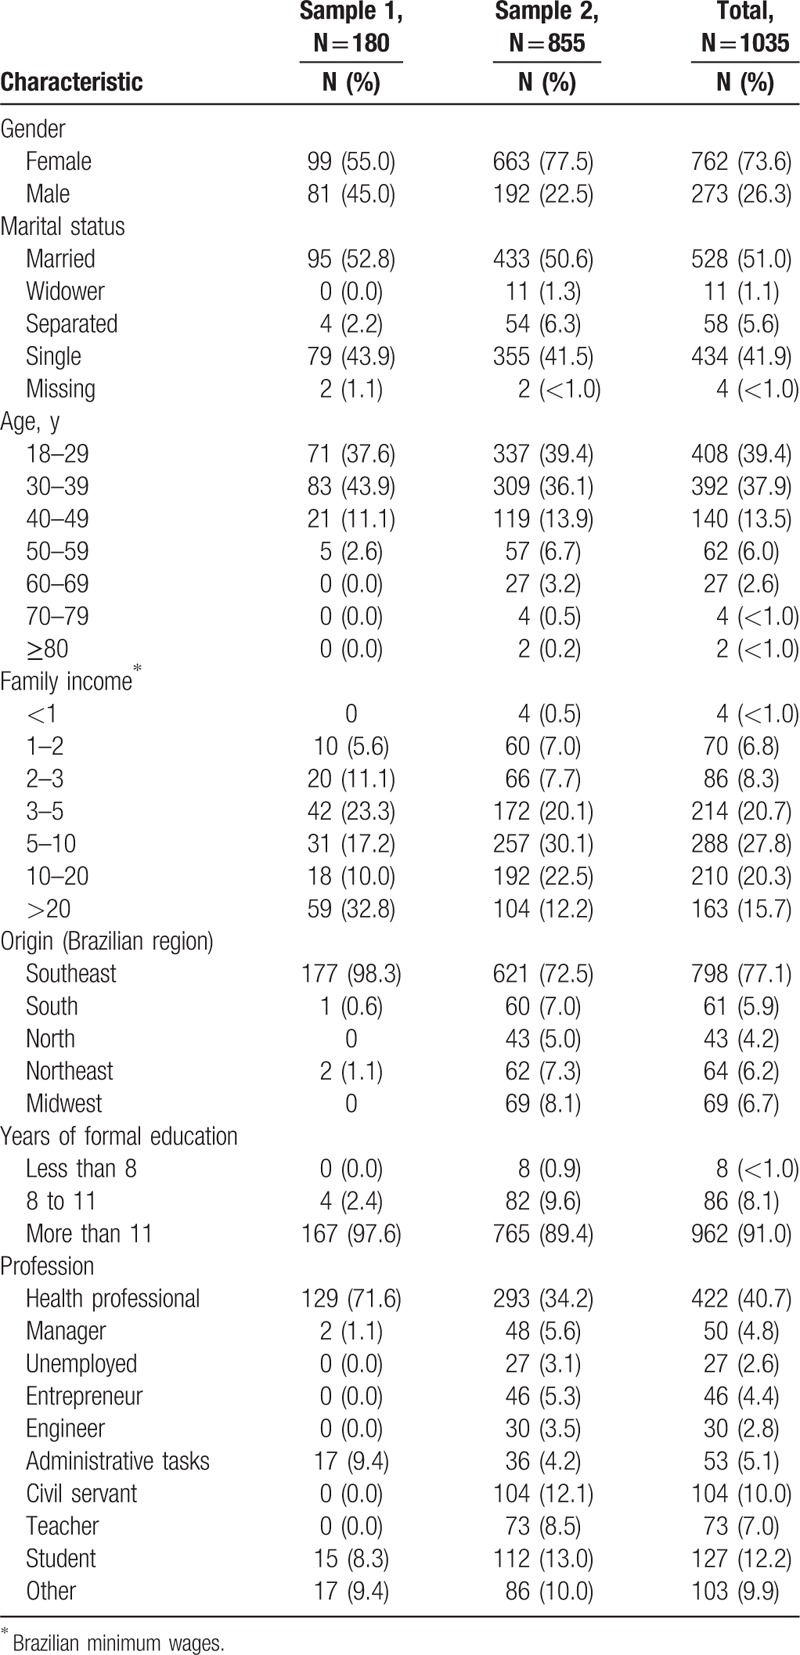
Of the 189 individuals in Sample 1 who responded to the online survey, 180 answered all items, and their data were analyzed (180 of 372, response rate = 48.3%). Most of the participants were female (n = 99, 52.4%), 18 to 39 years old, from Southeastern Brazil and had more than 11 years of formal education. Most of such participants were healthcare professionals (n = 129, 71.6%) (please see Table 3). Regarding Sample 2 (i.e., participants who answered the survey via Facebook), 972 participants accepted to participate in the study and 855 (87.9%) completed all the survey items. Most were female (n = 663, 77.5%), aged 18 to 39 years old, resided in Southeastern Brazil (n = 621, 72.5%), and had more than 11 years of formal education (n = 765, 89.4%), being the largest fraction healthcare professionals (n = 293, 34.2%). Table 3 describes the characteristics of the participants in Samples 1 and 2.
Table 3.
Characteristics of the study participants.
3.2.2. Internal consistency
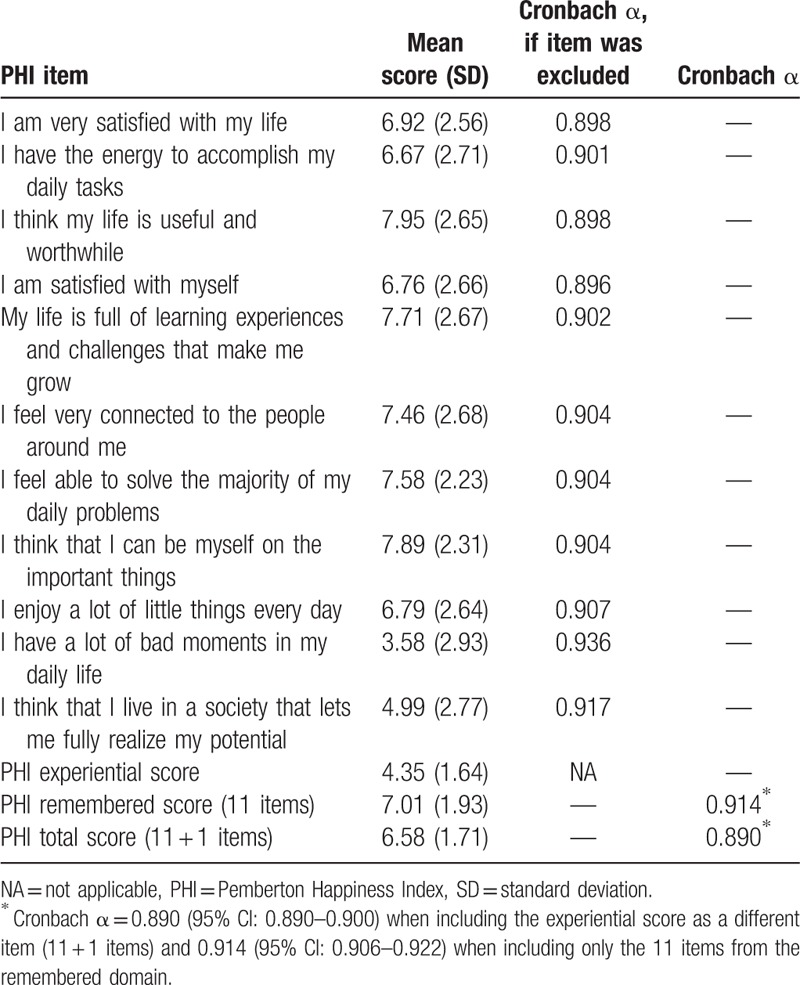
Taken together data from both samples, Cronbach alpha values were considered adequate: its value was 0.890 (95% confidence interval [CI] 0.890–0.900) when including the experienced well-being score as a different item (11 + 1 items) and 0.914 (95% CI: 0.906–0.922) when including only the 11 items from the remembered PHI domain. Only exclusion of items 10 and 11 somewhat improved the instrument's internal consistency (increasing from 0.914–0.936 in the case of item 10 and to 0.917 in the case of item 11) (Table 4).
Table 4.
Mean scores and internal consistency values.
3.2.3. Test–retest
Ninety-four of the participants in Sample 1 (49.7%) answered the survey a second time, 14 to 21 days after the first. The value of the intraclass correlation coefficient was 0.814 (95% CI: 0.733–0.873).
3.2.4. Convergent and divergent validity
The PHI total score was positively correlated with the SWLS global score (r = 0.513, P < 0.001, n = 1032), the SHS global score (r = 0.646, P < 0.001, n = 171), and the PNES positive experience scale (r = 0.523, P < 0.001, n = 1032). As expected, the PHI total score was negatively correlated with the PNES negative experience scale (r = −0.383, P < 0.001, n = 1032). The correlations between the PHI total score and the PWS domains varied from 0.284 (autonomy) to 0.699 (purpose in life) (data not shown). In regard to the correlations hypothesized a priori between specific PHI items and the other instruments, 9 out of 14 such correlations exhibited r > 0.4; however, the r values of the other correlations were close to 0.4 (Table 1).
3.2.5. Known-groups validity
The mean remembered PHI and total PHI scores differed significantly according to the groups of participants in regard to the perception of optimism/pessimism and self-reported happiness, as was hypothesized (Table 5).
Table 5.
Known-group validity.

3.2.6. Assessment of experienced happiness
The Cramer V coefficients between satisfaction with the previous day and the 10 items assessing experienced well-being (5 positive and 5 negative) were all above 0.3; only the item “Something I did made me proud” had a nonsignificant P-value (P = 0.062). Two items corresponding to negative experiences were strongly associated with self-perceived satisfaction with the previous day: “I was bored for a lot of the time” (Cramer V = 0.678, P < 0.001) and “Things happened that made me really angry” (Cramer V = 0.651, P < 0.001) (Table 6).
Table 6.
Cramer V between satisfaction with the events of the day before and the 10 items on experienced well-being (5 negative and 5 positive) (n = 96).
3.2.7. ROC curves
The area under the curve (AUC) values of the ROC curves plotted to detect happiness (yes vs no) were as follows: experienced PHI (AUC = 0.702, 95% CI: 0.671–0.733), remembered PHI (AUC = 0.780, 95% CI: 0.750–0.807), and total PHI (AUC = 0.747, 95% CI: 0.717–0.776). When compared, the AUC for remembered PHI was significantly larger compared to those for both experienced PHI and total PHI (P < 0.001 in both) (Fig. 1). The cutoff point with greatest diagnostic accuracy was >7 for remembered PHI (sensitivity = 69.2%, specificity = 78.2%, positive LR = 3.19, and negative LR = 0.39).
Figure 1.
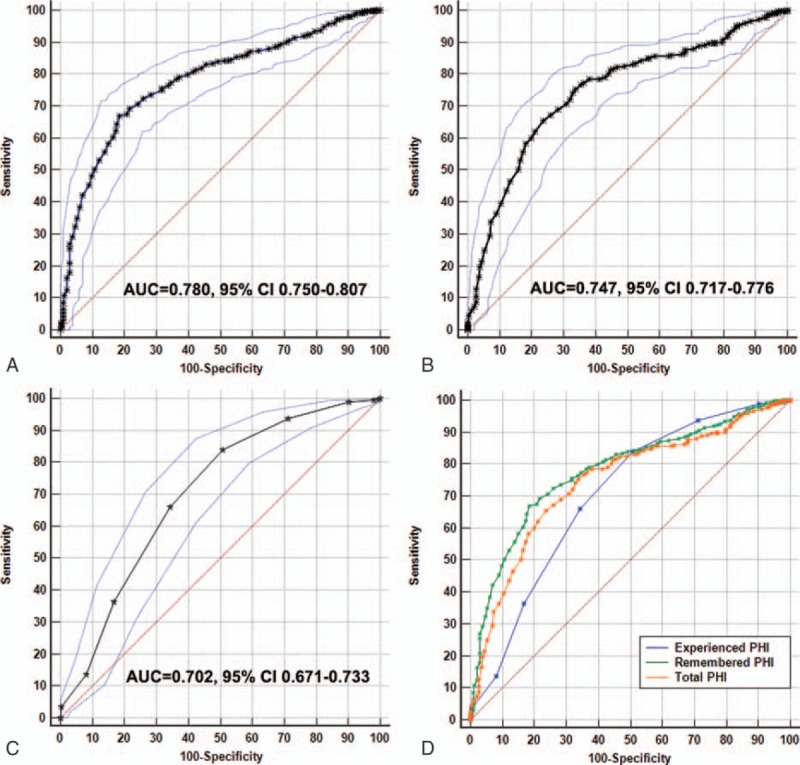
Discrimination of remembered PHI, experienced PHI, and total PHI scores. These receiver-operating characteristic (ROC) curves plot sensitivity versus 1-specificity for detecting individuals classified as happy: (A) remembered PHI score, (B) total PHI score, (C) experienced PHI score, (D) comparison between PHI scores. The area under the curve (AUC) values with 95% confidence intervals are shown in A–C. In D, experienced PHI (green) has the largest area under the curve compared to the other scores (P < 0.001 for both comparisons).
4. Discussion
In the present study, the Universal Portuguese version of PHI was first culturally adapted and then validated in a large sample from the Brazilian population. The scale's psychometric properties were considered adequate in light of classic psychometrics.
Internet research is considered a cost- and time-efficient way to access a large number of participants.[24] Moreover, compared to traditional paper-and-pencil formats, Internet data collection has the potential to reduce loss of data and increase participant's privacy, both important characteristics in questionnaire validation studies. In the Sample 2 of our study, 3 of the authors disclosed the invitation to participate in the study on their personal Facebook pages and asked their friends to share it. Although the dissemination of survey links by e-mail or through online social networks sharing is quite usual, this strategy is a rather unusual approach to the validation of instruments for health assessment. By sharing the invitation with the authors’ friends and requesting the latter to share it with their own friends, the survey link quickly spread, and 855 individuals had fully answered the survey 15 days later. Howell et al[24] compared the quality of data collected using “paper-and-pencil,” computer-based, and Internet surveys using different measures of subjective well-being and found equivalent results between the different methods of data collection. Similarly, Internet surveys were shared on social-networking Web sites. Given the increasing prevalence of online social networks, future questionnaire validation studies may take advantage of fast dissemination of online surveys. On the other hand, that fact can explain the large proportion of healthcare professionals in the final Sample 2, as the 3 authors are healthcare professionals, and so this potential bias and limitation should be addressed and overcome in future studies.
Regarding the psychometric properties of the Universal Portuguese version of the PHI, the results are quite similar to those reported in the original study of Hervás and Vázquez.[15] The scale was originally developed in Spanish and was simultaneously translated and validated in other 6 languages (i.e., German, English, Swedish, Russian, Turkish, and Japanese) to select its final items from data gathered in 9 countries. The Cronbach alpha values observed in our study (0.890 and 0.914) were very similar to those reported in the original study, which ranged from 0.82 to 0.93. Moreover, in general, the convergent/divergent validity and known-groups indices were considered adequate. Interestingly, and unlike the initial validation study,[15] we conducted a known-group validation analysis relative to the perceptions of happiness and optimism/pessimism.
Population-based intervention strategies within the political–social setting should be employed; and such strategies require adequate tools to measure the resulting benefits. The cut-off point established in the present study for the identification of happy individuals might be useful in future population-based studies using PHI as an instrument to assess happiness. In this case, we suggest that remembered PHI scores higher than 7 should be tentatively considered to identify a “happy” Brazilian individual. However, further studies are needed to confirm the validity of this cut-off value in different populations. In addition to the cut-off point, the identification of the minimal clinically important difference (MCID) might also be useful.
The present study had some limitations. The first limitation derives from the representativeness of the included sample, with inclusion of large proportion of participants with high socioeducational levels (most healthcare professionals), which does not correspond to the Brazilian general population. Although large samples can be recruited fast using online social networks with low cost, nonrepresentative samples are a potential limitation. However, we believe that this limitation is minor in validation studies, but potentially more relevant in intervention or cross-cultural studies. Another study limitation is the lack of a Portuguese sample. Although our PHI version is developed to be valid both in Brazil and Portugal (i.e., Universal Portuguese version), it was not tested in participants from Portugal. Thus, currently, it should be considered valid for use only in Brazil, and a subsequent study in Portugal is warranted.
We conclude that the Universal Portuguese version of the PHI is valid and reliable for use in the Brazilian population using online surveys. The cut-off point to define a happy individual was defined, but the MCID should be investigated in future studies.
Acknowledgments
We thank Helena Marujo and Luis Miguel Neto for their help in previous stages of this paper and Wilson Marçal, Céline Pinheiro, Ricardo Filipi Alves Costa, and Eliane Marçon Barroso for their contribution to the expert panel. We also would like to thank the statistician Cleyton Zanardo de Oliveira for assistance in the statistical analyses.
Footnotes
Abbreviations: ANOVA = analysis of variance, AUC = area under the curve, PHI = Pemberton Happiness Index, PNES = Positive and Negative Experience Scale, PWS = Psychological Well-being Scale, ROC = receiver-operating characteristic, SHS = Subjective Happiness Scale, SWLS = Satisfaction with Life Scale, UN = United Nations.
Funding: This project was supported by Barretos Cancer Hospital internal research funds (PAIP). The funder had no role in the design of the study, analyses or interpretation of data, and in the writing of the manuscript.
Authors’ contributions: BSRP, MGC, and CEP participated in the design of the study. BSRP, MGC, and CEP collected and analyzed the data. All authors participated in the interpretation of the results, the writing of the manuscript, and review and approval of the final manuscript. All authors had full access to all the data, including statistical reports and tables, in the study and can take responsibility for the integrity of the data and the accuracy of the data analysis.
The authors have no conflicts of interest to disclose.
References
- 1.Garaigordobil M. Predictor variables of happiness and its connection with risk and protective factors for health. Front Psychol 2015; 6:1176. [DOI] [PMC free article] [PubMed] [Google Scholar]
- 2.Dambrun M, Ricard M, Després G, et al. Measuring happiness: from fluctuating happiness to authentic-durable happiness. Front Psychol 2012; 3:16. [DOI] [PMC free article] [PubMed] [Google Scholar]
- 3.Diener E, Oishi S, Lucas RE. Lopez SJ, Snyder CR. Subjective well-being: the science of happiness and life satisfaction. Oxford University Press, The Oxford Handbook of Positive Psychology. Oxford, United Kingdom:2009. [Google Scholar]
- 4.Tuchtenhagen S, Bresolin CR, Tomazoni F, et al. The influence of normative and subjective oral health status on schoolchildren's happiness. BMC Oral Health 2015; 15:15. [DOI] [PMC free article] [PubMed] [Google Scholar]
- 5.Dfarhud D, Malmir M, Khanahmadi M. Happiness & health: the biological factors—systematic review article. Iran J Public Health 2014; 43:1468–1477. [PMC free article] [PubMed] [Google Scholar]
- 6.Richards J, Jiang X, Kelly P, et al. Don’t worry, be happy: cross-sectional associations between physical activity and happiness in 15 European countries. BMC Public Health 2015; 15:53. [DOI] [PMC free article] [PubMed] [Google Scholar]
- 7.Happiness Towards a Holistic Approach to Development. 2013. Available at https://documents-dds-ny.un.org/doc/UNDOC/GEN/N13/208/17/PDF/N1320817.pdf?OpenElement Accessed August 25, 2016. [Google Scholar]
- 8.Solymos GMB. A centralidade da pessoa na intervenção em nutrição e saúde. Estud Av 2006; 20:109–122. [Google Scholar]
- 9.Abele AE. Pursuit of communal values in an agentic manner: a way to happiness? Front Psychol 2014; 5:1320. [DOI] [PMC free article] [PubMed] [Google Scholar]
- 10.Kalmijn WM, Arends LR, Veenhoven R. Happiness Scale Interval Study. Methodological considerations. Soc Indic Res 2011; 102:497–515. [DOI] [PMC free article] [PubMed] [Google Scholar]
- 11.Bourne PA, Morris C, Eldemire-Shearer D. Re-testing theories on the correlations of health status, life satisfaction and happiness. N Am J Med Sci 2010; 2:311–319. [DOI] [PMC free article] [PubMed] [Google Scholar]
- 12.Bruno M-A, Bernheim JL, Ledoux D, et al. A survey on self-assessed well-being in a cohort of chronic locked-in syndrome patients: happy majority, miserable minority. BMJ Open 2011; 1:e000039. [DOI] [PMC free article] [PubMed] [Google Scholar]
- 13.Feicht T, Wittmann M, Jose G, et al. Evaluation of a seven-week web-based happiness training to improve psychological well-being, reduce stress, and enhance mindfulness and flourishing: a randomized controlled occupational health study. Evid Based Complement Alternat Med 2013; 2013:676953. [DOI] [PMC free article] [PubMed] [Google Scholar]
- 14.Schütz E, Sailer U, Al Nima A, et al. The affective profiles in the USA: happiness, depression, life satisfaction, and happiness-increasing strategies. PeerJ 2013; 1:e156. [DOI] [PMC free article] [PubMed] [Google Scholar]
- 15.Hervás G, Vázquez C. Construction and validation of a measure of integrative well-being in seven languages: the Pemberton Happiness Index. Health Qual Life Outcomes 2013; 11:66. [DOI] [PMC free article] [PubMed] [Google Scholar]
- 16.Terwee CB, Bot SDM, de Boer MR, et al. Quality criteria were proposed for measurement properties of health status questionnaires. J Clin Epidemiol 2007; 60:34–42. [DOI] [PubMed] [Google Scholar]
- 17.Nan H, Ni M, Lee P, et al. Psychometric evaluation of the Chinese version of the Subjective Happiness Scale: evidence from the Hong Kong FAMILY Cohort. Int J Behav Med 2014; 21:646–652. [DOI] [PMC free article] [PubMed] [Google Scholar]
- 18.Lee Y, Liu S, Huang H, et al. Validity and reliability of the Chinese version of the Short Form of Quality of Life Enjoyment and Satisfaction Questionnaire (Q-LES-Q-SF). Qual Life Res 2014; 23:907–916. [DOI] [PubMed] [Google Scholar]
- 19.Joseph S, Linley P, Harwood J, et al. Rapid assessment of well-being: the Short Depression-Happiness Scale (SDHS). Psychol Psychother 2004; 77:463–478. [DOI] [PubMed] [Google Scholar]
- 20.Diener E, Emmons RA, Larsen RJ, et al. The Satisfaction with Life Scale. J Pers Assess 1985; 49:71–75. [DOI] [PubMed] [Google Scholar]
- 21.Gouveia V, Barbosa G, Andrade E, et al. Medindo a satisfação com a vida dos médicos no Brasil. J Bras Psiquiatr 2005; 54:298–305. [Google Scholar]
- 22.Pavot W, Diener E, Colvin CR, et al. Further validation of the Satisfaction with Life Scale: evidence for the cross-method convergence of well-being measures. J Pers Assess 1991; 57:149–161. [DOI] [PubMed] [Google Scholar]
- 23.Pavot W, Diener E. Review of the Satisfaction with Life Scale. Psychol Assess 1993; 5:164–172. [Google Scholar]
- 24.Howell RT, Rodzon KS, Kurai M, et al. A validation of well-being and happiness surveys for administration via the Internet. Behav Res Methods 2010; 42:775–784. [DOI] [PubMed] [Google Scholar]
- 25.Diener E, Emmons RA. The independence of positive and negative affect. J Pers Soc Psychol 1984; 47:1105–1117. [DOI] [PubMed] [Google Scholar]
- 26.Chaves S. Valores como preditores do bem-estar subjetivo. 2003. file:///C:/Users/posgraduacao03/Downloads/Chaves_S._S._S._2003(1).pdf. [Google Scholar]
- 27.Ryff CD. Happiness is everything, or is it? Explorations on the meaning of psychological well-being. J Pers Soc Psychol 1989; 57:1069–1081. [Google Scholar]
- 28.Machado W, Bandeira D, Pawlowski J. Validation of the Psychological Well-being Scale in an undergraduate student's sample. Aval Psicol 2013; 12:263–272. [Google Scholar]
- 29.Lyubomirsky S, Lepper HS. A measure of subjective happiness: preliminary reliability and construct validation. Soc Indic Res 1999; 46:137–155. [Google Scholar]
- 30.Guillemin F, Bombardier C, Beaton D. Cross-cultural adaptation of health-related quality of life measures: literature review and proposed guidelines. J Clin Epidemiol 1993; 46:1417–1432. [DOI] [PubMed] [Google Scholar]
- 31.Sudman S, Bradburn N, Schwarz N. Thinking About Answers: The Application of Cognitive Processes to Survey Methodology. 1st ed.San Francisco, CA: Jossey-Bass; 1996. [Google Scholar]
- 32.Fayers P, Machin D. Quality of Life: The Assessment, Analysis and Interpretation of Patient-Reported Outcomes. 2nd ed.Chichester, UK: John Wiley & Sons; 2007. [Google Scholar]
- 33.Kerlinger F. Foundations of Behavioral Research: Educational and Psychological Inquiry. 2nd ed.New York: Holt, Rinehart & Winston; 1973. [Google Scholar]
- 34.DeLong ER, DeLong DM, Clarke-Pearson DL. Comparing the areas under two or more correlated receiver operating characteristic curves: a nonparametric approach. Biometrics 1988; 44:837–845. [PubMed] [Google Scholar]


