Abstract
Cannabisol (1), a unique dimer of Δ9-tetrahydrocannabinol (Δ9-THC) with a methylene bridge, was isolated from Cannabis sativa. This is the first example of a C-bridged dimeric cannabinoid. The structure of 1 was unambiguously deduced by HRESIMS, GCMS, and NMR spectroscopy. A plausible biogenesis of 1 is described.
Keywords: Cannabis sativa, Cannabisol, C-bridged dimer
Cannabis, the only genus in the plant family Cannabaceae, consists of only one highly variable species: Cannabis sativa L. Other previously reported species, for example C. indica Lam. and C. ruderalis Janisch, are now recognized as varieties of C. sativa L. C. sativa L. is not only one of the oldest medicinal plants but also the most widely used illicit drug in the world. More than 535 constituents have been isolated and/or identified from C. sativa L.,1 with Δ9-THC being recognized as the main biologically active component.2 The chemotypes of C. sativa L. can be divided into drug type (marijuana), intermediate type (the source for hashish), and fiber type (hemp), with the Δ9-THC content ranging from 1 to 20%, 0.3 to 1.0%, and <0.3%, respectively.3,4 The availability of high potency marijuana on the illicit market with unprecedented Δ9-THC concentrations (>20% by dry weight)5 prompted our phytochemical investigation of this high potency variety. Herein we describe the isolation and structure elucidation of a dimeric cannabinoid, named cannabisol (1) from a high potency variety of C. sativa L., seized in the USA, as well as its possible biogenetic origin. Thirty six potency monitoring plant samples with high CBG content (1.4–3.8%) were combined (630 g) and sequentially extracted with hexanes, ethyl acetate, and methanol at room temperature. The extracts were evaporated under reduced pressure to afford hexanes (100.7 g), ethyl acetate (5.4 g), and methanol (16.0 g) extracts. The hexanes extract (100.7 g) was subjected to vacuum liquid chromatography (VLC) on flash silica gel eluted with hexanes, EtOAc, and MeOH gradients. Fractions eluted with hexanes were combined according to their TLC profiles to afford two fractions: F1 (33 g) and F2 (44 g). The extract obtained after fractionation of F1 over flash silica gel (hexanes) and pooling of fractions with Rf-values higher than that of Δ9-THC according to TLC (hexanes/EtOAc, 9:1), was purified by flash silica gel column chromatography (hexanes/CHCl3, 1:1), yielding 1 (10 mg).
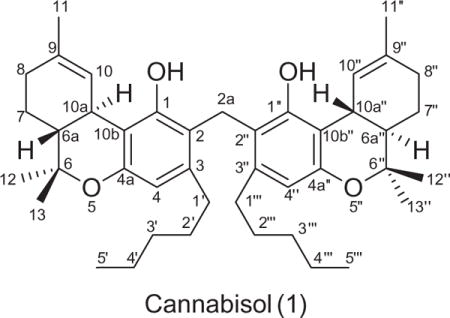
Cannabisol (1),6 was obtained as a brown solid and displayed a protonated molecular ion [M+H]+ at m/z 641.4528 (calcd 641.4570 for C43H60O4 + H) in the positive mode HRESIMS, corresponding to a molecular formula of C43H60O4. The 13C NMR spectrum, however, displayed only 22 resonances, suggesting the possibility of a dimeric structure (Table 1). A relatively low intensity sp3 methylene resonance at δC 24.2 (C-2a) was observed in the DEPT-135 and 13C NMR spectra, and showed HMQC correlation with a proton singlet at δH 3.95 (2H, H-2a) in the 1H NMR spectrum. Rest of the NMR spectroscopic data were close to those of Δ9-THC7 except for the resonance of one of the aromatic methine in Δ9-THC that was replaced with a quaternary carbon in 1. Due to symmetric nature of the molecule, the NMR data of only one unit are discussed.
Table 1.
1H and 13C NMR spectroscopic data for cannabisol (1) (400 MHz, δ in ppm, J in Hz, CDCl3)
| Carbon | δC | δH (mult, J) |
|---|---|---|
| 1/1″ | 155.2 | – |
| 2/2″ | 112.4 | – |
| 3/3″ | 141.0 | – |
| 4/4″ | 111.6 | 6.35 (s) |
| 4a/4a″ | 154.0 | – |
| 6/6″ | 77.4 | – |
| 6a/6a″ | 46.1 | 1.66 (m) |
| 7/7″ | 25.2 | 1.89 (m) |
| 8/8″ | 31.3 | 2.12 (m) |
| 9/9″ | 134.1 | – |
| 10/10″ | 124.3 | 6.11 (s) |
| 10a/10a″ | 34.0 | 3.11 (d, 10.8) |
| 10b/10b″ | 111.1 | – |
| 11/11″ | 23.5 | 1.60 (s) |
| 12/12″ | 19.4 | 1.05 (s) |
| 13/13″ | 27.6 | 1.39 (s) |
| 1′/1″ | 34.2 | 2.64 (m) |
| 2′/2″ | 30.5 | 1.66 (m) |
| 3′/3″ | 32.0 | 1.34 (m) |
| 4′/4″ | 22.7 | 1.34 (m) |
| 5′/5″ | 14.2 | 0.88 (t, 6.6) |
| 2a | 24.2 | 3.95 (s) |
| OH | – | 5.61 (s) |
The DEPT NMR spectrum resolved the 22 carbon resonances as four methyl, seven methylene, four methine, and seven quaternary carbons. The 13C and 1H NMR spectra of 1 displayed resonances for three tertiary methyls [δC 19.4/δH 1.05 (s), C-12; δC 27.6/δH 1.39 (s), C-13; δC 23.5/δH 1.60 (s), C-11)], one primary methyl [δC 14.2/δH 0.88 (t, J = 6.6 Hz), C-5′], one aromatic methine [δC 111.6/δH 6.35 (s), C-4], and one olefinic methine [δC 124.3/δH 6.11 (s), C-10]. Furthermore, the resonances for one hydroxyl group [δH 5.61 (s)], two aliphatic methines [δC 46.1/δH 1.66 (m), C-6a; δC 34.0/δH 3.11 (d, J = 10.8 Hz), C-10a], and seven aliphatic methylenes [δC 22.7/δH 1.34 (m), C-4′; δC 32.0/δH 1.34 (m), C-3′; δC 30.5/δH 1.60 (m), C-2′; δC 34.2/δH 2.64 (m), C-1′; δC 25.2/δH 1.89 (m), C-7; δC 31.3/δH 2.12 (m), C-8; δC 24.2/δH 3.95 (s), C-2a] were observed. The 13C NMR spectrum, in association with the DEPT-135 spectrum, displayed six aromatic and/or olefinic quaternary carbons (δC 111.1, 112.4, 134.1, 141.0, 154.0, 155.2) and one oxyquaternary aliphatic carbon (δC 77.4). Analysis of the 1H–1H COSY, HMQC, and HMBC spectra led to partial structures A–F (Fig. 1).
Figure 1.
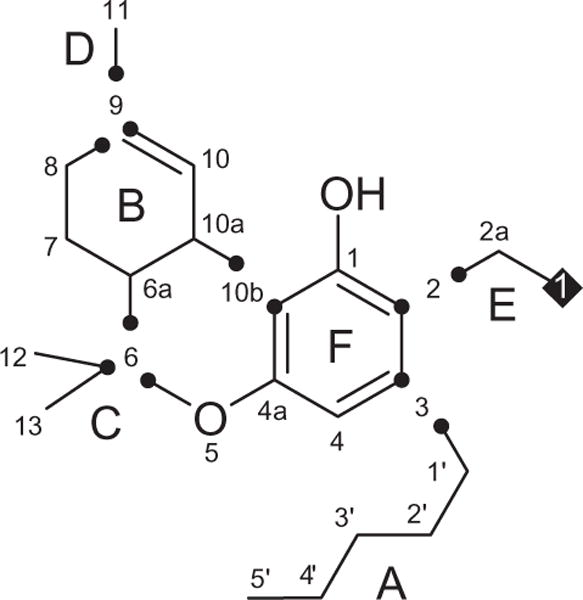
Partial structures of 1.
The following HMBC correlations (Fig. 2) located partial structure A at C-3 [δH/C 2.64 (H-1′)/112.4, 141.0, 111.6 (C-2, 3, 4); δH/C 1.60 (H-2′)/141.0 (C-3)], B and C at C-6 [δH/C 1.66 (H-6a)/77.4, 19.4, 27.6 (C-6, 12, 13); δH/C 1.39, 1.05 (H-12, 13)/77.4, 46.1 (C-6, 6a)], B at C-10b [δH/C 6.11 (H-10)/111.1 (C-10b)], and D at C-9 [δH/C 1.60 (H-11)/31.3, 134.1, 124.3 (C-8, 9, 10]. Further correlations revealed the position of the C-9/C-10 double bond [δH/C 1.60 (H-11)/134.5, 124.3 (C-9, 10); δH/C 6.11 (H-10)/31.3, 124.3, 23.5 (C-8, 9, 11)], hydroxyl at C-1 [δH/C 5.61(OH)/155.2, 112.4, 111.1 (C-1, 2, 10b)], and an aromatic methine at C-4 [δH/C 6.35 (H-4)/112.4, 154.0, 111.1, 34.2 (C-2, 4a, 10b, 1′)]. The vicinal methine resonances at δH 3.11 (d, J = 10.8 Hz, H-10a) and 1.66 (m, H-6a) displayed a coupling constant of J10a–6a = 10.8 Hz, indicating a trans-configuration, and reflecting Δ9-THC units with a quaternary carbon at C-2 (δC 112.4).
Figure 2.
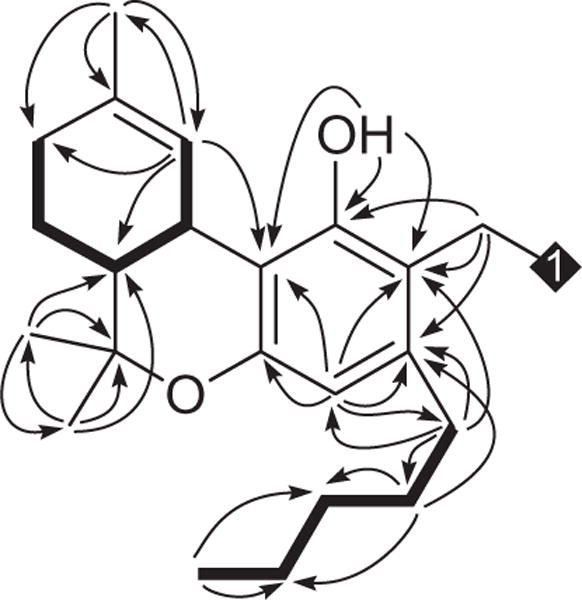
HMBC (→) and COSY (–) correlations of 1.
The absence of correlations in the 1H–1H COSY spectrum for CH2-2a indicated an isolated moiety (partial structure E in Fig. 1), while the HMBC correlations (Fig. 2) of 2H–2a (δH 3.95) with C-1/C-1″ (δC 155.2), C-2/C-2″ (δC 112.4), and C-3/C-3″ (δC 141.0) revealed the position of C-2a bridging two Δ9-THC units at C-2/2″. The associations of δH 3.95 (2H-2a) in the ROESY spectrum (Fig. 3) with δH 5.61 (OH/OH″) and δH 2.64 (2H-1′/2H-1‴) further confirmed the sandwiched position of methylene C-2a. GC–MS analysis8 of 1 displayed two chromatographic peaks with m/z 314 and 328 molecular ions [M]+, indicating Δ9-THC and 2-methyl-Δ9-THC, respectively.
Figure 3.
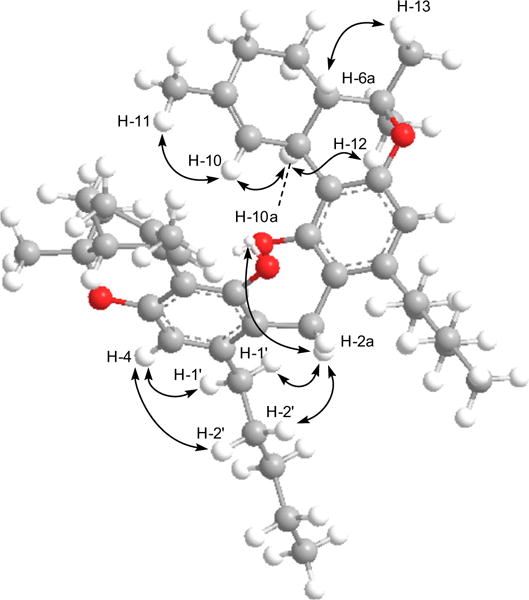
Computer generated lowest energy three-dimensional diagram and selected ROESY correlations of 1.
A plausible biogenetic pathway for the formation of 1 includes initial decarboxylation of acid functionality of Δ9-THCA followed by nucleophilic attack of resulting anion on the electrophilic carbonyl carbon of the coenzyme A ester of Δ9-THCA to form 1a, which enzymatically reduced to the methylene bridge between the two Δ9-THC units (Fig. 4).
Figure 4.
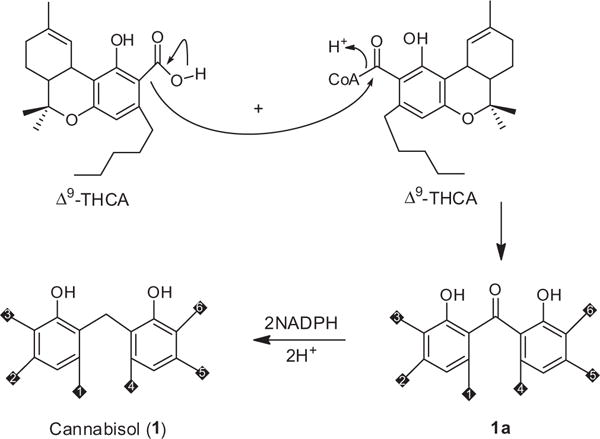
Proposed biogenetic pathway for 1.
Supplementary Material
Acknowledgments
The project described was supported in part by Grant No. 5P20RR021929 from the National Center for Research Resources. The project has been funded in part with Federal funds from the National Institute on Drug Abuse, National Institutes of Health, Department of Health and Human Services, under Contract No. N01DA-10-7773. The content is solely the responsibility of the authors and does not necessarily represent the official views of the National Center for Research Resources or the National Institutes of Health. We are grateful to Dr. Bharathi Avula for conducting the mass data.
Footnotes
Supplementary data
Supplementary data associated with this article can be found, in the online version, at http://dx.doi.org/10.1016/j.tetlet.2012.04. 139.
References and notes
- 1.(a) ElSohly MA, Slade D. Life Sci. 2005;78:539–548. doi: 10.1016/j.lfs.2005.09.011. [DOI] [PubMed] [Google Scholar]; (b) Radwan M, ElSohly MA, Slade D, Ahmed SA, Khan IA, Ross SA. J Nat Prod. 2009;72(5):906–911. doi: 10.1021/np900067k. [DOI] [PMC free article] [PubMed] [Google Scholar]; (c) Pollastro F, Orazio T, Allara M, Munoz E, Di Marzo V, De Petrocellis L, Appendino G. J Nat Prod. 2011;74(9):2019–2022. doi: 10.1021/np200500p. [DOI] [PubMed] [Google Scholar]
- 2.Williamson EM, Evans FJ. Drugs. 2000;60:1303–1314. doi: 10.2165/00003495-200060060-00005. [DOI] [PubMed] [Google Scholar]
- 3.Clarke RC, Watson DP. In: In Cannabis and Cannabinoids: Pharmacology, Toxicology, and Therapeutic Potential. Grotenhermen F, Russo E, editors. The Haworth Press, Inc.; Binghamton, New York: 2002. pp. 3–14. Chapter 1-Botany of Natural Cannabis Medicines. [Google Scholar]
- 4.Clarke RC, Watson DP. In: In Marijuana and the Cannabinoids. ElSohly MA, editor. Humana Press Inc; Totowa, New Jersey: 2007. pp. 1–16. Chapter 1-Cannabis and Natural Cannabis Medicines. [Google Scholar]
- 5.ElSohly MA, Ross SA, Mehmedic Z, Arafat R, Yi B, Banahan BF. J Forensic Sci. 2000;45:24–30. [PubMed] [Google Scholar]
- 6.Cannabisol (1). Brown powder; (c 4.4, CHCl3); UV (CHCl3) λmax (log ɛ) 284 (3.90); NMR: see Table 1; ESIMS m/z 641 [M+H]+, 663 [M+Na]+, 679 [M+K]+; HRESIMS m/z 641.4528 [M+H]+ (calcd 641.4570), 663.4371 [M+Na]+ (calcd 663.4389), 679.4009 [M+K]+ (calcd 679.4129).
- 7.Ahmed SA, Ross SA, Slade D, Radwan MM, Zulfiqar F, Matsumoto RR, Xu Y-T, Viard E, Speth RC, Karamyan VT, ElSohly MA. J Nat Prod. 2008;71:1119. doi: 10.1021/np070454a. Erratum to article in J. Nat. Prod., 2008, 71, 536–542. [DOI] [PMC free article] [PubMed] [Google Scholar]
- 8.GC–MS analysis was carried out on a ThermoQuest Trace 2000 GC, equipped with a single split/splitless capillary injector, a ThermoQuest AS2000 autosampler, and a Phenomenex ZB-5 column (30 m × 0.25 mm × 0.25 μm), interfaced to a ThermoQuest–Finnigan Trace MS quadrupole detector. The injector temperature was 250 °C, and 1 μL injection was performed in splitless mode, with the splitless time set at 60 s, the split flow set at 50 mL/min, and the septum purge valve set to close for 60 s after the injection occurred. The oven temperature was raised from 70 to 270 °C (hold 20 min) at a rate of 5 °C/min, for a total run time of 60 min; the transfer line temperature was 250 °C. Helium was used as the carrier gas at a constant pressure of 20 psi. The mass spectrometer was operated in the electron impact mode (EI+) and scanned from 40 to 800 amu at 1 scan/s, with an ionizing voltage of 70 eV and an emission current of 350 μA. Data were recorded using an IBM Netfinity 3000 workstation with Microsoft Windows NT 4.0 operating system (Build 1381, Service pack 6) and Xcalibur data acquisition and analysis software (Version 1.2).
Associated Data
This section collects any data citations, data availability statements, or supplementary materials included in this article.


