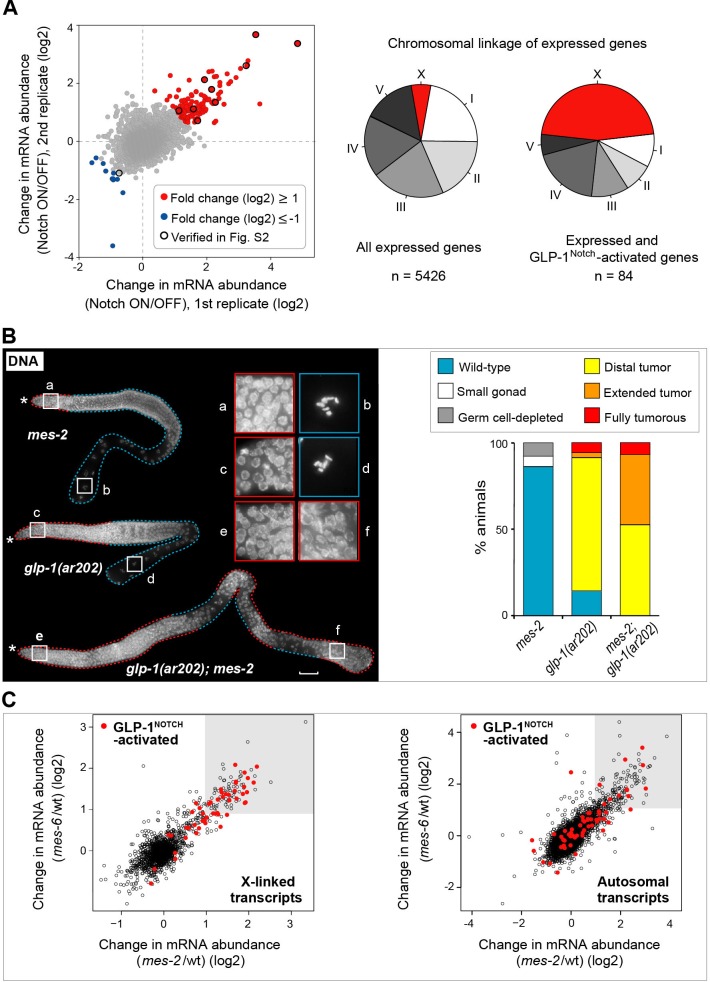
Figure 2. GLP-1Notch and PRC2 regulate common targets and are functionally connected.
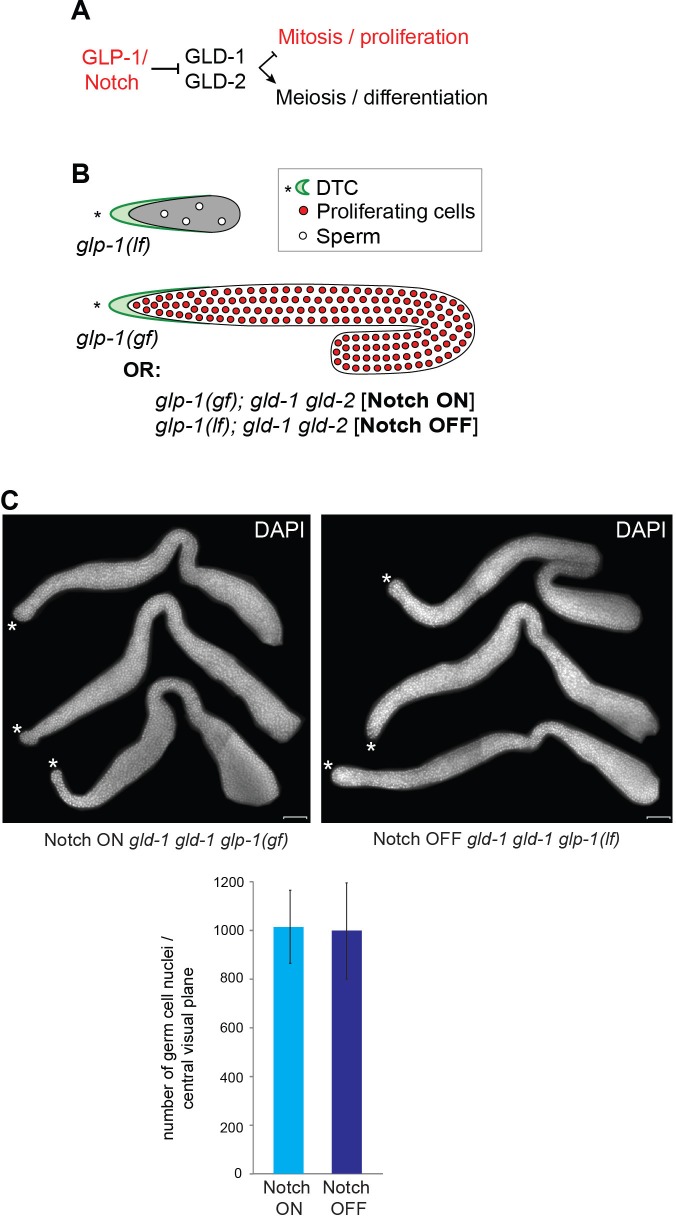
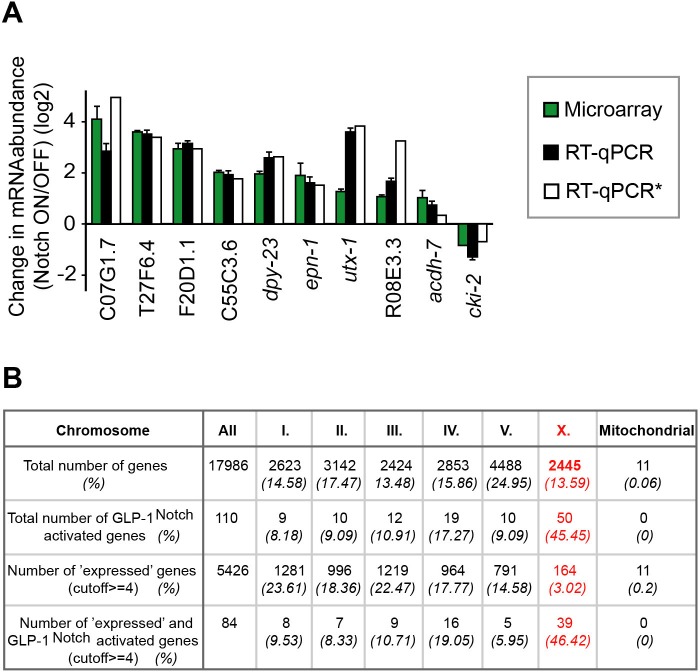
(A) Notch-activated genes are biased for the sex chromosome linkage. Left: Changes in transcript abundance in the ‘Notch ON’ versus ‘OFF’ dissected gonads (genotypes explained in Figure 2—figure supplement 1A–B) were analyzed by microarrays. Transcripts upregulated at least 2-fold in the ‘Notch ON’ gonads are marked in red, those downregulated at least 2-fold in blue. Selected transcripts verified by RT-qPCR in Figure 2—figure supplement 2A are additionally circled in black. Right: 5426 genes can be considered expressed in the gonad, based on the bimodal distribution of expression values. Only 3% of those expressed genes are X-linked. In contrast, nearly half (46%) of the expressed and Notch-activated transcripts are X-linked (see Figure 2—figure supplement 2B for numbers). (B) GLP-1Notch and PRC2 interact genetically. Left: DAPI-stained gonads from animals of the indicated genotypes. The mes-2(bn11) M+Z- single mutant gonads have wild-type appearance at 20°C. The glp-1(ar202) gain-of-function mutants have an almost wild-type appearance at this temperature, except for an extended proliferative zone in the gonad, referred to as 'distal tumor'. At the same temperature, mes-2(bn11) M+Z-; glp-1(ar202) double mutants developed germline tumors in 32/32 of the examined gonads. The insets show close-ups from the indicated gonadal regions: the distal-most regions contain undifferentiated, proliferative germ cells in all mutants (a, c, e). However, while the single mutants contain oocytes with characteristically condensed chromosomes in the proximal gonads (b, d), the proximal gonads of the double mutants harbor proliferative germ cells (f). Scale bar = 30 μm. Right: quantification of the phenotypes. 'Distal tumor' indicates the presence of an elongated distal proliferative zone (approximately ½ of the distal gonad arm). 'Extended' tumor indicates an extended distal tumor, few oocytes, and frequently also a proximal tumor. 'Fully tumorous' indicates the absence of all differentiated cell types except for sperm produced during larval development. (C) GLP-1Notch and PRC2 target the same genes on the X chromosomes. The plots correlate changes in gene expression in M+Z- mes-2 mutants with changes in gene expression changes in M+Z- mes-6 mutants. Results are shown separately for X-linked (left) and autosomal (right) transcripts. Notch-activated genes (red in Figure 2A) are marked in red. Lightly shaded areas indicate transcripts that are at least 2-fold upregulated. The overlap between transcripts upregulated by GLP-1Notch and transcripts upregulated by the loss of CePRC2 is highly significant, particularly for the X-linked genes. The significance of the correlation was measured by hypergeometric distribution; X-linked Notch-activated vs. mes-2 derepressed: p=1.31e-31; X-linked Notch-activated vs. mes-6 de-repressed: p=7.41e-25; autosomal Notch-activated vs. mes-2 derepressed: p=1.47e-22; autosomal Notch-activated vs. mes-6 de-repressed: p=1.8e-12.
DOI: http://dx.doi.org/10.7554/eLife.15477.008


