

Graphical abstract
Predictive selective and non-selective 3D pharmacophore models for the design and development of better and safe T-type calcium channel blockers.
Keywords: Pharmacophore, Catalyst, Calcium channel blocker, Drug design, T-type, HipHop
Abstract
Limited progress has been made in the quest to identify both selective and non-toxic T-type calcium channel blocking compounds. The present research work was directed toward slaking the same by identifying the selective three dimensional (3D) pharmacophore map for T-type calcium channel blockers (CCBs). Using HipHop module in the CATALYST 4.10 software, both selective and non-selective HipHop pharmacophore maps for T-type CCBs were developed to identify its important common pharmacophoric features. HipHop pharmacophore map of the selective T-type CCBs contained six different chemical features, namely ring aromatic (R), positive ionizable (P), two hydrophobic aromatic (Y), hydrophobic aliphatic (Z), hydrogen bond acceptor (H) and hydrogen bond donor (D). However, non-selective T-type CCBs contain all the above mentioned features except ring aromatic (R). The present ligand-based pharmacophore mapping approach could thus be utilized in classifying selective vs. non-selective T-type CCBs. Further, the model can be used for virtual screening of several small molecule databases.
Introduction
The voltage gated calcium (Ca2+) channels (VGCCs), in response to membrane depolarization, mediate the rapid influx of extracellular Ca2+ ions into the cytosol of electrically excitable cells [1], [2]. The increase in the cytosolic Ca2+ level can cause a cascade of responses in different types of cells. This includes activation of calcium dependent enzymes, hormones and neurotransmitter secretion, neurite outgrowth or retraction, cellular proliferation and differentiation, apoptosis and gene expression [1], [2], [3], [4].
The VGCCs are composed of distinct subunits encoded by multiple genes and thereby forming a multi-complex structure. Among these, α1 subunit is the largest with ten multiple forms. It contributes to the diverse pharmacological and electrophysiological properties of VGCCs [3]. Three subfamilies of VGCCs are identified, which encode Cav1, Cav2, and Cav3 genes, respectively. The Cav1 subfamily consists of Cav1.1-Cav1.4 channels, which are high-voltage activated (HVA). They mediate L-type Ca2+ current, which requires strong depolarization for activation. The Cav2 subfamily consists of Cav2.1-Cav2.3, which includes α1A, α1B, and α1E HVA channels. They mediate P/Q-type, N-type, and R-type Ca2+ currents, respectively. L-type Ca2+ currents initiate contraction and secretion in the muscles and endocrine cells. P/Q-type, N-type, and R-type Ca2+ currents are primarily expressed in neurons. They are involved in neurotransmission and mediate calcium transport into cell bodies and dendrites. The Cav3 subfamily also referred to as T-type Ca2+ currents consisting of Cav3.1-Cav3.3 includes α1G, α1H, and α1I channels. These channels generate low-voltage-activated (LVA) Ca2+ currents [3], [4], [5].
T-type Ca2+ channels are expressed in a wide variety of cells and contribute to neuronal excitability. These channels also play crucial roles in the control of blood pressure [6]. Under pathological conditions, T-type Ca2+ channels are known to be implicated in the pathogenesis of epilepsy, neuropathic pain, autism, hypertension, atrial fibrillation, congenital heart failure, pain, psychoses, and cancer [2], [7], [8], [9]. Therefore, these Ca2+ channels are important therapeutic targets for the treatment of peripheral and central nervous system (CNS) disorders as well as cardiovascular diseases [10], [11]. However, limited progress has been made till date in the quest to identify both selective and non-toxic T-type CCBs [12], [13].
All first generation CCBs such as nifedipine and diltiazem block L-type Ca2+ channels. They are classified as dihydropyridine or non-dihydropyridine agents. The second and third generation CCBs are either slow release or long acting formulations of the first generation CCBs [14]. The therapeutic use of most of the CCBs is often limited due to its various side effects, such as negative inotropism, atrioventricular blockade or neurohormonal activation. Mibefradil drug despite various adverse effects such as negative inotropism, reflex tachycardia, negative chronotropic, ankle edema, and constipation was launched in the market in 1997. However, mibefradil was withdrawn within a year, due to its potential drug-drug interactions [15]. Thus, based on this observation there is a need for the development of new T-type CCBs, having high potency with fewer side effects.
Computational techniques such as three dimensional (3D) pharmacophore mapping, quantitative structure-activity relationship (QSAR) modeling, molecular docking, molecular dynamics simulation, and virtual screening (VS) have proven their usefulness in pharmaceutical research for the selection/identification and/or design/optimization of new chemical entities [16]. 3D pharmacophore modeling including ligand-based and structure-based was important areas in Chemoinformatics. Its advances have widened the scope of rational drug design and the search for the mechanism of drug action. Further, it was well-established that the chemical and pharmacological effects of a compound are closely related to its physicochemical properties, which can be calculated by various methods from the molecular structure. These models are useful because they rationalize a large number of experimental observations and allow for saving both time and cost in the drug discovery process. In addition, in silico methods can expand VS of compounds that do not exist physically in the chemical collections therefore compensating for some of the most important limitations of the high-throughput methods [17]. Review of literature survey showed extensive use of these methods in different clinical case studies. Sanaz et al. developed 3D HipHop pharmacophore model containing six chemical features by taking four clinically relevant Topoisomerase I inhibitors. Using Hypo1, they VS Drug like Diverse database to obtain five structures which were found to be a possible anti-Topoisomerase I hits [18]. Another research group conducted 3D pharmacophore model based inhibitor screening and molecular interaction studies for identification of potential drugs on calcium activated potassium channel blockers. They identified in this study two compounds showing promising pharmacophoric fit and ADMET profile [19]. Adane et al. performed four features based 3D pharmacophore model screening to identify potential Plasmodium falciparum dihydrofolate reductase (PfDHFR) inhibitors. This study used HipHop from Catalyst program, molecular docking, and interaction analysis of the active site of the PfDHFR enzyme [20]. 3D-Pharmacophore model for the T-type CCBs based on 3,4-dihydroquinazoline and piperazinylalkylisoxazole derivatives was also reported by other research groups [14].
The main objective of the present work was to develop a 3D HipHop pharmacophore model for selective vs. non-selective T-type CCBs using common-feature based pharmacophoric approach implemented in the HipHop module of Catalyst [21], [22], [23].
Experimental
Chemical data
A series of 25 T-type CCBs belonging to the category of 3, 4-dihydroquinazolines derivatives were selected for the present study [24], [25], [26]. The dataset for common feature pharmacophore modeling (HipHop) includes a training set of five compounds consisting of selective (Compounds A, B and C) and non-selective (Compounds D and E) T-type CCBs. The 3D pharmacophore model was validated using a test set of 20 T-type CCBs. The chemical structures of training set and test set compounds along with their biological activity and selectivity data are presented in Fig. 1 and Table 1 respectively.
Fig. 1.

Training set compounds for pharmacophore model generations. Compounds A, B and C are selective T-type CCBs, while D and E are non-selective T-type CCBs.
Table 1.
The chemical structure of different T-type CCBs along with its IC50 and selectivity.
 |
 |
The compounds for developing 3D HipHop pharmacophore model were constructed using the standard geometric parameters of the molecular modeling software package, SYBYL7.1 (Tripos Associates Inc.). Initially, the compound geometry optimizations and energy minimizations were performed using PM3 method of MOPAC interfaced in SYBYL7.1 [27].
In HipHop, conformational flexibility of compounds is addressed by performing conformational analysis prior to pharmacophoric hypothesis generation and considering in turn each single conformer of all the compounds. The CATALYST program incorporates two methods of conformational model generation, namely Best fit and Fast fit. Both methods use a CHARMm force field recent version for energy calculations and a Poling mechanism for forcing the search into unexplored regions of conformer space [22]. Best method searches the conformational space more extensively than Fast method, particularly ring conformations. This method applies more stringent minimization procedures [21]. For each of the training set compounds, a conformational database was generated using the ‘best’ option and default catalyst conformation generation parameters (a maximum of 255 conformers in an energy range 0–20 kcal/mol from the global minimum) were selected. The HipHop pharmacophore map was based on the alignment of common features present in highly potent compounds. It performs an exhaustive search starting with the simplest pharmacophore configuration, i.e. possible combinations of two-feature pharmacophores. Once all two-feature configurations are exhausted, it then moves to the three-feature combinations. The process continues until HipHop can no longer generate common pharmacophore combinations. Once all configurations are generated they are scored. The hypotheses are ranked on the basis of the number of members fitting the pharmacophore and the frequency of its occurrence. The quality of the mapping between a compound and a hypothesis is indicated by the pharmacophoric fit value.
Present methodology of 3D HipHop pharmacophore model development was sufficient. Since, in the ligand-based 3D pharmacophore model we could not achieve the bioactive conformation of the studied compounds in the absence of the experimental 3D structure of T-type calcium channel receptor. So the conformation generation protocol adopted by us in the present ligand-based technique as explained above was justified.
Generation of 3D HipHop pharmacophore model
3D HipHop pharmacophoric features in the present study of selective and non-selective T-type CCBs were generated using CATALYST version 4.10 program [21]. The correct representation of the 3D-chemical features and the appropriate sampling of the conformational space for the 3D pharmacophore mapping were performed. These include, hydrogen bond donors/acceptors, hydrophobic, hydrophobic aliphatic/aromatic, and charged centers, with the default definitions of the chemical features being customizable. A maximum of five types of chemical features can be specified for 3D HipHop pharmacophore map generation. The number of appearances of a particular chemical feature was customizable for a minimum of zero and maximum of five respectively. In the HipHop pharmacophore map, the chemical features that have directionality (hydrogen bond donor and hydrogen bond acceptor) are described using two points. On the other hand, non-directional features such as charged centers, ring aromatic features and aliphatic hydrophobic regions are represented by single points respectively.
3D HipHop pharmacophore model was generated using two different approaches: (i) Pharmacophore map developed using three compounds (A, B and C) belonging to 3,4-dihydroquinazoline class and reported to be highly selective toward T-type Ca2+ channel, and (ii) Non-selective pharmacophore map developed by leveraging four compounds (which includes both selective and non-selective T-type CCBs (D and E), with selectivity ranging between 100% and 1.4%). These two 3D pharmacophore maps generated are then compared to reveal pharmacophoric features responsible for selective and non-selective T-type Ca2+ channel inhibition.
Case I: T-type selective 3D HipHop pharmacophore map
Molecular structure of three compounds (A, B and C) belonging to the category of 3,4-dihydroquinazoline derivatives and highly selective toward T-type Ca2+ channel is shown in Fig. 1. These molecules are used for developing T-Type channel selective 3D pharmacophore map. Compounds B and C differed only in the substituent’s i.e. methyl in compound B and fluorine in compound C. A methyl group in compound B can act as hydrogen bond donors and fluorine in compound C as hydrogen bond acceptor feature respectively.
The feature dictionary for 3D HipHop pharmacophore map generation was decided based on the functional mapping of chemical features using three training set compounds (A, B and C). The chemical feature dictionary, thereby included six different features, hydrogen bond acceptor/donor (H/D), hydrophobic aromatic (Y) and aliphatic (Z), ring aromatic (R) and positive ionizable (P) features respectively. Also, the hydrogen bond acceptor feature was modified to include fluorine in the feature dictionary, since Compound C belonging to training set had fluorine atom substitution as the hydrogen bond acceptor. For the development of selective 3D HipHop pharmacophore model the following three trials (Trial 1, Trial 2 and Trial 3 presented in Table 2) described below were considered in the present study.
Table 2.
The 3D pharmacophore strategy used in Case I and Case II.
| Compound | IC50 (μM) | Selectivity (T/N type) | Case I |
Case II | ||||||
|---|---|---|---|---|---|---|---|---|---|---|
| Trial 1 |
Trial 2 |
Trial 3 |
Trial 1 |
|||||||
| P | O | P | O | P | O | P | O | |||
| A | 0.56 | 100 | 2 | 0 | 2 | 0 | 2 | 0 | 2 | 0 |
| B | 0.96 | 100 | 2 | 0 | 1 | 1 | 1 | 0 | ||
| C | 4.10 | 100 | 2 | 0 | 1 | 1 | 1 | 0 | 2 | 0 |
| D | 1.34 | 1.4 | 2 | 0 | ||||||
| E | 0.38 | 32.2 | 2 | 0 | ||||||
P: Principle Number, O: Maximum Omitted Feature.
Trial 1: All three training set compounds (A, B and C) were taken as the reference compound by allotting each of them “Principal” value of 2 and “MaxOmitFeat” value of 0. This was to ensure that all chemical features present in them will be captured while generating 3D pharmacophoric hypotheses, and is presented in Table 2.
Trial 2: In Trial 2, only the highly potent compound, compound A, among three (A, B and C) compounds was taken as the reference compound. Compound A was given “Principal” value of 2 and “MaxOmitFeat” value of 0. The rest of the two compounds (B and C) were given the value of 1 for both “Principal” value and “MaxOmitFeat” value. This was to ensure further that their chemical features will be considered at least once when generating pharmacophoric hypotheses shown in Table 2.
Trial 3: In Trial 3, only the highly potent compound, compound A, among three (A, B and C) compounds was taken as the reference compound. Compound A was given “Principal” value of 2 and “MaxOmitFeat” value of 0. The rest of the two compounds (B and C) were given the value of 1 for “Principal” value and “MaxOmitFeat” to be 0, and are presented in Table 2.
All other parameters were kept at default in these three trial cases, Trial 1, Trial 2 and Trial 3 for generating pharmacophoric hypothesis. Two different methods ‘fast fit’ and ‘best fit’ were used to generate and compare the 3D pharmacophore features for selective and non-selective T-type CCBs, as explained earlier.
Case II: Non-selective 3D HipHop pharmacophore map
A non-selective 3D chemical feature hypothesis for the T-type CCBs was developed in this study. The training sets used in Case I (Compounds A, B and C) were modified by including Mibefradil (Compound D) and replacing compound B with compound E, which was less selective to T-Type channel. Similar to Case I, three trials were performed in Case II using the same chemical Feature dictionary as in Case I. Data related to Trials 2 and 3 were not shown, and were insignificant as compared to Trial 1. Trial 1 was developed by using “Principal” value of 2 and “MaxOmitFeat” value of 0 for all the four compounds (A, C, D and E) employed in HipHop pharmacophore map development, as shown in Table 2.
3D HipHop pharmacophore map validations
The 3D pharmacophore hypotheses so engendered in Case I and Case II were validated by rigorously checking them against a test set of 20 compounds (inclusive of Mibefradil for Case I) and 21 compounds (exclusive of Mibefradil to Case II) respectively. The power to distinguish selective T-type CCBs vs non-selective T-type CCBs was kept as a criterion to qualify for valid 3D pharmacophore hypothesis for Case I, while in Case II study, all compounds should map since it is not restrictive. Both best fit and fast fit methods were employed in these two case studies.
Results and discussion
3D Pharmacophore model development of selective and non-selective T-type CCBs was developed using a HipHop module in Catalyst software [21]. In silico techniques offer attractive advantages over experimental methods, especially for membrane/channel receptors. These are difficult to purify/crystallize for solving the 3D structure of T-type channel receptor using either X-ray or NMR techniques. So, instead of structure-based modeling study, ligand-based pharmacophore modeling approach was adopted in the present study. 3D model should be robust and significant enough to distinguish between selective and non-selective T-type CCBs.
Schuster, reviewed different ligand based and structure based pharmacophore models followed by Chemoinformatics techniques to identify potent inhibitors by sequential VS in hydroxysteroid dehydrogenase/reductases [28]. Structure-based VS techniques were adopted by Leung et al. to identify natural product-like STAT3 dimerization inhibitor. STAT3 is an important druggable target which on dysregulation leads to a variety of solid and hematological tumors, including leukemia, lymphomas, head and neck cancer [29]. Zhong et al. developed structure-based VS and optimization of cytisine derivatives as inhibitors of the menin–MLL interaction. They identified inhibitors, which exhibited potent anti-proliferative activity in heptacellular carcinoma cells, possibly through inhibition of Menin–MLL interactions [30]. Pharmacophore mapping, molecular docking and QSAR analysis for AChE inhibitors were performed by Brahmachari et al. to understand the structural features required for interaction with the AChE enzyme and its intermolecular interactions with the active site residues [31].
In the present study, various ligand-based 3D pharmacophoric strategies were adopted by us to develop selective and non-selective HipHop pharmacophore models using different T-Type CCBs.
Case I: Selective 3D HipHop pharmacophore features
Trial 1: In Trial 1, using three training set compounds (A, B and C) as the reference compound by allotting each of them “Principal” value of 2 and “MaxOmitFeat” value of 0, the pharmacophore hypothesis was generated. Three different chemical features (PYH and PZH) appeared in developing 3D pharmacophore maps. Ten different hypotheses generated showed only three chemical features with very low scores ranging from 34.4 to 31.8 in this Case I study. The corresponding best fit and fast fit values are very less and not correlating w.r.t its T-type channel activity. Thus, the present Case I hypothesis was not very specific due to the presence of less number of chemical features and is presented in Suppl. Table 1. This in turn increases its probability to pick up false positives in future pharmacophore model based screening studies.
Trial 2: In Trial 2, compound A among training set compounds A, B and C was taken as the reference compound by giving “Principal” value of 2 and “MaxOmitFeat” value of 0. The rest of the two compounds (B and C) were given the value of 1 for both “Principal” value and “MaxOmitFeat” shown in Table 2. These ten different hypotheses were generated showing three different types of chemical features in Table 3. Further, hypotheses 1, 2 and 6 showing direct hit of 1 for this training set compounds were considered for further analysis. The corresponding variation in the scores ranges from 62 to 55.56. The chemical features that appeared included different combinations of ring aromatic (R), positive ionizable (P), hydrophobic aromatic (Y), hydrophobic aliphatic (Z), hydrogen bond donor (D) and hydrogen bond acceptor (H), and are presented in Table 3. The best fit and fast values were higher in this case as shown in Table 4 having good correlation w.r.t its T-type channel activity for both hypotheses 2 and 6.
Table 3.
Statistical summary of ten hypotheses in Case I, Trial 2.
| Hypothesis | Feature | Rank | Direct hit | Partial hit |
|---|---|---|---|---|
| 1 | RPYYZDH | 62.00 | 111 | 000 |
| 2 | PYYYZZD | 61.84 | 111 | 000 |
| 3 | RPYYZDH | 57.77 | 110 | 001 |
| 4 | PYYYZZD | 55.90 | 011 | 100 |
| 5 | PYYYZDH | 55.87 | 011 | 100 |
| 6 | RPYYZH | 55.84 | 111 | 000 |
| 7 | RPYYZDH | 55.76 | 011 | 100 |
| 8 | PYYYZZH | 55.75 | 011 | 100 |
| 9 | RPYYZDH | 55.74 | 011 | 100 |
| 10 | PYYYZDH | 55.56 | 011 | 100 |
P: Positive ionizable, H: Hydrogen bond acceptor, Y: Hydrophobic aromatic, Z: Hydrophobic aliphatic, R: Ring aromatic, HD: Hydrogen bond donor.
Table 5.
Statistical summary of ten hypotheses in Case II.
| Hypothesis | Feature | Rank | Direct hit | Partial hit |
|---|---|---|---|---|
| 1 | PYYDH | 53.09 | 1111 | 0000 |
| 2 | PYYZH | 52.81 | 1111 | 0000 |
| 3 | PYYDH | 52.76 | 1111 | 0000 |
| 4 | PYYZH | 52.51 | 1111 | 0000 |
| 5 | PYYZD | 52.50 | 1111 | 0000 |
| 6 | PYYZH | 52.44 | 1111 | 0000 |
| 7 | PYZDH | 52.25 | 1111 | 0000 |
| 8 | PYYZH | 52.20 | 1111 | 0000 |
| 9 | RPYDH | 52.16 | 1111 | 0000 |
| 10 | PYYDH | 52.13 | 1111 | 0000 |
Trial 3: Akin to Trial 1 and Trial 2, two different kinds of pharmacophore hypothesis were developed for Trial 3 in Case I. However, in this case we observed that five and six types of chemical features appeared from the generated ten different hypotheses. These include, ring aromatic (R), positive ionizable (P), hydrophobic aromatic (Y), hydrophobic aliphatic (Z), hydrogen bond donor (D) and hydrogen bond acceptor (H). In the present case we observed that the D feature was changed to Y feature. The score ranged from 55.18 to 53.32 in the 10 hypotheses generated. However unlike the Trial 2 case, the pharmacophoric fit value was not found to be in accordance with T-type channel activity shown in Suppl. Table 2.
Case II: Non-selective 3D pharmacophore features
A non-selective 3D chemical feature hypothesis for the T-type CCBs was developed in this study by including Mibefradil (Compound D) and compound E. Both these compounds are less selective to T-Type channel. Among three trials, Trial 1 developed by using “Principal” value of 2 and “MaxOmitFeat” value of 0 were significant in comparison with other two trials (Table 2).
The five different types of hypothesis were obtained in this setting. The features that appeared included different combinations of ring aromatic (R), positive ionizable (P), hydrophobic aromatic (Y), hydrophobic aliphatic (Z), hydrogen bond donor (D) and hydrogen bond acceptor (H). Score for 10 hypotheses ranging from 53.09 to 52.13 is presented in Table 5, respectively.
Table 4.
Case I and Case II best fit and fast fit values of the training set compounds for statistically best hypothesis.
| Comp. No. | IC50 (μM) | Selectivity (T/N type) | Case I |
Case II | ||||||||
|---|---|---|---|---|---|---|---|---|---|---|---|---|
| Trial 1 |
Trial 2 (H2) |
Trial 2 (H6) |
Trial 3 |
Trial 1 |
||||||||
| B | F | B | F | B | F | B | F | B | F | |||
| A | 0.56 | 100 | 2.99 | 3.00 | 6.97 | 7.00 | 5.99 | 6.00 | 1.96 | 1.10 | 5.00 | 5.00 |
| B | 0.96 | 100 | 1.92 | 1.76 | 4.59 | 3.46 | 3.50 | 2.13 | 5.98 | 5.96 | ||
| C | 4.10 | 100 | 2.21 | 1.79 | 3.76 | 1.60 | 3.06 | 1.32 | 6.00 | 6.00 | 4.19 | 1.63 |
| D | 1.34 | 1.4 | 1.39 | 3.75 | ||||||||
| E | 0.38 | 32.2 | 3.63 | 2.68 | ||||||||
H2 and H6: Hypotheses 2 and 6, B: Best fit, F: Fast fit.
3D pharmacophore features validation
The 3D pharmacophore validation for selective and non-selective T-type CCBs was established using chemical features, fit values, chemical feature distances and test set molecules. This validation includes two different case studies (Case I and Case II) containing two different training sets, as explained above. In each case, three different trials were performed in order to check the robustness and the significance of the developed 3D model. Ten different pharmacophoric hypotheses were generated in each of these trials to check the reliability of different 3D pharmacophoric features.
Case I: In this case, three different trials (Trial 1, Trial 2 and Trial 3) were made to generate three different pharmacophoric features containing models. These models were used to test the importance and significance of different 3D chemical features for selective and non-selective T-Type CCBs. Trial 1 showed very weak hypothesis with less chemical features, less score and fitness value. The percentage accuracy of pharmacophoric prediction using 20 test set compounds was less than 60% with both the best and fast fit methods. Thus, this trial was discarded from the present study. Trial 2 showed some promising results in which hypotheses 1, 2 and 6 were considered showing six to seven chemical features with good scores and fitness value as shown in Table 2, Table 3, Table 5. Further, hypotheses 2 and 6 of Trial 2 (Fig. 2a and b) performed well showing direct hit of 1 for all the studied three compounds. Its accuracy against the external test set was 85% with both fast fit and best fit methods. The best fit and fast fit of the training set compounds to these hypotheses are shown in Table 4. The corresponding fitness value for the test set compounds is promising in this trial case as shown in Table 6. Hypotheses 1, which also had a direct hit in 1 for all the studied three compounds was not considered, since it predicted well with fast fit but failed in best fit method. Trial 3 even though showed five to six chemical features with satisfactory scoring, but was not comparable to that of hypotheses 2 and 6 of Trial 2. Further, it completely failed in predicting the fit value w.r.t its T-type channel activity shown in Table 4 and Suppl. Table 2.
Fig. 2.

The best selective pharmacophore map (a) Case I, Trial 2, Hypothesis 2, and (b): Case I, Trial 2, Hypothesis 6.
Table 6.
Best fit and Fast fit values of test set compounds for statistically best selective and non-selective hypothesis.
| Compound | Selective hypothesis |
Non-selective hypothesis |
||||
|---|---|---|---|---|---|---|
| Hypothesis 2 |
Hypothesis 6 |
|||||
| Best fit | Fast fit | Best fit | Fast fit | Best fit | Fast fit | |
| 1 | NM | NM | NM | NM | 1.99 | 1.82 |
| 2 | NM | NM | NM | NM | 2.36 | 2.08 |
| 3 | NM | NM | NM | NM | 4.63 | 3.59 |
| 4 | 3.02 | 1.20 | 3.86 | 2.72 | 4.09 | 2.41 |
| 5 | NM | NM | NM | NM | 4.66 | 4.09 |
| 6 | NM | NM | NM | NM | 4.25 | 3.44 |
| 7 | NM | NM | NM | NM | NM | NM |
| 8 | NM | NM | NM | NM | NM | NM |
| 9 | NM | NM | NM | NM | 2.61 | 1.71 |
| 10 | NM | NM | NM | NM | 4.60 | 3.84 |
| 11 | NM | NM | NM | NM | 4.53 | 4.06 |
| 12 | NM | NM | NM | NM | 1.70 | 1.60 |
| 13 | NM | NM | NM | NM | 2.39 | 2.29 |
| 14 | 0.25 | 0.16 | NM | NM | 0.35 | 0.40 |
| 15 | NM | NM | NM | NM | 4.05 | 3.64 |
| 16 | 6.36 | 4.84 | NM | NM | 4.23 | 3.84 |
| 17 | NM | NM | NM | NM | 1.26 | 0.39 |
| 18 | NM | NM | 5.87 | 3.35 | 4.45 | 3.94 |
| 19 | NM | NM | NM | NM | 4.23 | 4.11 |
| 20 | NM | NM | 5.64 | 4.65 | 3.82 | 3.72 |
| Compound A | – | – | – | – | – | – |
| Compound B | – | – | – | – | 4.75 | 3.67 |
| Compound C | – | – | – | – | ||
| Mibefradil D | NM | NM | NM | NM | – | – |
| Compound E | NM | NM | NM | NM | – | – |
NM: Not Mapping, Compounds A, B and C are training set for Case I while Compounds A, C, D and E are training set for Case II.
The mapping of various chemical features of the selective 3D pharmacophore of hypotheses 2 and 6 of Case I (Trial 2) in compounds B and C was almost similar. Hypothesis 2 contained hydrogen bond donor, positive ionizable, two hydrophobic aliphatic, ring aromatic and hydrophobic aromatic features. Mapping of compound A (potent and more selective) to hypothesis 2 is shown in Fig. 3. It showed an excellent fit, both by the best fit 6.97 and by the fast fit 7.00 using hypothesis 2 (Table 4). Further, different chemical features fitness toward compounds B and C include- (i) hydrogen bond donor mapping on the terminal amine attached to alkyl chain, (ii) positive ionizable on the nitrogen present at first position of 3, 4-dihydroquinazoline ring and (iii) hydrophobic aromatic features mapping on the benzene ring of 3, 4-dihydroquinazoline ring obtained using hypothesis 2. The corresponding best fit value of compound B was 4.59 and compound C was 3.76 respectively, shown in Table 4.
Fig. 3.

Pharmacophore mapping of most selective (potent) compound A to selective hypothesis 2.
Four different 3D pharmacophoric features of selective hypothesis 6 of Case-I (Trial 2) for compounds B and C include- (i) hydrogen bond acceptor mapping on the carbonyl group, (ii) positive ionizable mapping on the nitrogen present at first position of 3, 4-dihydroquinazoline ring, (iii) ring aromatic mapping on the phenyl ring attached to sulfonyl group, and (iv) a hydrophobic aliphatic mapping on the ethyl substitution at third position shown in Fig. 4. Two hydrophobic aromatic functionalities include- mapping on a phenyl of 3, 4-dihydroquinazoline ring and the other on the phenyl ring adjacent to the amine group (Fig. 4). The corresponding fitness value obtained using the best fit method for compound B was 3.50 and compound C was 3.06 respectively (Table 4). The compound A pharmacophore mapping was similar in terms of hydrogen bond acceptor and one of the hydrophobic aromatic features. They differ in terms of the positive ionizable feature mapped on the amine substitution at second position, w.r.t compounds B and C respectively shown in Fig. 5.
Fig. 4.

Pharmacophore mapping of compounds B and C to selective hypothesis 6.
Fig. 5.

Pharmacophore mapping of the most selective (potent) compound A to selective hypothesis 6.
Case II: In this Case-II study, we included both selective and non-selective T-type CCBs in the training set for 3D HipHop pharmacophore model development. Ten different chemical hypotheses generated using Trial 1 with “Principal” value of 2 and “MaxOmitFeat” value of 0 produced different combinations of five chemical features P(R)YZDH respectively (Fig. 6). These hypotheses were checked for test set (selective vs non-selective) predictions containing 20 molecules. Among these, hypothesis 4 performed well with the external test set accuracy of 92% (Fig. 6 and Table 6). Corresponding best fit and fast fit value of the training set in Case-II was given in Table 4. The mapping of compound A to hypothesis 4 is shown in Fig. 7. The present 3D pharmacophore map containing five chemical features was in good agreement with the 3D pharmacophore analysis performed by Doddareddy et al. [14]. Two outliers obtained in the test set compounds which were not mapped properly were compounds 7 and 8 shown in Table 6. On examining the chemical structure of these compounds it was observed that an aliphatic –CH2CH3 at R2 position along with the NO2 group at R3 position is present in these compounds (Table 1). The position of R2 in other compounds was mainly substituted with the hydrophobic aromatic group. The nature of the substitutions at R2 and R3 in compounds 7 and 8 might be one of the main reasons for not mapping with the present developed pharmacophore map.
Fig. 6.

The best non-selective pharmacophore map (Case II, hypothesis 4).
Fig. 7.

Pharmacophore mapping of selective (potent) compound A to non-selective hypothesis 4.
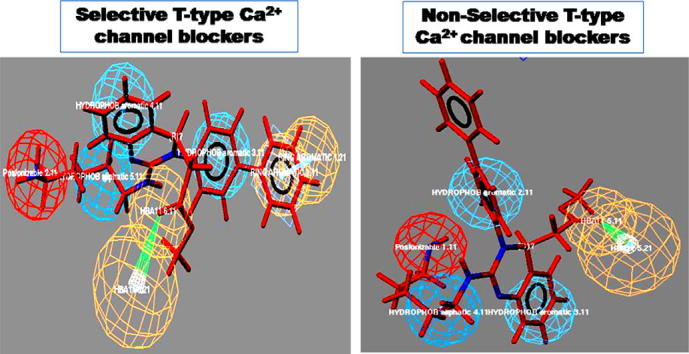
T-type CCBs selective verses non-selective pharmacophore hypothesis
The objective of this study was to differentiate between 3D pharmacophoric features required for selective and non-selective T-type CCBs. Comparison of selective and non-selective pharmacophore map showed a difference of only one pharmacophoric feature when compared with that of the selective hypothesis 6. The selective pharmacophore map has six chemical features, namely ring aromatic (R), positive ionizable (P), two hydrophobic aromatic (Y), hydrophobic aliphatic (Z), hydrogen bond donor (D) and hydrogen bond acceptor (H). On the other hand, non-selective pharmacophore map have five chemical features lacking ring aromatic feature. Interestingly, a comparison of hypothesis 4 in Case-II with that of the hypothesis 2 in Case-I revealed differences of mainly ring aromatic chemical feature in the present study, to distinguish between selective vs. non-selective T-type CCBs. Thus, ring aromatic feature plays an important role in determining the selectivity of T-type CCBs. Further, hydrogen bond donor features present in the map 2 might also be important to classify the selectivity vs. non-selectivity toward predicting T-Type CCBs (Table 3, Table 4).
Further insight into this classification emerged by analyzing the spatial relationship between these pharmacophoric features. The comparative distance tolerance range of the three hypotheses (two selectives and one non-selective) is presented in Table 7, and is also pictorially represented in Suppl. Figs. 1, 2 and 3, respectively. The distance tolerance in three hypotheses is measured from positive ionizable and hydrophilic aliphatic (common in three hypotheses) features of the rest of the 3D pharmacophoric features. The distance tolerance for chemical features P-H, P-Z1, Z1-Y1, and Z2-Y2 is nearly the same in three hypotheses. These results suggest that the spatial relation of this pharmacophoric features might not have any influence on selectivity. In contrast P-Y (2) and Z-H features in selective hypothesis (6) and non-selective hypothesis had a quite different distance tolerance. This provides important clues that the proper 3D spatial arrangement of these pharmacophoric features might improve selectivity (Table 7).
Table 7.
Comparative pharmacophore distance map analysis of selective and non-selective hypothesis.
| Features | Distance tolerance (Å) |
||
|---|---|---|---|
| Selective Hypothesis 2 | Selective Hypothesis 6 | Non-selective Hypothesis | |
| P-H | 6.05–8.05 | 6.96–8.96 | |
| P-Y(1) | 2.25–4.25 | 4.79–6.79 | 3.56–5.56 |
| P-Y(2) | 4.25–6.25 | 9.53–11.53 | 5.15–7.15 |
| P-Z(1) | 3.27–5.27 | 3.72–5.72 | 3.03–5.03 |
| P-Z(2) | 4.18–6.18 | ||
| P-R | 8.30–10.30 | 13.53–15.53 | |
| P-HD | 6.36–8.73 | ||
| Z(1)-H | 5.04–7.04 | 7.69–9.69 | |
| Z(1)-Z(2) | 6.03–8.03 | ||
| Z(1)-Y(1) | 4.23–6.23 | 5.19–7.19 | 4.79–6.79 |
| Z(1)-Y(2) | 5.27–7.27 | 5.91–7.91 | 4.96–6.96 |
| Z(1)-R | 8.45–10.45 | 9.56–11.56 | |
The distance tolerance range in three hypotheses is measured from positive ionizable and hydrophobic aliphatic features, to the rest of the features.
P: Positive ionizable, H: Hydrogen bond acceptor, Y (1) and (2): Hydrophobic aromatic 1 and 2, Z (1) and (2): Hydrophobic aliphatic 1 and 2, R: Ring aromatic, HD: Hydrogen bond donor.
Distance between positive ionizable and ring aromatic features (P-R) in both selective hypotheses is quite different. This indicates that the relative positioning of these two chemical features doesn’t have any influence on the CCBs selectivity. On the other hand, the case with Z (1) -R shows that flexibility in the relative positioning of these two chemical features is quite restrictive (Table 7). Selective hypothesis 2 has hydrogen bond donor (D) and aliphatic hydrophobic feature 2 (Z2), which are absent in hypothesis 6 and non-selective hypothesis. The distance between P-Z2, P-HD and Z1-Z2 is given in Table 7. This might be the other main reason contributing for T-type CCBs selectivity using hypothesis 2. Thus, the present study successfully highlighted the importance of the 3D pharmacophoric features, its fit values and spatial distributions. Further, significant integration with the experimentally determined inhibitory activity and selectivity of different T-Type CCBs was observed.
Conclusions
Predictive 3D pharmacophore models generated using a HipHop module in Catalyst using selective T-type CCBs showed six chemical features and that of the non-selective T-type CCBs showed five chemical features. The absence of hydrophobic feature (R) might be important for distinguishing selective vs non-selective T-type CCBs. Further, the developed models have the capacity to classify selective vs. non-selective T-type CCBs on the basis of hypotheses 2 and 6 and its corresponding pharmacophoric fit value and distance analysis. These 3D models provide a useful framework for understanding binding and gave structural insight into the specific CCBs–receptor interactions responsible for affinity, and other biological processes.
Conflict of Interest
The authors have declared no conflict of interest.
Compliance with Ethics Requirements
This article does not contain any studies with human or animal subjects.
Acknowledgments
CGM is grateful to National Institute of Pharmaceutical Education and Research (NIPER), S.A.S. Nagar, Punjab, and Amrita Centre for Nanosciences and Molecular Medicine, Amrita Vishwa Vidyapeetham, Amrita University, for computational infrastructure support.
Footnotes
Peer review under responsibility of Cairo University.

Supplementary data associated with this article can be found, in the online version, at http://dx.doi.org/10.1016/j.jare.2016.09.004.
Appendix A. Supplementary material
References
- 1.Stephens R.F., Guan W., Zhorov B.S., Spafford J.D. Selectivity filters and cysteine-rich extracellular loops in voltage-gated sodium, calcium, and NALCN channels. Front Physiol. 2015;6:153. doi: 10.3389/fphys.2015.00153. [DOI] [PMC free article] [PubMed] [Google Scholar]
- 2.Iftinica M.C. Neuronal T-type calcium channels: what’s new? Iftinca: T-type channel regulation. J Med Lif. 2011;4:126–138. [PMC free article] [PubMed] [Google Scholar]
- 3.Catterall W.A., Perez-Reyes E., Snutch T.P., Striessnig J. International union of pharmacology. XLVIII. Nomenclature and structure-function relationships of voltage-gated calcium channels. Pharmacol Rev. 2005;57:411–425. doi: 10.1124/pr.57.4.5. [DOI] [PubMed] [Google Scholar]
- 4.Dziegielewska B., Gray L.S., Dziegielewski J. T-type calcium channels blockers as new tools in cancer therapies. Eur J Phys. 2014;466:801–810. doi: 10.1007/s00424-014-1444-z. [DOI] [PubMed] [Google Scholar]
- 5.Cueni L., Canepari M., Adelman J.P., Anitha L. Ca2+ signaling by T-type Ca2+ channels in neurons. Eur J Phys. 2009;457:1161–1172. doi: 10.1007/s00424-008-0582-6. [DOI] [PubMed] [Google Scholar]
- 6.Seo H.N., Choi J.Y., Choe Y.J., Kim Y., Rhim H., Lee S.H. Discovery of potent T-type calcium channel blocker. Biorg Med Chem Lett. 2007;17:5740–5743. doi: 10.1016/j.bmcl.2007.08.070. [DOI] [PubMed] [Google Scholar]
- 7.Nelson M.T., Todorovic S.M., Perez-Reyes E. The role of T-type calcium channels in epilepsy and pain. Curr Pharm Des. 2006;12:2189–2197. doi: 10.2174/138161206777585184. [DOI] [PubMed] [Google Scholar]
- 8.Belardetti F., Zamponi G.W. Linking calcium channel variants to potential therapies. Curr Opin Invest Drugs. 2008;9:707–715. [PubMed] [Google Scholar]
- 9.Perez-Reyes E. Molecular physiology of low-voltage-activated t-type calcium channels. Physio Rev. 2003;83:117–161. doi: 10.1152/physrev.00018.2002. [DOI] [PubMed] [Google Scholar]
- 10.Giordanetto F., Knerr L., Wållberg A. T-type calcium channels inhibitors: a patent review. Exp Opin Therap Patents. 2011;21:85–101. doi: 10.1517/13543776.2011.536532. [DOI] [PubMed] [Google Scholar]
- 11.Zhang Q., Xia Z., Joshi S., Scott V.E., Jarvis M.F. Optimization of ADME properties for sulfonamides leading to the discovery of a T-type calcium channel blocker, ABT-639. ACS Med Chem Lett. 2015;28:641–644. doi: 10.1021/acsmedchemlett.5b00023. [DOI] [PMC free article] [PubMed] [Google Scholar]
- 12.Perez-Reyes E., Van Deusen A.L., Vitko I. Molecular pharmacology of human Cav3.2 T-type Ca2+ channels: block by antihypertensives, antiarrhythmics, and their analogs. J Pharmacol Expt Therap. 2009;328:621–627. doi: 10.1124/jpet.108.145672. [DOI] [PMC free article] [PubMed] [Google Scholar]
- 13.Lee Y.S., Lee B.H., Park S.J., Kang S.B., Rhim H., Park J.Y. 3,4-Dihydro-quinazoline derivatives as novel selective T-type Ca2+ channel blockers. Bioorg Med Chem Lett. 2004;14:3379–3384. doi: 10.1016/j.bmcl.2004.04.090. [DOI] [PubMed] [Google Scholar]
- 14.Doddareddy M.R., Jung H.K., Lee J.Y., Lee Y.S., Cho Y.S., Koh H.Y. First pharmacophoric hypothesis for T-type calcium channel blockers. Bioorg Med Chem. 2004;12:1605–1611. doi: 10.1016/j.bmc.2004.01.034. [DOI] [PubMed] [Google Scholar]
- 15.Bennett M.A., Thomyant P., Jiunn H.L. Drug interactions with calcium channel blockers: possible involvement of metabolite-intermediate complexation with CYP3A. Drug Metab Dispos. 1999;28:125–130. [PubMed] [Google Scholar]
- 16.Gregory S., Sandeepkumar K., Jens M., Edward W.L., Jr Computational methods in drug discovery. Pharmacol Rev. 2014;66:334–395. doi: 10.1124/pr.112.007336. [DOI] [PMC free article] [PubMed] [Google Scholar]
- 17.Sheng Y.Y. Pharmacophore modeling and applications in drug discovery: challenges and recent advances. Drug Discov Today. 2010;15(11):444–450. doi: 10.1016/j.drudis.2010.03.013. [DOI] [PubMed] [Google Scholar]
- 18.Sanaz A., Serap Y., Tugba E.B., Ilkay Y. Generated 3D-common feature hypotheses using the HipHop method for developing new topoisomerase I inhibitors. Arch Pharm Chem Life Sci. 2015;348:498–507. doi: 10.1002/ardp.201500045. [DOI] [PubMed] [Google Scholar]
- 19.Barani K.R., Xavier S.M. Pharmacophore mapping based inhibitor selection and molecular interaction studies for identification of potential drugs on calcium activated potassium channel blockers tamulotoxin. Pharmaco Mag. 2013;9(34):80–95. doi: 10.4103/0973-1296.111239. [DOI] [PMC free article] [PubMed] [Google Scholar]
- 20.Adane L., Bharatam P.V., Sharma V. A common feature-based 3D-pharmacophore model generation and virtual screening: identification of potential PfDHFR inhibitors. J Enzyme Inhib Med Chem. 2010;25(5):635–645. doi: 10.3109/14756360903393817. [DOI] [PubMed] [Google Scholar]
- 21.Catalyst version4.10, A. I., S.R., San Diego, CA, USA; 2005.
- 22.Smellie A., Teig S.L., Towbin P. Poling: promoting conformational variation. J Comput Chem. 1995;16:171–187. [Google Scholar]
- 23.Accelrys Inc, S. R., San Diego, CA, USA. In Cerius2 version4.10.
- 24.Choi J.Y., Seo H.N., Lee M.J. Synthesis and biological evaluation of novel T-type calcium channel blockers. Bioorg Med Chem Lett. 2007;17:471–475. doi: 10.1016/j.bmcl.2006.10.024. [DOI] [PubMed] [Google Scholar]
- 25.Park S.J., Park S.J., Lee M.J., Rim H., Kim Y., Lee J.H. Synthesis and SAR studies of a novel series of T-type calcium channel blockers. Bioorg Med Chem Lett. 2006;15:3502–3511. doi: 10.1016/j.bmc.2006.01.005. [DOI] [PubMed] [Google Scholar]
- 26.Rhim H., Lee Y.S., Park S.J., Chung B.Y., Lee J.Y. Synthesis and biological activity of 3,4-dihydroquinazolines for selective T-type Ca2+ channel blockers. Bioorg Med Chem Lett. 2005;15:283–286. doi: 10.1016/j.bmcl.2004.10.078. [DOI] [PubMed] [Google Scholar]
- 27.SYBYL7.1; Tripos Inc., S. L., MO 63144 USA.
- 28.Teresa K., Katharina R.B., Muhammad A., Alex O., Daniela S. Pharmacophore models and pharmacophore-based virtual screening: concepts and applications exemplified on hydroxysteroid dehydrogenases. Molecules. 2015;20:22799–22832. doi: 10.3390/molecules201219880. [DOI] [PMC free article] [PubMed] [Google Scholar]
- 29.Liu L.-J., Leung K.H., Chan D.S.H., Wang Y.T., Ma D.L., Leung C.H. Identification of a natural product-like STAT3 dimerization inhibitor by structure-based virtual screening. Cell Death Disease. 2014;5:e1293. doi: 10.1038/cddis.2014.250. [DOI] [PMC free article] [PubMed] [Google Scholar]
- 30.Zhong H.J., Lee B.R., Boyle J.W., Wang W., Ma D.L., Hong Chan P.W. Structure-based screening and optimization of cytisine derivatives as inhibitors of the menin–MLL interaction. Chem Commun. 2016;52:5788–5791. doi: 10.1039/c6cc01079b. [DOI] [PubMed] [Google Scholar]
- 31.Brahmachari G., Choo C., Ambure P., Roy K. In vitro evaluation and in silico screening of synthetic acetylcholinesterase inhibitors bearing functionalized piperidine pharmacophores. Bioorg Med Chem. 2015;23(15):4567–4575. doi: 10.1016/j.bmc.2015.06.005. [DOI] [PubMed] [Google Scholar]
Associated Data
This section collects any data citations, data availability statements, or supplementary materials included in this article.