

Abstract
Iron accumulation in the retina is associated with the development of age-related macular degeneration (AMD). IV iron is a common method to treat iron deficiency anemia in adults, and its retinal manifestations have not hitherto been identified. To assess whether IV iron formulations can be retina-toxic, we generated a mouse model for iron-induced retinal damage. Male C57BL/6J mice were randomized into groups receiving IV iron-sucrose (+Fe) or 30% sucrose (−Fe). Iron levels in neurosensory retina (NSR), retinal pigment epithelium (RPE), and choroid were assessed using immunofluorescence, quantitative PCR, and the Perls’ iron stain. Iron levels were most increased in the RPE and choroid while levels in the NSR did not differ significantly in +Fe mice compared to controls. Eyes from +Fe mice shared histological features with AMD, including Bruch’s membrane (BrM) thickening with complement C3 deposition, as well as RPE hypertrophy and vacuolization. This focal degeneration correlated with areas with high choroidal iron levels. Ultrastructural analysis provided further detail of the RPE/photoreceptor outer segment vacuolization and Bruch’s membrane thickening. Findings were correlated with a clinical case of a 43-year-old patient who developed numerous retinal drusen, the hallmark of AMD, within 11 months of IV iron therapy. Our results suggest that IV iron therapy may have the potential to induce or exacerbate a form of retinal degeneration. This retinal degeneration shares features with AMD, indicating the need for further study of AMD risk in patients receiving IV iron treatment.
Keywords: AMD, macular degeneration, iron, oxidative stress, RPE
1. Introduction
Age-related macular degeneration (AMD) represents a leading cause of vision loss, affecting millions of elderly in the USA (Laatikainen and Hirvelä, 1995; The Eye Diseases Prevalence Research Group*, 2004). AMD is defined by the development of drusen – characteristic extracellular deposits between the retinal pigment epithelium (RPE) and its basement membrane. AMD can cause death of RPE cells and photoreceptors in the macula (Hageman et al., 2001; Young, 1987). Vision loss associated with AMD can be irreversible. For this reason, efforts currently focus on measures to understand and thereby prevent the development of AMD.
While the exact pathogenesis of AMD is not currently known, it is likely a multifactorial process that is thought to develop from a combination of oxidative stress and inflammation (Anderson et al., 2002; Dunaief, 2006; Zarbin, 2004). Evidence for these mechanisms comes from known risk factors and protective agents. An antioxidant formulation including lutein, vitamin C, vitamin E, and zinc has been shown to reduce the risk of developing advanced AMD (Age-Related Eye Disease Study 2 Research Group, 2013). Polymorphisms in genes encoding several complement cascade inhibitors – including complement factor H, complement component 2, and complement factor B – have been shown to significantly increase the risk of developing AMD (Klein et al., 2005; Hageman et al., 2005; Gold et al., 2006; McKay et al., 2009). More evidence comes from pathological analysis of AMD retinas. Granules of lipofuscin, photo-responsive compounds known to generate reactive oxygen species, accumulate in the RPE cells of patients with AMD (Sarks et al., 1988). Similarly, complement cascade components such as complement factors C3b and C5 are known constituents of drusen (Johnson et al., 2001).
Iron is also implicated in AMD pathogenesis, and its mechanisms are currently under investigation. Studies have reported increased levels of iron in post mortem maculas of patients with AMD (Hahn et al., 2003). Specifically, iron has been shown to accumulate within Bruch’s membrane and metal-binding melanosomes in the RPE (Biesemeier et al., 2015). Moreover, patients with increased retinal iron due to aceruloplasminemia tend to develop AMD-like disease at an earlier age than the general population (Cibis et al., 1959; Dunaief et al., 2005; Wolkow et al., 2011). Ceruloplasmin and hephaestin double knockout mice exhibit features of AMD, and demonstrate iron accumulation, oxidative stress, as well as increased complement activation in the retina (Hahn et al., 2004; Hadziahmetovic et al., 2008). Some of the mechanisms by which iron may mediate AMD pathology have already been studied. For example, recent investigations demonstrated that increased iron upregulates expression of C3 – a key protein involved in the complement cascade (Li et al., 2015). Furthermore, iron is a known source of free radicals by way of the Fenton reaction, and iron has been linked to oxidative stress in the retina by several studies (Dunaief, 2006; Song et al., 2014, 2012; Lukinova et al., 2009).
In a previous study, we presented evidence of subretinal iron injection causing inflammasome-mediated toxicity in the RPE (Gelfand et al., 2015). In contrast, this present study investigates whether an acute increase in systemic iron via intravenous injection leads to increased retinal iron, and whether these elevated iron levels are correlated with retinal degeneration. In particular, the IV route of iron administration is clinically relevant because IV iron therapy is commonly used to treat iron deficiency anemia. With evidence that iron excess may predispose to AMD, it is apparent that the ophthalmic risks of iron infusions need to be further researched. In this study, we not only test our hypothesis in mice, but also correlate our findings with a clinical case of a patient who experienced macular degeneration at age 43 after receiving IV iron therapy.
2. Methods
2.1 Animals
C57BL/6J male mice were randomized into two groups: iron-sucrose-injected (Venofer, American Regent, INC, NY) mice (+Fe, n=6) and controls (−Fe, n=5). The +Fe mice received weekly tail vein injections of 1.2 mg iron-sucrose diluted in normal saline, beginning at 2 months of age for a total of 12 injections. The −Fe mice were injected with IV sucrose (30%) with equivalent volumes at equivalent timings to the +Fe mice. All mice were housed in the same conditions and were fed a diet containing 300 ppm iron. Mice were sacrificed at 12 months of age for histologic studies.
A separate cohort of C57BL/6J male mice aged 10 weeks was used for initial quantitative PCR (qPCR) testing after two injections with either iron-sucrose (n=3) or sucrose (30%) (n=3). Mice were euthanized twenty-four hours after the last injection.
Euthanasia for all mice was carried out using i.p. phenobarbital injection followed by cervical dislocation. Mice were handled in accordance with the Institutional Animal Care and Use Committee of the University of Pennsylvania.
2.2 Quantitative Real-Time PCR
Gene expression in the mouse retinas was evaluated in the neurosensory retina (NSR) and RPE cells separately as described elsewhere (Wolkow et al., 2012). Taqman Probes (ABI, Grand Island, NY, USA) were used to detect ferritin light chain (Ftl, Mm03030144_g1) and transferrin receptor (Tfrc, Mm00441941_m1) expression, as indirect markers of iron. Eukaryotic 18S rRNA (Hs99999901_s1) was used as an endogenous control. qPCR was performed using a DNA amplification/detection system (Prism model 7500; ABI) with the ΔΔCT method, which provides normalized expression values. The amount of target mRNA was compared among the groups of interest. All reactions were performed in biological and technical triplicates (three qPCR replicates per biological sample).
2.3 Immunofluorescence
Enucleated eyes were fixed in 4% paraformaldehyde and the cornea, iris, and lens were removed to form eye cups. Eye cups were immersed in 30% sucrose overnight for dehydration and embedded in Tissue-Tek OCT (Sakura Fintek, Torrance, CA, USA) for freezing. 10μm-thick sections were cut through the sagittal plane. Retinal ferritin levels were evaluated using immunofluorescence techniques detailed elsewhere (Dunaief et al., 2002). Rabbit anti-mouse L-ferritin (kind gift from P. Arosio, University of Brescia) was used as a primary antibody. Consecutive sections were tested with L-ferritin and no primary antibodies, the latter serving as a negative control. Anti-rabbit Cy3 was used as a secondary antibody on all sections. Sections were imaged with fluorescence microscopy under constant exposure parameters (Nikon 80i microscope, Nikon, Tokyo, Japan) and analyzed using NIS-Elements (Nikon). Quantification of signal intensity in the various retinal layers was determined by mean intensity measurements using ImageJ (Rasband 2014). Three sections from each eye were imaged (two primary antibody and one no-primary antibody groups). Mean image intensities were calculated using images obtained by a masked observer from 4 control and 5 experimental mice.
2.4 Toluidine Blue and Perls’ Stain
Enucleated eyes were fixed in 2% paraformaldehyde and 2% glutaraldehyde. Lens and cornea were removed to form eye cups. Eye cups were dehydrated in increasing concentrations of ethanol, and then embedded in plastic (JB4; Polysciences, Inc., Warrington, PA, USA). 3-μm thick plastic sections were cut through the sagittal plane. Plastic sections were stained with toluidine blue, as described elsewhere (Bhoiwala et al., 2015). To evaluate iron levels, plastic sections were stained using the hot Perls’ protocol with bleaching (Theurl et al., 2016). Stained sections were evaluated under bright field microscopy (Nikon 80i).
2.5 Quantification of Retinal Degeneration
Two types of degeneration were studied: vacuolization in the RPE and photoreceptor layers, and thickening of Bruch’s membrane. Analysis for both degeneration types was performed on plastic sections using bright field microscopy (Nikon 80i). Five slides, each with 14 consecutive plastic sections, were chosen for each eye. Two slides from temporal sections, one slide containing the optic nerve head, and two slides from nasal sections, were chosen. Slides were masked before analysis.
Vacuolization was evaluated using ImageJ analysis of photomicrographs. Measurements were taken from each slide and section and averaged among all the sections for a given eye. RPE was marked if it was either directly affected by vacuolization and/or adjacent to photoreceptors that were affected by vacuolization. The sum of the lengths of these affected RPE sections in a single image was then divided by the total length of the RPE in that image to calculate the proportion of RPE affected by vacuolization for individual eyes.
2.6 Measurement of iron accumulation in liver
To assess the systemic iron exposures of the mice, livers were harvested following sacrifice, and concentrations of non-heme iron in the liver were measured using the bathophenanthroline protocol (Torrance and Bothwell, 1968). Concentrations were determined in μg iron per g liver tissue.
2.7 Study Approval
All mouse experiments were approved by the Institutional Animal Care and Use Committee (IACUC) of the University of Pennsylvania (protocol number 804558). The patient described in this study was enrolled in a study approved by the IRB of the University of Pennsylvania.
3. Results
3.1 Iron accumulates in the RPE and not in the neurosensory retinas of mice aged 10 weeks following 2 weekly IV iron-sucrose injections
Ferritin light chain (Ft-L) and transferrin receptor (Tfrc) were used as indirect measures of iron accumulation in the mouse retinas. In the setting of high intracellular labile iron levels, Ft-L transcription and translation are increased, whereas Tfrc mRNA stability is decreased (Gárate and Núñez, 2000). These phenomena have been observed previously in retinal iron overload mouse models and RPE cell culture studies (Hahn et al. PNAS 2004; Li et al., 2015; Zhao et al., 2014). After two weekly iron-sucrose injections, the NSR of +Fe mice had similar Ft-L and Tfrc mRNA levels compared to controls (Figure 1A,B). However, the +Fe RPE layer demonstrated both significantly increased Ft-L mRNA levels and significantly decreased Tfrc mRNA levels compared to controls (Figure 1C,D), indicating increased iron levels in the RPE.
Figure 1. Iron accumulates in the RPE but not neurosensory retinas of mice aged 10 weeks following 2 weekly IV iron-sucrose injections.

Ferritin light chain (Ft-l) and transferrin receptor (Tfrc) were used as measures of iron levels within the retinas. Quantitative PCR results of Ft-l and Tfrc are shown for the neurosensory retina (A, B) and RPE (C, D). mRNA levels of Ft-l and Tfrc in the NSR remain unchanged post IV iron injections. However, Ft-L mRNA expression increased (**) within RPE demonstrating iron overload, while Tfrc correspondingly decreased. Statistical analysis was performed using an Unpaired Student’s T-test for +Fe (n=5) vs. − Fe (n=4). Bars indicate mean ± SEM. P values were labeled as non-significant “n.s.”, (p > 0.05), * (p < 0.05), ** (p < 0.001), *** (p < 0.0001).
3.2 Immunofluorescence of ferritin in mouse retinas
The increase in Ft-L mRNA levels demonstrated by qPCR in mice after two iron-sucrose injections was supported by immunolabeling in the mice receiving long-term injections. After 12 injections, choroidal and scleral accumulation of Ft-L was pronounced (Figure 2C vs A). Signal intensity analysis of the images showed significant differences in Ft-L signal between +Fe and −Fe eyes (Figure 2E–G). These differences were most pronounced in the choroid, where mean relative intensity was over twice as high at 2.11 ± 0.24 in +Fe eyes compared to 1.01 ± 0.10 in −Fe eyes (mean ± SEM, p<0.05). RPE cells did not demonstrate increased Ft-L signal in the +Fe eyes compared to −Fe eyes, potentially due to pigment in the cells blocking transmission of immunofluorescence signal more so than the other, non-pigmented cell types. In addition, qPCR represents a more sensitive and quantitative measure of Ft-L production in comparison to immunohistochemical staining.
Figure 2. Immunofluorescence of ferritin in mouse retinas.

Comparison of frozen retinal sections from mice after 12 injections of sucrose (30%) (A,B) or 1.2 mg iron-sucrose (C,D), stained for ferritin with anti-Ft-L (red) and DAPI to stain nuclei (blue). Scale bars indicate 100 μm. (E-G) Ft-L fluorescent signal quantification from neurosensory retinal (NSR), choroid (Ch), and scleral (Sc) layers in iron-injected mice (+Fe, n=6) and normalized with respect to signal in the control mice (−Fe, n=5). Statistical analysis was performed using an Unpaired Student’s T-test. P values were labeled as non-significant “n.s.”, ** (p < 0.001).
3.3 Focally increased iron as detected by Perls’ stain
Perls’ staining for ferric iron demonstrated that in +Fe eyes, ferric iron accumulated focally within the RPE layer (black arrows in Figure 3A, inset C), BrM (red arrows), and the choroidal vasculature. No such accumulation was observed in −Fe eyes (Figure 3B).
Figure 3. Perls’ iron staining in mouse retinas.

Plastic sections stained with Perls’ Prussian blue stain after 12 IV injections of iron-sucrose (A) and after 12 IV injections of sucrose (B). (C) Magnification of the area of interest in (A). Focal areas of increased iron staining were seen in iron-injected mice in the RPE (black arrows in A,C), Bruch’s membrane (red arrows in A,C) and choroidal vasculature. No focal staining was seen in the control mouse. Scale bars indicate 10 μm.
3.4 Vacuolization as a component of retinal degeneration in mice following IV iron injections
Several histological effects were grossly evident on light microscopy: hypertrophy of RPE cells (yellow line in Figure 4B, inset 4C) as well as vacuolization in the photoreceptor outer segments (red asterisk in Figure 4B, inset 4C) and in RPE cells (yellow arrow heads in Figure 4B, inset 4C) Vacuolization in the outer segment layer always coincided with some degree of vacuolization of the adjacent RPE cells, but there were many instances of RPE cell vacuolization without outer segment degeneration (Figure 4D).
Figure 4. Vacuolization as a component of retinal degeneration in mice following IV iron injections.

Toluidene blue staining of plastic sections of mouse retinas. (A) An area of normal mouse retina from a mouse receiving 12 injections of sucrose is compared to (B) an area of degeneration seen in a mouse receiving 12 injections of 1.2 mg iron-sucrose. GCL: ganglion cell layer. IPL: inner plexiform layer. INL: inner nuclear layer. ONL: outer nuclear layer. IS, OS: inner, outer segments of the photoreceptors. RPE: retinal pigment epithelium. (C) Magnification of the area of interest in (B). Vacuolization is evident in the outer segment layer (red asterisks in B,C) and RPE cells (yellow arrow heads in B,C). RPE cell hypertrophy (yellow line in B,C) is also apparent. Layers above the outer segment appear normal. Scale bars indicate 50 μm in (A) and (B), and 25 μm in (C) and (D). (D) RPE was marked if it was either directly affected by vacuolization and/or adjacent to photoreceptors that were affected by vacuolization (red lines). The sum of the lengths of these affected RPE sections in a single image (red lines) was then divided by the total length of the RPE in that image (yellow line) to calculate (E) the proportion of RPE affected by vacuolization for individual mice. Bars indicate mean ± SEM. (F) The proportion of the retina affected by RPE/photoreceptor vacuolization for each eye compared to the corresponding choroidal Ft-L signal. Data from mice after 12 injections of sucrose (−Fe) or 1.2 mg iron-sucrose (+Fe) were plotted vs choroidal Ft-L signal. Linear regression analysis was performed to find a single line of best fit for both sets of data. (G) Electron micrograph at 3000x magnification showing no vacuolization in a −Fe eye. (H) Comparison micrograph in a +Fe eye showing vacuolization in the apical RPE (black asterisks) surrounded by disorganized photoreceptor outer segments (red arrows). RPE: retinal pigment epithelium. Scale bar indicates 10 μm.
Since some vacuolization was observed in −Fe eyes, the difference in degree of vacuolization between +Fe and −Fe eyes was quantified by calculating the proportion of the total RPE length in each image that either exhibited vacuolization or was immediately adjacent to vacuolization in the photoreceptor outer segment layer (Figure 4D,E). This calculated proportion was significantly higher in the +Fe eyes compared to −Fe eyes, with overall average scores of 0.156 ± 0.007 and 0.008 ± 0.001, respectively (mean ± SEM, p<0.0001). Furthermore, two out of the four −Fe eyes studied had no visible vacuolization, whereas all +Fe eyes contained vacuolized RPE (Figure 4E).
Because Ft-L signal intensity was most apparent in the choroid, linear regression analysis was performed to examine the relationship between choroidal Ft-L immunofluorescence intensity and the proportion of retina affected by vacuolization (Figure 4F). A positive correlation was identified (R2=0.6190, n=6 for +Fe, n=4 for −Fe).
To better characterize the vacuolization, electron microscopy was performed (Figure 4G,H). Some vacuoles appeared as blebs of the apical RPE membrane (asterisks in Figure 4H). It should be noted that other vacuoles appeared in the mid-cytoplasmic region of the RPE basal to melanosomes (asterisks in Figure 5E). The basal RPE appeared unchanged between +Fe and −Fe eyes. Of note, compared to −Fe eyes (Figure 4G), +Fe eyes exhibited disorganization of the photoreceptor outer segment layer surrounding the vacuoles (arrows in Figure 4H).
Figure 5. Bruch’s membrane thickening on light microscopy.

(A) Example of BrM (outlined in red) in control group (−Fe). (B) BrM of experimental group (+Fe) displaying increased thickness. Scale bar indicates 3 μm. (C) Average BrM thickness of +Fe mice (n=6) is significantly increased relative to −Fe mice (n=4). Statistical analysis was performed using an Unpaired Student’s T-test. Bars indicate mean ± SEM. P value was labeled as * for (p < 0.05). (D) Electron micrograph at 10000x magnification showing a uniform and thin BrM (red line) and basal infolding of the RPE in a −Fe eye. (E) Comparison micrograph in a +Fe eye showing an irregular and relatively thicker BrM (red line), and deposit formation between BrM and the RPE (red arrow). Purple asterisks indicate mid-cytoplasmic vacuolization basal to RPE melanosomes. BrM: Bruch’s membrane. BI: basal infolding; RPE: retinal pigment epithelium. Scale bar indicates 2 μm.
3.5 Bruch’s membrane thickening and deposit formation in mice following IV iron injections
Another physical change identified on light microscopy was a thickening of BrM. For each section, the region with the thickest BrM was identified under light microscopy (Figure 5A–C). There was a significant difference in thickness between +Fe (n=6) and −Fe (n=4) eyes: 1.168 ± 0.05057 μm vs 1.004 ± 0.05365 μm, respectively (mean ± SEM, p<0.05, Figure 5C).
Because light microscopy alone cannot distinguish between intrinsic BrM thickening or deposit formation between/within BrM and the RPE, ultrastructural analysis was performed. As the pathology was so focal, quantitative EM analysis was not thought to be practical. However, electron micrographs provided the following qualitative information: the BrM in +Fe eyes appeared thicker and more irregular than in −Fe eyes (Figure 5D,E). In addition, deposits were identified between BrM and the RPE basal infoldings; they possessed an intermediate density between that of BrM and of the RPE (arrow in Figure 5E).
3.6 Autofluorescence imaging shows no significant accumulation of lipofuscin in IV iron-injected mice
As lipofuscin is another characteristic feature of AMD patients, lipofuscin accumulation was tested by measuring autofluorescence of slices that were used for immunostaining. There was no significant difference: relative pixel density was 24.96 ± 2.513 in +Fe eyes (n=5) and 24.97 ± 2.526 in −Fe eyes (n=4) (mean ± SEM, p>0.05).
3.7 Complement component C3 accumulation within the sub-RPE in IV iron-injected mice
To explore the role of complement in the observed pathological changes, immunolabeling was performed using antibodies against complement component C3 (Figure 6). Fluorescent imaging revealed an increase in C3 deposition near the basolateral surface of the RPE in +Fe mice (Figure 6A–D). Mean relative intensity in +Fe eyes was 15.26 ± 1.526 (n=5) compared to 9.294 ± 1.163 (n=4) in −Fe eyes (mean ± SEM, p<0,05, Figure 6F). In addition, the retinal vasculature became immunoreactive in +Fe eyes.
Figure 6. IV iron injections in the murine model lead to sub-RPE complement (C3) accumulation.

(A) Fluorescence photomicrograph of anti-C3 immunofluorescence in IV iron-injected eyes (+Fe) in the murine model following 12 injections of 1.2 mg/ 200 ul iron sucrose solution. A magnified inset is provided (red box). Arrows indicate RPE. (B) DAPI and FITC anti-C3 staining in the IV sucrose injected control group (−Fe) receiving 300 mg of sucrose, with magnified inset. (C) FITC- anti-C3 immunostaining displays significant sub-RPE C3 within the +Fe group as compared to the −Fe group, shown in (D) with minimal C3 deposition. (E) No primary antibody representative image. (F) Pixel density analysis of FITC anti-C3 intensity within the RPE indicates an elevation in C3 intensity within the +Fe group. Statistical analysis was performed using an Unpaired Student’s T-test for +Fe (n=5) vs. − Fe (n=4). P value was labeled as * (p < 0.05).
3.8 Liver iron quantification
Finally, to confirm that the mice indeed experienced systemic increases in iron, liver iron levels were measured. Iron-sucrose injected mice had a hepatic iron concentration of 1328 ± 44 μg Fe / g tissue, compared to 72.43 ± 2.44 μg Fe / g tissue (wet weight) in controls (mean ± SEM, p<0.001) (Figure 7).
Figure 7. qPCR of murine liver indicates systemic effects after IV iron-sucrose injections.
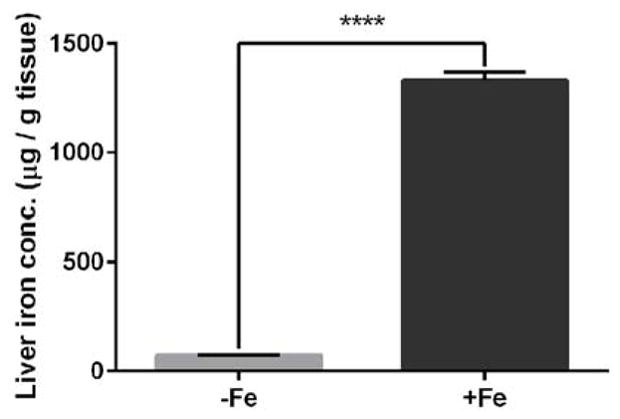
Iron concentration in liver tissue based on wet weight in mice after 12 injections of either sucrose (30%) (−Fe) or 1.2 mg iron-sucrose (+Fe), as measured by the bathophenanthroline protocol. Statistical analysis was performed using an Unpaired Student’s T-test.). P value was labeled **** (p < 0.0001). Bars indicate mean ± SEM.
3.9 Clinical Correlate
In a clinical case presented herein, a 43-year-old woman who had received IV iron therapy for iron-deficiency anemia subsequently developed acute onset of bilateral drusen. The patient received IV iron-sucrose (“Venofer”) at 300mg in 250mL normal saline infused over two hours, for a total of three weekly infusions. The patient had no prior ocular history or relevant family history, and had normal cardiovascular and lipid profiles. 11 months following Venofer treatment, the patient noted difficulty reading at night and delayed low-light adaptation, and ophthalmic examination revealed numerous medium and small drusen in both maculas, as well as several large macular drusen in the right eye (Figure 8)– i.e. high-risk AMD (AREDS grade III) (“The age-related eye disease study system for classifying age-related macular degeneration from stereoscopic color fundus photographs,” 2001). There was no attenuation of the retinal vessels or aberrant pigment deposit. There was no geographic atrophy or evidence of choroidal neovascularization, and no significant morphological change during the 3.5 year follow-up period. Because the patient’s brother had developed open-angle glaucoma in his 40s, the patient had received frequent eye exams. A normal dilated eye examination was documented two years prior to presentation, or thirteen months prior to starting Venofer treatment.
Figure 8. Multimodal patient imaging.
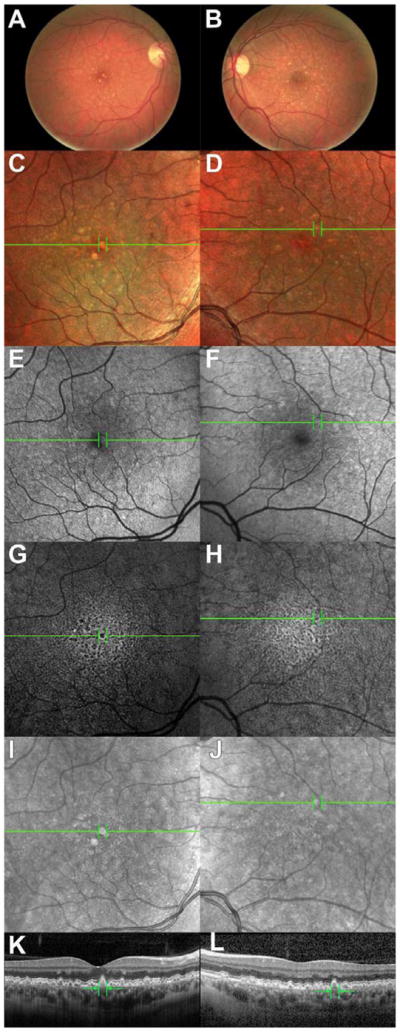
Color fundus photographs of the (A) right and (B) left eyes demonstrating multiple medium- and small-sized drusen, as well as a few large drusen. (C,D): MultiColor imaging in (C) right and (D) left eyes demonstrating multiple drusen as seen in fundus photography. (E,F): SW-AF images demonstrating areas of abnormal autofluorescence in (E) right and (F) left eyes. (G,H): IR-AF images demonstrating areas of abnormal autofluorescence in (G) right and (H) left eyes. IRAF and to a lesser extent SW-AF demonstrate areas of hypo-autofluorescence surrounded by relative hyperautofluorescence corresponding to positions of drusen. (I–L): IR reflectance and SD-OCT images of (I,K) right and (J,L) left eye demonstrating areas of medium and large size drusen as well as a “sawtoothed” baseline. Green lines (A–J) indicate the cross-section represented in (K–L). All images are from approximately 3.5 years after the patient’s initial presentation.
The fundus photo appearance was mirrored in MultiColor imaging (Figure 8C,D). A speckled pattern with distinct areas of drusen was seen in IR-AF imaging, where the location of each drusen was hypo-autofluorescent with a sharp surrounding ring of enhanced autofluorescence (Figure 8G–H). Similar patterns were seen in SW-AF images (Figure 8E–F), although to a significantly lesser extent. Spectral domain optical coherence tomography (SD-OCT; Spectralis HRS, Heidelberg Engineering, Heidelberg, Germany) revealed many distinct elevations below the RPE that exhibited a medium-intensity reflectance, including a “sawtoothed” baseline appearance (Figure 8I–L). The patient’s complete blood count and iron studies demonstrated a complete normalization of all parameters after treatment (Table 1), indicating Venofer’s effectiveness as well as suggesting that the medication was indeed systemically well-distributed.
Table 1. Selected patient laboratory data.
Relevant bloodwork is listed for the patient prior to (Pre-Fe) and subsequent to (Post-Fe) receiving IV iron treatment. Abnormal lab results are indicated in bold.
| Reference Range | Pre-Fe | Post-Fe | |
|---|---|---|---|
| Red Blood Cell Count (M/μL) | 3.85–5.15 | 4.37 | 4.54 |
| Hemoglobin (g/dL) | 12.0–14.5 | 9.7 | 13 |
| Hematocrit (%) | 36.0–44.5 | 31.8 | 40.4 |
| Mean Corpuscular Volume (fL) | 81.5–97.5 | 72.8 | 89 |
| Red Blood Cell Distribution Width (%) | 11.5–15.5 | 17.5 | 13.1 |
| Iron (μg/dL) | 33–151 | 19 | 97 |
| Total Iron-Binding Capacity (μg/dL) | 228–428 | 428 | N/A |
| Ferritin (ng/mL) | 13–150 | 4.7 | 14.9 |
To assess for genetic risk, the patient’s DNA was tested using the Macula Risk pGx (Arctic Medical Laboratories), which demonstrated intermediate or high risk genetic variants for 13 of 15 single nucleotide polymorphisms tested (Table 2).
Table 2. Patient genome analysis.
Results of the Macula Risk pGx testing are shown, detailing the patient’s specific variant in 15 genes (NN for normal) and the conferred AMD risk (L – low, I – intermediate, H – high).
| Locus | Gene | SNP | Variant | AMD Risk |
|---|---|---|---|---|
| 1 | CFH | rs3766405 | CT | I |
| 2 | CFH | rs412852 | CT | I |
| 3 | CFH | rs1048663 | GG | H |
| 4 | CFI | rs10033900 | TT | H |
| 5 | C3 | rs2230199 | GG | H |
| 6 | C2 | rs9332739 | GG | H |
| 7 | CFB | rs541862 | AA | H |
| 8 | LIPC | rs10468017 | CT | I |
| 9 | ABCA1 | rs1883025 | CT | I |
| 10 | CETP | rs3764261 | AC | I |
| 11 | COL8A1 | rs13095226 | TT | H |
| 12 | APOE | rs7412 | CC | L |
| 13 | APOE | rs429358 | CT | I |
| 14 | TIMP3 | rs9621532 | AA | H |
| 15 | ARMS2 | 372_815del443ins | NN | L |
4. Discussion
Retinal iron overload caused by intravitreal injection (Gelfand et al., 2015) or mutations in iron handling genes causes retinal degeneration with features of AMD (Gnana-Prakasam et al., 2012; Hadziahmetovic et al., 2008; Hadziahmetovic et al., 2011). In contrast, the present study investigates whether acute increases in systemic iron via intravenous iron injections can lead to increases in retinal iron. If IV iron injections can indeed cause retinal iron accumulation, then we would expect to see AMD-like retinal pathology such as vacuolization, drusen deposition, Bruch’s membrane thickening, and complement activation. The IV route of iron administration is clinically relevant because there are many patients receiving IV iron for iron deficiency anemia.
It is well established that ferritin and transferrin receptor are reliable indirect measures of local iron accumulation in mouse retinas (Song and Dunaief, 2013). Accordingly, we used Ft-L and transferrin receptor (Tfrc) because mRNAs of both are correlated with intracellular labile iron levels: Ft-L is positively correlated, whereas Tfrc is negatively correlated (Hahn et al., 2004). Tfrc mRNA stability is regulated by the iron response element/iron regulatory protein (IRE/IRP) system. When intracellular iron levels are high, IRPs do not bind to IREs within the 5′-UTR of ferritin and the 3′-UTR of transferrin receptor, which causes free translation of ferritin and decreased stability of transferrin receptor mRNA (Song and Dunaief, 2013). In iron-deficient cells, IRPs bind to the aforementioned IREs, allowing further transport of iron into the iron-deficient cells. Therefore, quantifying Ft-L and Tfrc mRNA levels was an important step in establishing the amount of iron accumulation in the murine retina. Ft-L and Tfrc levels were assessed using qPCR, which showed that IV iron does lead to local iron accumulation and subsequent degeneration in the RPE and photoreceptors. Relative to controls, Ft-L mRNA was significantly increased and transferrin receptor mRNA was decreased in the RPE but not the NSR in +Fe mice. Our interpretation of these data is that the blood-retinal barrier protects against influx of iron from the serum to the inner retina but not to the RPE—as the RPE itself is a component of the barrier (Bhoiwala et al., 2015; Zhao et al., 2014).
Immunohistochemistry demonstrated significant differences in Ft-L only in the choroid and sclera, not in the neurosensory retina (NSR). Moreover, Perls’ staining confirmed the accumulation of iron in the RPE. The distribution of iron, as measured by Ft-L levels, suggests that most of the iron that does enter the retina when systemic iron levels are high enters via the fenestrated choroidal vasculature and accumulates in the RPE, rather than entering through the retinal vasculature with its tight junctions. While immunohistochemistry is only a semi-quantitative measure, the signal intensity of Ft-L measured in the choroid correlated with RPE vacuolization. Thus, concentrations of iron in the local environment may predispose to retinal degeneration in a somewhat dose dependent manner, potentially paving the way for RPE degeneration.
The degeneration exhibited by the +Fe mice eyes aligned well with known AMD histological findings. RPE vacuolization in response to iron-mediated oxidative stress, as well as subsequent cell hypertrophy were seen in the iron-exposed mice. These are pathological changes in AMD, especially in areas overlying drusen (Anderson et al., 2002). When quantified, a significantly increased proportion of the RPE was affected by vacuolization in +Fe eyes relative to −Fe eyes. On electron microscopy, vacuoles were seen in both the mid-cytoplasmic RPE basal to melanosomes and as apical blebs, whereas the basal RPE was spared. The vacuoles were surrounded by disorganized photoreceptor outer segments. Finally, the observation that all vacuolization in the photoreceptor outer segment layer was associated with RPE vacuolization—but not vice versa—provides support for a distinct unidirectional progression of vacuolar degeneration secondary to iron accumulation. We hypothesize that the vacuolization discussed earlier in the outer segment was secondary to an initial insult to RPE cells. While iron itself may not enter the NSR to a great extent, its oxidative effects may transcend the iron transport barriers, as evidenced by the photoreceptor vacuolization. This suggests that the blood-retinal barrier may remain intact, preventing further iron accumulation in the neurosensory retina, but that degeneration in the photoreceptor layer may result from RPE cell dysfunction or death.
Another AMD-like pathology investigated in this study was Bruch’s membrane (BrM) thickening. This thickening, as seen in the iron-exposed eyes on both light and electron microscopy, is associated with the formation of drusen in AMD (Young, 1987). In much the same way as drusen are thought to form, BrM thickening likely results from RPE cell dysfunction leading to pathologic accumulation of various materials in BrM including filamentous debris and abnormal forms of collagen (Young, 1987). Thus, while drusen were not seen in the +Fe mice, the RPE dysfunction that they represent was exhibited in the thickening of BrM.
Nonetheless, because light microscopy does not possess the resolution to determine whether thickening is intrinsic to BrM or instead represents deposition of other materials, electron microscopy was also performed. Micrographs revealed BrM thickening and deposit formation between BrM and RPE. These pathological changes appeared in a very focal distribution, thus making quantitative analysis impractical. Instead, light microscopy was used to quantitatively determine a significant increase in BrM thickening, which electron micrographs attribute to both intrinsic thickening and sub-RPE deposit formation.
The next pathologic change we studied was lipofuscin. Since lipofuscin build-up is a hallmark of AMD, autofluorescence imaging was performed. It showed no significant difference in relative pixel density between +Fe and −Fe eyes (p>0.05). There was also high variability within both groups; one potential reason for this intra-group variability is that the mice were 12 mo when sacrificed, and thus more likely to develop lipofuscin deposits independent of iron toxicity (Dunaief, 2006).
Iron has been shown to upregulate complement C3 transcription and protein activation (Li et al., 2015). Immunohistochemistry and subsequent pixel density analysis of RPE anti-C3 intensity was used to semi-quantitatively determine the amount of C3. Immunostaining demonstrated an increase in complement deposition on the basal side of the RPE. This may have resulted from C3 upregulation in the RPE, in the circulation, or both.
To confirm that the observed retinal iron accumulation and degeneration was associated with systemic increases in iron, liver iron levels were measured. Iron was increased 18-fold within the murine liver, thus confirming that systemic iron increased following IV iron injection. The resulting RPE iron accumulation and degeneration may translate into a clinical setting for patients with various iron deficiency or overloaded conditions. For example, liver biopsies from patients with high levels of iron-overload from various causes (e.g., idiopathic hemochromatosis and thalassemia major) were found to be 27.27 mg Fe / g tissue (dry weight), 35-fold higher than a normal value of 0.77 mg Fe / g tissue (Barry, 1974). Standard dosing for IV iron-sucrose in non-hemodialysis patients is 1000 mg over a two week period, or approximately 14 mg/kg over a span of 2 weeks. While the iron dosage used in our mouse experiment to cause increased RPE iron (2 doses) was ~6-fold higher than that typically used in humans, and the amount needed to produce RPE degeneration in wild-type mice was as much as 25-fold higher, the amount of iron measured in the mouse livers was elevated to a lower degree (on a mg/kg basis) than is seen in several iron overload states in humans. In addition, the actual IV dose in mice was likely reduced by the technical challenge of mouse tail vein injections.
The patient described herein was 43 years old when drusen were first detected, which is significantly younger than the average age of onset for AMD. In two large population-based cohort studies of patients aged 43 to 86 years old in one study and 49 to 97 years old in the other, no AMD lesions were found in patients under the age of 55 (Smith et al., 2001). Furthermore, the patient’s presentation is not consistent with alternative causes of drusen. Doyne’s familial honeycomb dystrophy can have onset in the fourth decade, but the patient’s drusen topography and lack of family history of this autosomal dominant disease makes it an unlikely diagnosis (Piguet et al., 1995). Other inherited drusen syndromes tend to present in childhood or occur with concurrent systemic symptoms not seen in this patient (Savige et al., 2011). Thus, the patient’s AMD risk alleles and clinical examination make early-onset AMD the most likely explanation. With the acute onset of the disease discovered only 11 months following infusions, it is likely that her predisposition was exacerbated by her exposure to systemic iron IV injections.
To our knowledge, the development of AMD-like features within one year of IV iron supplementation has not previously been described. However, retinal pathology has been described in patients with chronic disorders of iron regulation, such as hemochromatosis and aceruloplasminemia (Dunaief et al., 2005; Zerbib et al., 2015). In the latter, patients can present with features similar to those found in AMD, such as RPE atrophy and hypertrophy, drusen formation, lipofuscin accumulation, and complement deposition. These findings suggest that iron overload, whether chronic or sub-acute, may induce degenerative changes in the RPE layer.
Genetic testing for the patient revealed several high-risk variants in complement component genes. Our laboratory recently reported that sub-acute iron overload in cultured human RPE cells can induce the transcriptional up-regulation of the complement factor 3 (C3) gene (Li et al., 2015). Given this mechanistic link between iron and complement expression and activity, we hypothesize that in this patient, RPE cells internalized the iron, exacerbating underlying defects in the regulation of complement in the RPE, thereby promoting pathological changes that culminate in drusen formation. In this way, iron supplementation may “tip the balance” towards AMD in genetically susceptible individuals.
On FAF, the central hypoautofluorescence surrounded by an annulus of hyperautofluorescence in areas corresponding to drusen are consistent with known findings in AMD-associated drusen (Delori et al., 2000) and suggest RPE degeneration in those areas (Bindewald et al., 2005). Overall, the FAF and color fundus images suggest an AMD pattern (Bindewald et al., 2005), with numerous discrete drusen. Interestingly, the sharp contrasts between hypo- and hyper-autofluorescence in the IR-AF images, and the “sawtooth” appearance of the SD-OCT profile both suggest a cuticular drusen type (Leng et al., 2009; Spaide and Curcio, 2010). Indeed, IR-AF and SD-OCT demonstrate much more numerous and clustered drusen than seen in fundus photography. The pathology seen in this patient seems to share features of typical AMD drusen as well as cuticular drusen.
In summary, we presented a new mouse model demonstrating the potential for IV iron infusions to cause a retinopathy. This was correlated with a case of AMD-like maculopathy developing in the setting of several risk alleles for AMD and the infusion of iron-sucrose for iron deficiency anemia treatment. Ongoing studies in our research group are investigating prevalence of retinopathy in patients receiving iron treatment who would otherwise not be receiving eye examinations. We are currently investigating a mouse model with complement mutations to more closely replicate the clinical case scenario presented herein. While the exact risk of maculopathy associated with iron infusions remains unclear, our study suggests there may be a risk, especially in those patients with genetic predisposition for AMD.
Highlights.
A mouse model of intravenous iron associated retinal degeneration is demonstrated
Intravenous iron accumulates in the RPE of iron-injected mice
The degeneration includes Bruch’s membrane thickening and RPE vacuolization
A clinical case of intravenous iron-associated drusen is described
Acknowledgments
We acknowledge the support of the National Eye Institute, through grants EY015240 and U01EY025477; the National Heart, Lung and Blood Institute, National Institutes of Health, through grant R25-HL084665; the National Center for Advancing Translational Sciences of the NIH, through grant KL2TR001879; the University of Pennsylvania, through the Vision Science Training Grant; Research to Prevent Blindness, Foundation Fighting Blindness; the Paula and Evanina Bell Mackall Foundation Trust; the F. M. Kirby Foundation; and a gift in memory of Dr. Lee F. Mauger.
Footnotes
Conflict of Interest
No authors have conflicts of interest.
The content is solely the responsibility of the authors and does not necessarily represent the official views of the NIH.
Publisher's Disclaimer: This is a PDF file of an unedited manuscript that has been accepted for publication. As a service to our customers we are providing this early version of the manuscript. The manuscript will undergo copyediting, typesetting, and review of the resulting proof before it is published in its final citable form. Please note that during the production process errors may be discovered which could affect the content, and all legal disclaimers that apply to the journal pertain.
References
- Age-Related Eye Disease Study 2 Research Group. Lutein + zeaxanthin and omega-3 fatty acids for age-related macular degeneration: the Age-Related Eye Disease Study 2 (AREDS2) randomized clinical trial. JAMA. 2013;309:2005–2015. doi: 10.1001/jama.2013.4997. [DOI] [PubMed] [Google Scholar]
- Anderson DH, Mullins RF, Hageman GS, Johnson LV. A role for local inflammation in the formation of drusen in the aging eye. Am J Ophthalmol. 2002;134:411–431. doi: 10.1016/S0002-9394(02)01624-0. [DOI] [PubMed] [Google Scholar]
- Barry M. Liver iron concentration, stainable iron, and total body storage iron. Gut. 1974;15:411–415. doi: 10.1136/gut.15.5.411. [DOI] [PMC free article] [PubMed] [Google Scholar]
- Bhoiwala DL, Song Y, Cwanger A, Clark E, Zhao L-L, Wang C, Li Y, Song D, Dunaief JL. CD1 Mouse Retina Is Shielded From Iron Overload Caused by a High Iron Diet. Invest Ophthalmol Vis Sci. 2015;56:5344–5352. doi: 10.1167/iovs.15-17026. [DOI] [PMC free article] [PubMed] [Google Scholar]
- Biesemeier A, Yoeruek E, Eibl O, Schraermeyer U. Iron accumulation in Bruch’s membrane and melanosomes of donor eyes with age-related macular degeneration. Exp Eye Res. 2015;137:39–49. doi: 10.1016/j.exer.2015.05.019. [DOI] [PubMed] [Google Scholar]
- Bindewald A, Bird AC, Dandekar SS, Dolar-Szczasny J, Dreyhaupt J, Fitzke FW, Einbock W, Holz FG, Jorzik JJ, Keilhauer C, Lois N, Mlynski J, Pauleikhoff D, Staurenghi G, Wolf S. Classification of fundus autofluorescence patterns in early age-related macular disease. Invest Ophthalmol Vis Sci. 2005;46:3309–3314. doi: 10.1167/iovs.04-0430. [DOI] [PubMed] [Google Scholar]
- Cibis PA, Yamashita T, Rodriguez F. Clinical aspects of ocular siderosis and hemosiderosis. AMA Arch Ophthalmol. 1959;62:180–187. [PubMed] [Google Scholar]
- Delori FC, Fleckner MR, Goger DG, Weiter JJ, Dorey CK. Autofluorescence distribution associated with drusen in age-related macular degeneration. Invest Ophthalmol Vis Sci. 2000;41:496–504. [PubMed] [Google Scholar]
- Dubra A, Harvey Z. Registration of 2D Images from Fast Scanning Ophthalmic Instruments. In: Fischer B, Dawant BM, Lorenz C, editors. Biomedical Image Registration, Lecture Notes in Computer Science. Springer; Berlin Heidelberg: 2010. pp. 60–71. [Google Scholar]
- Dubra A, Sulai Y. Reflective afocal broadband adaptive optics scanning ophthalmoscope. Biomed Opt Express. 2011;2:1757–1768. doi: 10.1364/BOE.2.001757. [DOI] [PMC free article] [PubMed] [Google Scholar]
- Dunaief JL, Richa C, Franks EP, Schultze RL, Aleman TS, Schenck JF, Zimmerman EA, Brooks DG. Macular degeneration in a patient with aceruloplasminemia, a disease associated with retinal iron overload. Ophthalmol. 2005;112:1062–1065. doi: 10.1016/j.ophtha.2004.12.029. [DOI] [PubMed] [Google Scholar]
- Dunaief JL. Iron induced oxidative damage as a potential factor in age-related macular degeneration: the Cogan Lecture. Invest Ophthalmol Vis Sci. 2006;47:4660–4664. doi: 10.1167/iovs.06-0568. [DOI] [PubMed] [Google Scholar]
- Dunaief JL, Dentchev T, Ying GS, Milam AH. The role of apoptosis in age-related macular degeneration. Arch Ophthalmol Chic Ill 1960. 2002;120:1435–1442. doi: 10.1001/archopht.120.11.1435. [DOI] [PubMed] [Google Scholar]
- Dunaief JL, Richa C, Franks EP, Schultze RL, Aleman TS, Schenck JF, Zimmerman EA, Brooks DG. Macular degeneration in a patient with aceruloplasminemia, a disease associated with retinal iron overload. Ophthalmology. 2005;112:1062–1065. doi: 10.1016/j.ophtha.2004.12.029. [DOI] [PubMed] [Google Scholar]
- Gárate MA, Núñez MT. Overexpression of the ferritin iron-responsive element decreases the labile iron pool and abolishes the regulation of iron absorption by intestinal epithelial (Caco-2) cells. J Biol Chem. 2000;275:1651–1655. doi: 10.1074/jbc.275.3.1651. [DOI] [PubMed] [Google Scholar]
- Gelfand BD, Wright CB, Kim Y, Yasuma T, Yasuma R, Li S, Fowler BJ, Bastos-Carvalho A, Kerur N, Uittenbogaard A, Han YS, Lou D, Kleinman ME, McDonald WH, Nunez G, Georgel P, Duanief JL, Ambati J. Iron toxicity in the retina requires Alu RNA and the NLRP3 Inflammasome. Cell Rep. 2015;11:1686–93. doi: 10.1016/j.celrep.2015.05.023. [DOI] [PMC free article] [PubMed] [Google Scholar]
- Gnana-Prakasam JP, Tawfik A, Romej M, Ananth S, Martin PM, Smith SB, Ganapathy V. Iron-mediated retinal degeneration in hemojuvelin knockout mice. The Biochemical Journal. 2012;441:599–608. doi: 10.1042/BJ20111148. [DOI] [PMC free article] [PubMed] [Google Scholar]
- Gold B, Merriam JE, Zernant J, Hancox LS, Taiber AJ, Gehrs K, Cramer K, Neel J, Bergeron J, Barile GR, Smith RT, Hageman GS, Dean M, Allikmets R AMD Genetics Clinical Study Group. Variation in factor B (BF) and complement component 2 (C2) genes is associated with age-related macular degeneration. Nat Genet. 2006;38:458–462. doi: 10.1038/ng1750. [DOI] [PMC free article] [PubMed] [Google Scholar]
- Hadziahmetovic M, Dentchev T, Song Y, Haddad N, He X, Hahn P, Pratico D, Wen R, Harris ZL, Lambris JD, Beard J, Dunaief JL. Ceruloplasmin/hephaestin knockout mice model morphologic and molecular features of AMD. Invest Ophthalmol Vis Sci. 2008;49:2728–2736. doi: 10.1167/iovs.07-1472. [DOI] [PMC free article] [PubMed] [Google Scholar]
- Hadziahmetovic M, Song Y, Ponnuru P, Iacovelli J, Hunter A, Haddad N, Beard J, Connor JR, Vaulont S, Dunaief JL. Age-dependent retinal iron accumulation and degeneration in hepcidin knockout mice. Invest Ophthalmol Vis Sci. 2011;52:109–118. doi: 10.1167/iovs.10-6113. [DOI] [PMC free article] [PubMed] [Google Scholar]
- Hageman GS, Anderson DH, Johnson LV, Hancox LS, Taiber AJ, Hardisty LI, Hageman JL, Stockman HA, Borchardt JD, Gehrs KM, Smith RJH, Silvestri G, Russell SR, Klaver CCW, Barbazetto I, Chang S, Yannuzzi LA, Barile GR, Merriam JC, Smith RT, Olsh AK, Bergeron J, Zernant J, Merriam JE, Gold B, Dean M, Allikmets R. A common haplotype in the complement regulatory gene factor H (HF1/CFH) predisposes individuals to age-related macular degeneration. Proc Natl Acad Sci U S A. 2005;102:7227–7232. doi: 10.1073/pnas.0501536102. [DOI] [PMC free article] [PubMed] [Google Scholar]
- Hageman GS, Luthert PJ, Victor Chong NH, Johnson LV, Anderson DH, Mullins RF. An integrated hypothesis that considers drusen as biomarkers of immune-mediated processes at the RPE-Bruch’s membrane interface in aging and age-related macular degeneration. Prog Retin Eye Res. 2001;20:705–732. doi: 10.1016/s1350-9462(01)00010-6. [DOI] [PubMed] [Google Scholar]
- Hahn P, Milam AH, Dunaief JL. Maculas affected by age-related macular degeneration contain increased chelatable iron in the retinal pigment epithelium and Bruch’s membrane. Arch Ophthalmol Chic Ill 1960. 2003;121:1099–1105. doi: 10.1001/archopht.121.8.1099. [DOI] [PubMed] [Google Scholar]
- Hahn P, Qian Y, Dentchev T, Chen L, Beard J, Harris ZL, Dunaief JL. Disruption of ceruloplasmin and hephaestin in mice causes retinal iron overload and retinal degeneration with features of age-related macular degeneration. Proc Natl Acad Sci U S A. 2004;101:13850–13855. doi: 10.1073/pnas.0405146101. [DOI] [PMC free article] [PubMed] [Google Scholar]
- Johnson LV, Leitner WP, Staples MK, Anderson DH. Complement Activation and Inflammatory Processes in Drusen Formation and Age Related Macular Degeneration. Exp Eye Res. 2001;73:887–896. doi: 10.1006/exer.2001.1094. [DOI] [PubMed] [Google Scholar]
- Klein RJ, Zeiss C, Chew EY, Tsai JY, Sackler RS, Haynes C, Henning AK, SanGiovanni JP, Mane SM, Mayne ST, Bracken MB, Ferris FL, Ott J, Barnstable C, Hoh J. Complement factor H polymorphism in age-related macular degeneration. Science. 2005;308:385–389. doi: 10.1126/science.1109557. [DOI] [PMC free article] [PubMed] [Google Scholar]
- Kolb H. Simple Anatomy of the Retina. In: Kolb H, Fernandez E, Nelson R, editors. Webvision: The Organization of the Retina and Visual System. University of Utah Health Sciences Center; Salt Lake City (UT): 1995. [PubMed] [Google Scholar]
- Laatikainen L, Hirvelä H. Prevalence and visual consequences of macular changes in a population aged 70 years and older. Acta Ophthalmol Scand. 1995;73:105–110. doi: 10.1111/j.1600-0420.1995.tb00647.x. [DOI] [PubMed] [Google Scholar]
- Leng T, Rosenfeld PJ, Gregori G, Puliafito CA, Punjabi OS. Spectral domain optical coherence tomography characteristics of cuticular drusen. Retina Phila Pa. 2009;29:988–993. doi: 10.1097/IAE.0b013e3181ae7113. [DOI] [PubMed] [Google Scholar]
- Li Y, Song D, Song Y, Zhao L, Wolkow N, Tobias JW, Song W, Dunaief JL. Iron-induced Local Complement Component 3 (C3) Up-regulation via Non-canonical Transforming Growth Factor (TGF)-β Signaling in the Retinal Pigment Epithelium. J Biol Chem. 2015;290:11918–11934. doi: 10.1074/jbc.M115.645903. [DOI] [PMC free article] [PubMed] [Google Scholar]
- Lukinova N, Iacovelli J, Dentchev T, Wolkow N, Hunter A, Amado D, Ying G-S, Sparrow JR, Dunaief JL. Iron chelation protects the retinal pigment epithelial cell line ARPE-19 against cell death triggered by diverse stimuli. Invest Ophthalmol Vis Sci. 2009;50:1440–1447. doi: 10.1167/iovs.08-2545. [DOI] [PMC free article] [PubMed] [Google Scholar]
- McKay GJ, Silvestri G, Patterson CC, Hogg RE, Chakravarthy U, Hughes AE. Further assessment of the complement component 2 and factor B region associated with age-related macular degeneration. Invest Ophthalmol Vis Sci. 2009;50:533–539. doi: 10.1167/iovs.08-2275. [DOI] [PubMed] [Google Scholar]
- Murakami Y, Miller JW, Vavvas DG. RIP kinase-mediated necrosis as an alternative mechanisms of photoreceptor death. Oncotarget. 2011;2:497–509. doi: 10.18632/oncotarget.286. [DOI] [PMC free article] [PubMed] [Google Scholar]
- Piguet B, Haimovici R, Bird AC. Dominantly inherited drusen represent more than one disorder: a historical review. Eye Lond Engl. 1995;9(Pt 1):34–41. doi: 10.1038/eye.1995.5. [DOI] [PubMed] [Google Scholar]
- Sarks JP, Sarks SH, Killingsworth MC. Evolution of geographic atrophy of the retinal pigment epithelium. Eye Lond Engl. 1988;2(Pt 5):552–577. doi: 10.1038/eye.1988.106. [DOI] [PubMed] [Google Scholar]
- Savige J, Ratnaike S, Colville D. Retinal abnormalities characteristic of inherited renal disease. J Am Soc Nephrol JASN. 2011;22:1403–1415. doi: 10.1681/ASN.2010090965. [DOI] [PubMed] [Google Scholar]
- Scoles D, Sulai YN, Langlo CS, Fishman GA, Curcio CA, Carroll J, Dubra A. In vivo imaging of human cone photoreceptor inner segments. Invest Ophthalmol Vis Sci. 2014;55:4244–4251. doi: 10.1167/iovs.14-14542. [DOI] [PMC free article] [PubMed] [Google Scholar]
- Smith W, Assink J, Klein R, Mitchell P, Klaver CC, Klein BE, Hofman A, Jensen S, Wang JJ, de Jong PT. Risk factors for age-related macular degeneration: Pooled findings from three continents. Ophthalmology. 2001;108:697–704. doi: 10.1016/s0161-6420(00)00580-7. [DOI] [PubMed] [Google Scholar]
- Song D, Dunaief JL. Retinal iron homeostasis in health and disease. Frontiers in Aging Neuroscience. 2013;5:24. doi: 10.3389/fnagi.2013.00024. [DOI] [PMC free article] [PubMed] [Google Scholar]
- Song D, Song Y, Hadziahmetovic M, Zhong Y, Dunaief JL. Systemic administration of the iron chelator deferiprone protects against light-induced photoreceptor degeneration in the mouse retina. Free Radic Biol Med. 2012;53:64–71. doi: 10.1016/j.freeradbiomed.2012.04.020. [DOI] [PMC free article] [PubMed] [Google Scholar]
- Song D, Zhao L, Li Y, Hadziahmetovic M, Song Y, Connelly J, Spino M, Dunaief JL. The oral iron chelator deferiprone protects against systemic iron overload-induced retinal degeneration in hepcidin knockout mice. Invest Ophthalmol Vis Sci. 2014;55:4525–4532. doi: 10.1167/iovs.14-14568. [DOI] [PMC free article] [PubMed] [Google Scholar]
- Spaide RF, Curcio CA. Drusen Characterization with Multimodal Imaging. Retina Phila Pa. 2010;30:1441–1454. doi: 10.1097/IAE.0b013e3181ee5ce8. [DOI] [PMC free article] [PubMed] [Google Scholar]
- The age-related eye disease study system for classifying age-related macular degeneration from stereoscopic color fundus photographs: the age-related eye disease study report number 6. Am J Ophthalmol. 2001;132:668–681. doi: 10.1016/S0002-9394(01)01218-1. [DOI] [PubMed] [Google Scholar]
- The Eye Diseases Prevalence Research Group*. PRevalence of age-related macular degeneration in the united states. Arch Ophthalmol. 2004;122:564–572. doi: 10.1001/archopht.122.4.564. [DOI] [PubMed] [Google Scholar]
- Theurl M, Song D, Clark E, Sterling J, Grieco S, Altamura S, Galy B, Hentze M, Muckenthaler MU, Dunaief JL. Mice with hepcidin-resistant ferroportin accumulate iron in the retina. FASEB J. 2016;30:813–23. doi: 10.1096/fj.15-276758. [DOI] [PMC free article] [PubMed] [Google Scholar]
- Torrance JD, Bothwell TH. A simple technique for measuring storage iron concentrations in formalinised liver samples. S Afr J Med Sci. 1968;33:9–11. [PubMed] [Google Scholar]
- Wolkow N, Song D, Song Y, Chu S, Hadziahmetovic M, Lee JC, Iacovelli J, Grieco S, Dunaief JL. Ferroxidase hephaestin’s cell-autonomous role in the retinal pigment epithelium. Am J Pathol. 2012;180:1614–1624. doi: 10.1016/j.ajpath.2011.12.041. [DOI] [PMC free article] [PubMed] [Google Scholar]
- Wolkow N, Song Y, Wu TD, Qian J, Guerquin-Kern JL, Dunaief JL. Aceruloplasminemia: retinal histopathology and iron-mediated melanosome degradation. Archives of Ophthalmology. 2011;129:1466–1474. doi: 10.1001/archophthalmol.2011.309. [DOI] [PMC free article] [PubMed] [Google Scholar]
- Young RW. Pathophysiology of age-related macular degeneration. Surv Ophthalmol. 1987;31:291–306. doi: 10.1016/0039-6257(87)90115-9. [DOI] [PubMed] [Google Scholar]
- Zarbin MA. Current concepts in the pathogenesis of age-related macular degeneration. Arch Ophthalmol Chic Ill 1960. 2004;122:598–614. doi: 10.1001/archopht.122.4.598. [DOI] [PubMed] [Google Scholar]
- Zerbib J, Pierre-Kahn V, Sikorav A, Oubraham H, Sayag D, Lobstein F, Massonnet-Castel S, Haymann-Gawrilow P, Souied EH. Unusual retinopathy associated with hemochromatosis. Retin Cases Brief Rep. 2015;9:190–194. doi: 10.1097/ICB.0000000000000135. [DOI] [PubMed] [Google Scholar]
- Zhao L, Li Y, Song D, Song Y, Theurl M, Wang C, Cwanger A, Su G, Dunaief JL. A High Serum Iron Level Causes Mouse Retinal Iron Accumulation Despite an Intact Blood-Retinal Barrier. Am J Pathol. 2014;184:2862–2867. doi: 10.1016/j.ajpath.2014.07.008. [DOI] [PMC free article] [PubMed] [Google Scholar]