

Summary
Co‐receptors, being either co‐stimulatory or co‐inhibitory, play a pivotal role in T‐cell immunity. Several studies have indicated that CD43, one of the abundant T‐cell surface glycoproteins, acts not only as a potent co‐receptor but also as a negative regulator for T‐cell activation. Here we demonstrate that co‐stimulation of human peripheral blood (PB) T cells through two distinct CD43 epitopes recognized by monoclonal antibodies (mAb) CD43‐6E5 (T6E5‐act) and CD43‐10G7 (T10G7‐act) potently induced T‐cell proliferation. However, T‐cell co‐stimulation through two CD43 epitopes differentially regulated activation of nuclear factor of activated T cells (NFAT) and nuclear factor‐κB (NF‐κB) transcription factors, T‐cell cytokine production and effector function. T6E5‐act produced high levels of interleukin‐22 (IL‐22) and interferon‐γ (IFN‐γ) similar to T cells activated via CD28 (TCD 28‐act), whereas T10G7‐act produced low levels of inflammatory cytokines but higher levels of regulatory cytokines transforming growth factor‐β (TGF‐β) and interleukin‐35 (IL‐35). Compared with T6E5‐act or to TCD 28‐act, T10G7‐act performed poorly in response to re‐stimulation and further acquired a T‐cell suppressive function. T10G7‐act did not directly inhibit proliferation of responder T cells, but formed stable heterotypic clusters with dendritic cells (DC) via CD2 to constrain activation of responder T cells. Together, our data demonstrate that CD43 is a unique and polarizing regulator of T‐cell function.
Keywords: CD43, co‐stimulation, heterotypic cell adhesion, suppressor T cells, T‐cell polarization
Abbreviations
- APC
antigen‐presenting cells
- AP‐1
activator protein 1
- CB
cord blood
- DC
dendritic cells
- IFN‐γ
interferon‐γ
- IL
interleukin
- mAb
monoclonal antibody
- MLR
mixed leucocyte reaction
- NFAT
nuclear factor of activated T cells
- NF‐κB
nuclear factor‐κB
- PB
peripheral blood
- PBMC
peripheral blood mononuclear cells
- T10G7‐act
peripheral blood T cells activated via CD3/CD43‐10G7
- T6E5‐act
peripheral blood T cells activated via CD3/CD43‐6E5
- TCD28‐act
peripheral blood T cells activated via CD3/CD28
- TCR
T cell receptor
- TGF‐β
transforming growth factor‐β
Introduction
CD43 (sialophorin, leukosialin) is a conserved, transmembrane sialoglycoprotein expressed on most haematopoietic cells except resting B cells and erythrocytes.1 It extends ≈ 45 nm from the cell surface and is one of the most abundant molecules expressed on leucocytes.2, 3 Several studies have addressed the function of CD43 during the last 30 years, but its physiological role is still unclear and is particularly controversial in T cells.
In human and murine T cells, CD43 has been shown to synergize with T‐cell receptor (TCR) signalling to induce T‐cell activation and proliferation independent of CD28 co‐stimulation.4, 5 Signal transduction through CD43 induces Ca2+ mobilization. When cross‐linked with monoclonal antibodies (mAbs), T‐cell stimulation via CD43 leads to activation of the mitogen‐activated protein kinase pathway and further induces the DNA binding activity of nuclear factor‐κB (NF‐κB), nuclear factor of activated T cells (NFAT) and activator protein 1 (AP‐1) transcription factors.6, 7, 8 Downstream of T‐cell co‐stimulation, CD43 triggers various target genes that may exhibit some overlap with CD28 co‐stimulation.9 T‐cell co‐stimulation via CD43 in the presence of TCR signalling has been shown to not only promote interferon‐γ (IFN‐γ) production by CD4+ as well as CD8+ T cells but also to negatively regulate T helper type 2 differentiation.10, 11, 12
Contrary to the co‐stimulatory role of CD43 reported in these studies, CD43 has been suggested to negatively regulate T‐cell activation.13 T cells from CD43‐deficient mice are hyper‐responsive to various mitogenic stimuli in vitro as well as in vivo.13, 14 Physical properties, such as large size and negatively charged surface, that in turn create a steric barrier for cell–cell contact, are mainly thought to be responsible for negative regulation of T‐cell adhesion, T‐cell–antigen‐presenting cell (APC) interaction and therefore of T‐cell activation by CD43. Likewise, TCR signalling has been reported to induce selective exclusion of CD43 from the immunological synapse to a distal polar complex.15 On the other hand, CD43 along with MHC‐I molecule is involved in spontaneous T‐cell conjugate formation, an initial step in T‐cell activation.16 Furthermore, expression of only cytoplasmic domain of CD43 in CD43−/− T cells could reverse the hyper‐proliferative effect of CD43 deficiency. The ectodomain of CD43 did not seem to interfere with the T‐cell–APC interaction.17 These observations suggest that negative regulation of T‐cell activation via CD43 is mainly facilitated by an intracellular mechanism and is not merely a phenomenon of a physical barrier function. Additionally, CD43−/− mice showed increased numbers of antigen‐specific CD8+ T cells compared with wild‐type mice during the course of viral response after the initial peak of expansion, indicating an important role of CD43 during the contraction of an immune response.18 Hence, CD43 seems capable of acting as both a positive and a negative regulator of T‐cell responses.
To elucidate the co‐stimulatory role of CD43 in T‐cell activation, we took advantage of two well‐defined CD43 mAbs 6E5 and 10G7 that bind to different, non‐overlapping epitopes on human CD43.19, 20 More importantly, previous studies have demonstrated that targeting CD43 with these two mAbs has different functional effects on T‐cell conjugate formation with APC.16 We demonstrate in this study that engagement of CD43 on human peripheral blood (PB) T cells via two distinct epitopes induces proliferation of T cells, which occurs in large cellular clusters. Yet, targeting of the two epitopes on T cells exerts polarizing effects such as differential activation of transcription factors, cytokine production and also effector functions. T cells co‐stimulated via the CD43‐6E5‐defined epitope produced high levels of IFN‐γ and interleukin‐22 (IL‐22) similar to CD28 co‐stimulation, but only low amounts of IL‐4 and IL‐17. In contrast, stimulation of PB T cells with mAb CD43‐10G7 resulted in poor production of all analysed cytokines except for inhibitory cytokines transforming growth factor‐β (TGF‐β) and IL‐35. Indeed, T10G7‐act showed a suppressive function, which was not critically dependent on these soluble factors but was mediated by inhibiting the T‐cell stimulatory function of APC. The suppressive T10G7‐act cells formed stable heterotypic clusters with co‐cultured dendritic cells (DC) primarily via CD2/CD58, to further hinder the activation of responder T cells by DC. Taken together, our data demonstrate that CD43 is a unique co‐receptor that can exert differential polarization of T‐cell function, through its different epitopes.
Materials and methods
Media, reagents and chemicals
Cells were cultured in RPMI‐1640, supplemented with 2 mm l‐glutamine, (both Gibco Ltd., Paisley, UK), 100 U/ml penicillin, 100 μg/ml streptomycin (PAA Laboratories, Pasching, Austria) and 10% fetal calf serum (Gibco). Ionomycin and PMA were purchased from Sigma‐Aldrich (St Louis, MO). Recombinant human granulocyte–macrophage colony‐stimulating factor and IL‐4 were kindly provided by Novo Nordisk A/S (Bagsværd, Denmark). IL‐2 was purchased from Peprotech (Rocky Hill, NJ).
Antibodies
The following murine mAbs were generated in our laboratory: negative control mAb VIAP (against calf intestine alkaline phosphatase), 6B7 (CD11a), 6E5 and 10G7 (CD43), 3G10 [CD25‐phycoerythrin (PE)], VIP1 (CD71‐Biot), VIM3 (CD97), L243 (HLA‐DR). The mAb MEM‐93 (CD45 RA‐Biot) was a kind gift from Václav Hořejší (Prague, Czech Republic). Hybridomas producing mAb TS2/18 (CD2), mAb TS.1/18 (CD18), mAb W6/32 (MHC class I) and G28‐5 (CD40) were obtained from the American Tissue Culture Collection (ATCC; Manassas, VA). The following mAbs were purchased: mAb FN50 (CD69‐FITC) (BD Biosciences, San Jose, CA); mAb 10F3 (CD28) and mAb against human IL‐4 (MP4‐25d2‐PE) (Invitrogen Carlsbad, CA); mAb HB15a (CD83‐PE) (Immunotech, Marseille, France); mAb B7‐2 (CD86‐PE) (Caltag Laboratories, Buckingham, UK); mAb EH12.1 (PD‐1‐PE) (BD Pharmingen, San Diego, CA); mAb L3D10 (CTLA‐4‐PE) (Biolegend, San Diego, CA); mAbs against human IL‐27/IL‐35 EBI3 subunit (607201‐AlexaFluor 488); human IFN‐γ (25723‐PerCP); human IL‐22 (142928‐allophycocyanin) (R&D Systems Inc. Minneapolis, MN) and FOXP3 (259D/C7‐AF647) (BD Biosciences, San Jose, CA). OKT3 (CD3) was obtained from Jansen‐Cilag (Vienna, Austria).
Isolation of primary T cells and generation of monocyte‐derived DC
Buffy coats from healthy donors were purchased from either Austrian Red Cross or University Clinic for Blood Group Serology and Transfusion Medicine, Medical University of Vienna (both, Vienna, Austria). To isolate peripheral blood mononuclear cells (PBMC), heparinized buffy coats were further separated by standard density gradient centrifugation (450 g for 30 min at room temperature) with Ficoll‐Paque™ Plus (GE Healthcare, Chalfont St Giles, UK). Subsequently, total T (CD3+) cells were obtained via depletion of CD11b+, CD14+, CD16+, CD19+, CD33+ and MHC class II+ cells from total PBMC. CD4+ and CD8+ T cells were also obtained by negative selection and monocytes were separated by positive selection using the MACS technique (Miltenyi Biotec, Bergisch Gladbach, Germany) as described previously.21 For isolation of CD4+ CD25+ regulatory T cells, CD4+ T cells were further incubated with CD25 antibody and were separated by positive selection using MACS. Naive T cells were isolated from umbilical cord blood (CB). CB samples from healthy donors were collected during full‐term deliveries. Ethical approval was obtained from the Medical University of Vienna, institutional review board. Informed consent was provided in accordance with the Declaration of Helsinki. Briefly, T cells were isolated from CD34‐depleted mononuclear cells obtained from CB, using the same protocol as described above. Purity of total T cells (PB T plus CB T cells), CD4+ and CD8+ T cells was checked routinely. Purity of each cell population was found to be ≥ 97%. Monocyte‐derived DC were generated by culturing purified monocytes for 7 days with a combination of granulocyte–macrophage colony‐stimulating factor (50 ng/ml) and IL‐4 (35 ng/ml).21
T‐cell proliferation assay
MAXISORP Nunc‐Immuno plates (Thermo Scientific, Waltham, MA) were coated overnight at 4° with either CD3 mAb (OKT3) alone or in combination with CD28 mAb (10F3) or one of the CD43 mAbs (6E5 or 10G7). All mAbs were used at 5 μg/ml. The plates were then washed to remove unbound mAbs and purified T cells (2 × 10⁵/well) were added to the respective wells. T‐cell proliferation was monitored, measuring [methyl‐3H]thymidine (PerkinElmer, Inc. Waltham, MA) incorporation at day 3. Cells were harvested 18 hr after adding [methyl‐3H]thymidine (0·05 mCi/well) and incorporated thymidine was detected on a microplate scintillation counter (Topcount; Packard, Meriden, CT) as counts per minute. Assays were performed in triplicates.
Mixed leucocyte reaction
For mixed leucocyte reaction (MLR) purified T cells (2 × 10⁵ cells/well) were stimulated with allogeneic DC (5 × 10⁴ cells/well). Experiments were performed in 96‐well round‐bottom cell culture plates in the presence of RPMI‐1640 medium (Mock) or indicated cell supernatants, as described previously.22 T‐cell proliferation was monitored, measuring [methyl‐3H]thymidine incorporation at day 5. Assays were performed in triplicates.
Flow cytometry analysis
For membrane staining, cells (2 × 10⁵) were incubated with either unconjugated or conjugated mAbs for 30 min at 4°. For unconjugated mAbs, Oregon Green® 488‐conjugated goat anti‐mouse IgG antibody (Life Technologies, Carlsbad, CA) and for biotinylated mAbs, PE‐conjugated streptavidin was used as the second‐step reagents.
Intracellular cytokine production was determined by pre‐treating the activated PB T cells, for 12 hr with 5 μm monensin (Sigma‐Aldrich) and then by fixing cells in FIX‐solution for 20 min at room temperature before incubating with the respective mAbs along with PERM‐Solution (both, AN DER GRUB Bio Research GmbH, Kaumberg, Austria) for 20 min at room temperature. Flow cytometry analyses were performed using FACScalibur (Becton Dickinson, Franklin Lakes, NJ).
Before FOXP3 staining, cell surface antigens (CD45RA) were stained as described above. Foxp3/Transcription factor staining buffer set (eBioscience Inc., San Diego, CA) was used for intracellular FOXP3 staining. Briefly, The cells were fixed with fixation buffer in the dark at room temperature for 20 min. Cells were then incubated with AF647 anti‐FOXP3 mAb or isotype control mAb in permeabilization buffer in the dark at room temperature for 30 min. Flow cytometry analyses were performed using LSRFortessa (Becton Dickinson).
Analysis of duration of CD43 mAb binding
Peripheral blood T cells were incubated with biotinylated CD43‐6E5 or CD43‐10G7 mAb at 4° for 1 hr. An initial binding of CD43 mAbs at 0 hr was immediately analysed by flow cytometry. Part of the labelled cells were maintained at 4°. For analysis at 37°, the labelled T cells were incubated with plate‐bound CD3 mAb, to ensure survival of T cells throughout 3 days of culture. At the indicated time‐point, cells were labelled with PE‐conjugated streptavidin as a second‐step reagent and were analysed by flow cytometry.
Determination of cytokine production
Peripheral blood T cells were activated via CD3/CD28 (TCD28‐act) CD3/CD43‐6E5 (T6E5‐act) or via CD3/CD43‐10G7 (T10G7‐act) as described above. At day 3 supernatants were harvested and were pooled from triplicate wells. Supernatants were then used for measuring T‐cell cytokines. Cytokines including IL‐2, IFN‐γ, IL‐4, IL‐13, IL‐17, IL‐22, IL‐10, TGF‐β were measured using the Luminex100 System (R&D Systems Inc.) as described in the manufacturer's protocol. All measurements were performed in duplicates.
Re‐stimulation of T cells
TCD28‐act, T6E5‐act and T10G7‐act were harvested at day 3 and were then further cultured for another 4 days in fresh media without stimulation. T cells were then re‐stimulated (2 × 10⁵ cells/well) via plate‐bound CD3/CD28, CD3/CD43‐6E5 or CD3/CD43‐10G7 in the presence or absence of exogenous IL‐2 (20 U/ml). T‐cell proliferation was analysed at day 3 by [methyl‐3H]thymidine incorporation. Assays were performed in triplicates.
T‐cell suppression assay
T6E5‐act, T10G7‐act and TCD28‐act were harvested at day 3 and rested in fresh medium without any stimulus for 4 days, as described above. T cells were then either irradiated (30 Gy, 137Cs source) or pre‐treated with 1% formaldehyde. Pre‐activated T cells, at various cell numbers, were then co‐cultured either with responder PB T cells (1 × 10⁵ cells/well) stimulated with immobilized CD3/CD28 mAb or in an allogeneic MLR with DC (5 × 10⁴ cells/well) and responder PB T cells (1 × 10⁵ cells/well). Where indicated, freshly isolated regulatory T cells were added to allogeneic MLR. Per cent suppression was calculated as described previously.23 For T cells activated via plate bound mAbs, proliferation was measured at day 3 and for an MLR at day 5 by [methyl‐3H]thymidine incorporation.
Real‐time PCR
Total cellular RNA was isolated using peqGOLD TriFast (Peqlab, Erlangen, Germany) with chloroform extraction, followed by isopropanol precipitation according to the manufacturer's protocol. The cDNA was generated using the Revert Aid MuLV‐RT kit (Fermentas, Burlington, Canada) using Oligo‐dT(18 mer) primers according to the manufacturer's protocol and was stored at −20° until further use. Quantitative real‐time PCR was performed with a CFX96 Real‐Time PCR Detection System (Bio‐Rad, Hercules, CA) using SYBR Green qPCR master mix (Quanta Biosciences, Gaithersburg, MD) for detection. CD3E was used as an endogenous reference gene.24 Specific primers for human IFNG, IL4, IL22, EBI3, p35, FOXP3, CD3E and p28 were designed using the software primer 3 plus 25 and were synthesized at Sigma‐Aldrich (see Supplementary material, Table S1). Data analysis was performed using CFX manager software (Bio‐Rad).
Cell aggregation assay
Dendritic cells were labelled with 1 μg/ml CellTrace™ Oregon Green® 488 (carboxy‐DFFDA‐SE) (Invitrogen) in PBS per 1 × 10⁷ cells, as per the manufacturer's protocol. The DC were then resuspended in complete RPMI medium. Labelled DC (5 × 10⁴ cells/well) were added to irradiated pre‐activated T cells (1 × 10⁵ cells/well). Where indicated, T6E5‐act, T10G7‐act or TCD28‐act cells were pre‐treated with either blocking anti‐LFA‐1 (CD11a/CD18) or CD2 mAbs (10 μg/ml), before irradiation. Images were taken using Nikon DS‐Fi1c under an inverted Nikon Eclipse Ti‐S fluorescence microscope (Tokyo, Japan) with 10 × magnification. Images were captured at three different locations in each well per assay.
Association of five or more cells (DC and T cells) was designated as a heterotypic cluster. The area of a heterotypic cluster was calculated using the image analysis program fiji.26 Briefly, the boundary of an individual heterotypic cluster was defined manually. The scale of an image was calibrated according to the scale bar and the area of each heterotypic cluster was then analysed using fiji.26 Number of DC per heterotypic cluster was determined by using definiens analysis software (Definiens AG, Munich, Germany). Oregon Green® 488‐positive DC were detected by stain intensity and were further segmented on the basis of preset thresholds for morphology and area of an individual cell.
For analysis of DC–T‐cell clustering by flow cytometry, DC were labelled with CellTrace™ Oregon Green® 488 as described above and pre‐activated T cells (either T6E5‐act, T10G7‐act or TCD28‐act) were labelled with 5 μm CellTracker™ Red CMTPX dye (Invitrogen) in serum‐free medium per 1 × 10⁷ cells, as per the manufacturer's protocol. Both DC and pre‐activated T cells were then resuspended in complete RPMI medium. Where indicated, pre‐activated T cells were pre‐treated with respective blocking mAbs. DC (5 × 10⁴ cells/well) were added to irradiated pre‐activated T cells (1 × 10⁵ cells/well). The cells were analysed by flow cytometry after 30 hr. Double‐positive cells were counted as T cells and DC clusters.
Multi‐channel reporter cell line assay
To analyse the activation of downstream signalling pathways, a multi‐channel reporter cell line Jurkat E6 expressing reporter gene under the control of NF‐κB, NFAT and AP‐1 promoter element was used as described previously.27 Briefly, a reporter cell line was generated by introducing constructs encoding NF‐κB‐CFP, NFAT‐eGFP and AP‐1‐mCherry into Jurkat E6 cells. A cell clone that was negative for fluorescent proteins in an unstimulated state and strongly up‐regulated CFP, eGFP and mCherry expression upon PMA/ionomycin treatment was selected for further use.28 The reporter cells were activated via plate‐bound CD28, CD43‐6E5 or CD43‐10G7 mAbs along with CD3 mAb. To assess the activation of the respective transcription factors, cells were harvested after 12 hr and expression of eGFP, CFP and mCherry were measured by flow cytometry using LSRFortessa (Becton Dickinson).
Statistical analysis
Statistical analysis was performed using graphpad prism software (GraphPad, La Jolla, CA). Unpaired, two‐tailed Student's t‐test followed by Holm–Šídák test for multiple comparisons was performed and P‐values < 0·05 were considered significant. Significant values are represented as *P < 0·05, **P < 0·01, ***P < 0·001.
Results
CD43 mAb 6E5 but not CD43‐10G7 down‐regulates cell surface expression of CD43
Previous studies have shown that both CD43 mAbs bind to different, non‐overlapping epitopes on human CD43.19 As a result of O‐linked glycosylation CD43 exists in two isoforms of size 115 000 and 135 000 MW.29 The 115 000 MW isoform is expressed on naive cells, whereas the 135 000 MW isoform of CD43 is associated with T‐cell activation.30 Results presented in Fig. 1(a(i)) demonstrate that both CD43 mAbs react with unstimulated PB T cells and CB T cells with similar intensity. Both CD43 mAbs also bound efficiently to PB T as well as CB T cells upon stimulation with PMA/ionomycin (Fig. 1a(ii)). Furthermore, PB T cells stimulated with PMA/ionomycin uniformly expressed the two defined epitopes, similar to unstimulated PB T cells (see Supplementary material, Fig. S1a). The 135 000 MW isoform of CD43 is constitutively expressed more on resting CD8+ T cells than CD4+ T cells.31 CD43‐6E5 and CD43‐10G7 mAbs showed comparable reactivity to PB CD4+ and CD8+ T cells (see Supplementary material, Fig. S1b). Binding studies showed that two mAbs react with CD43 on PB T cells with similar affinity (see Supplementary material, Fig. S1c). The two CD43 mAbs also showed similar duration of binding as analysed over the period of 3 days (see Supplementary material, Fig. S1d). Additionally, both CD43 mAbs showed reactivity with Bw5417 cells retrovirally transduced to express human CD43 (Bw‐CD43);32 but not with the parental Bw5417 cells (Bw) (see Supplementary material, Fig. S1e). Bw5417 cell line lacks C2GnT glycosyltransferase that initiates core 2 O‐glycan branching and can express only 115 000 MW isoform of CD43.33 Moreover, two CD43 mAbs bind to parental CD43+ CEM lymphoid T‐cell line but not to a CD43‐deficient CEM cell line.20 Together data suggest that CD43 mAbs 6E5 and 10G7 are specific for human CD43 and bind to different epitopes present on both isoforms of CD43.
Figure 1.
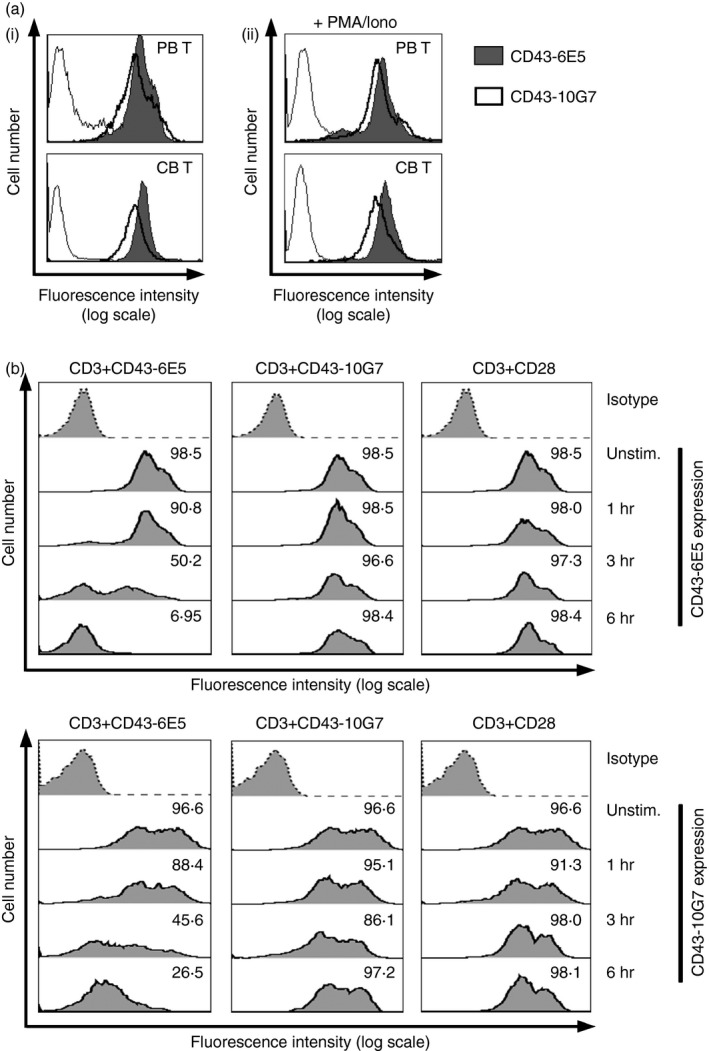
Cross‐linking of monoclonal antibody (mAb) CD43‐6E5 but not CD43‐10G7 down‐regulates CD43 expression. (a) Expression of CD43 epitopes defined by CD43‐6E5 (grey‐filled histograms), CD43‐10G7 (thick open histograms) compared with isotype control (thin open histograms) on unstimulated (i) and PMA/ionomycin (100 nm for 12 hr) stimulated (ii) peripheral blood (PB) T and cord blood (CB) T cells. Gate was set on live cell population (not shown). Data are representative of two independent experiments with four different donors for each PB T and CB T cells. (b) Expression profile of CD43‐6E5 and CD43‐10G7 (thick filled histograms) on unstimulated T cells, T cells stimulated via plate‐bound CD3/CD43‐6E5, CD3/CD43‐10G7 and CD3/CD28 for indicated time‐points. Reactivity of isotype control is also shown (dotted filled histograms). Numbers indicate percentage of positive cells. Gate was set on live cell population (not shown). Data shown are representative of three independent experiments with three different donors.
Crosslinking of CD43 with mAbs induces T‐cell co‐stimulation and also modulates the cell surface expression of CD43 on leucocytes.4, 6, 7, 8, 9, 10, 34 Therefore, we next analysed whether cell surface expression of CD43 is modulated by our CD43 mAbs. Results presented in Fig. 1(b) demonstrate that CD43 is strongly down‐regulated from cell surface upon activation with plate‐bound CD3/CD43‐6E5 but not with CD3/CD43‐10G7 or CD3/CD28. Down‐modulation of CD43 surface expression by CD43‐6E5 was fast and efficient and T cells were almost CD43‐negative after 6 hr of stimulation with CD3/CD43‐6E5 (Fig. 1b). Down‐regulation of CD43 surface expression by CD43‐6E5 could only be observed in the presence of TCR signalling. T‐cell stimulation with plate‐bound CD43‐6E5 alone did not modulate CD43 expression on T cells (see Supplementary material, Fig. S2). CD43 expression was restored to basic levels after 3 days of culture (data not shown).
Hence, both CD43 mAbs CD43‐6E5 and CD43‐10G7 show similar affinity and comparable expression profile on various T‐cell subsets, but differ in their ability to modulate CD43 cell surface expression (Fig. 1, and see Supplementary material, Fig. S1).
Co‐stimulation upon engagement of CD43 with mAb 6E5 or 10G7 induces T‐cell proliferation
We next assessed the functional ability of mAbs CD43‐6E5 and CD43‐10G7, to induce T‐cell co‐stimulation and T‐cell proliferation. Ligation of CD43 mAbs alone did not induce T‐cell proliferation (see Supplementary material, Fig. S3a). Both CD43 mAbs along with TCR signalling induced proliferation of PB T and CB T cells, but at marginally lower levels, compared with CD28 co‐stimulation (Fig. 2a, and see Supplementary material, Fig. S3b). Co‐stimulation via distinct CD43 epitopes could efficiently activate PB CD4+ as well as CD8+ T‐cell subsets (see Supplementary material, Fig. S3c). In line with the proliferation data, T6E5‐act and T10G7‐act also expressed various T‐cell activation markers including CD69, CD97 and HLA‐DR at comparable levels to TCD28‐act (Fig. 2b, and see Supplementary material, Fig. S3d). However, some of the other T‐cell activation markers including CD25 and CD71 were differentially regulated. T6E5‐act and T10G7‐act expressed lower levels of CD71 compared with TCD28‐act. The T6E5‐act expressed comparable levels of CD25 to TCD28‐act, whereas the expression of CD25 was significantly lower on T10G7‐act (Fig. 2b, and see Supplementary material, Fig. S3d).
Figure 2.
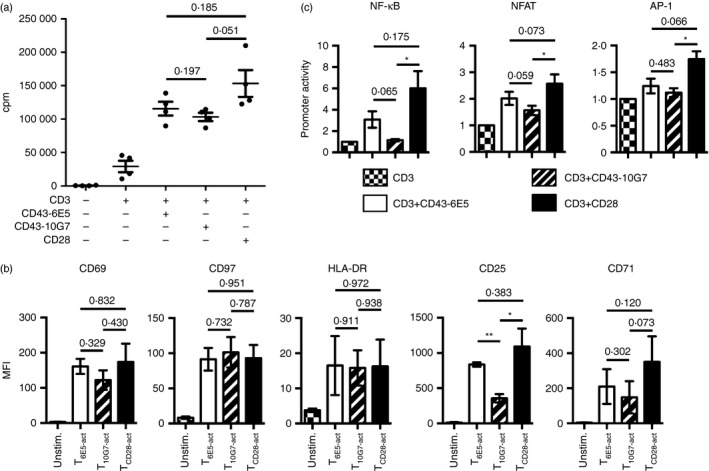
Co‐stimulation via CD43 monoclonal anitbodies (mAbs) induces peripheral blood (PB) T‐cell activation and proliferation. (a) PB T cells were activated via plate‐bound mAbs, CD3, CD3/CD43‐6E5, CD3/CD43‐10G7 or CD3/CD28. Proliferation was measured by analysing [methyl‐3H]thymidine incorporation (no. of experiment = 4, no. of donors = 4). (b) PB T cells were activated with the respective plate‐bound mAbs and analysed after 48 hr for expression of various cell surface markers by flow cytometry. Gate was set on live cell population (not shown). Graphs show mean fluorescence intensities of CD69, CD97, HLA‐DR, CD25 and CD71 on unstimulated T cells (checkered bars), T6E5‐act (open bars), T10G7‐act (striped bars) and TCD 28‐act (black bars) (no. of experiments = 3, no. of donors = 3). (c) Activation of nuclear factor‐κB (NF‐κB), nuclear factor of activated T cells (NFAT) and activator protein 1 (AP‐1) transcription factors via CD43. Jurkat E6 reporter cells were activated via indicated plate‐bound mAbs for 12 hr and were analysed for the expression of reporter genes by flow cytometry. Graphs show mean promoter activity values of NF‐κB (CFP), NFAT (eGFP) and AP‐1 (mCherry) of Jurkat E6 reporter cells, activated via plate‐bound CD3/CD43‐6E5, CD3/CD43‐10G7 and CD3/CD28, normalized to promoter activity of Jurkat E6 cells activated via immobilized CD3 alone (no. of experiments = 3). (a–c) Data show mean ± SEM (*P < 0·05, **P < 0·01).
CD43 has been reported to induce homotypic aggregation in leucocytes, including T cells.35, 36, 37, 38 T‐cell homotypic clustering is considered as a hallmark for efficient T‐cell activation in vitro. Likewise, PB T‐cell activation using immobilized CD43 mAbs along with TCR signalling induced a homotypic clustering response that was clearly visible after 30 hr (see Supplementary material, Fig. S3e).
Co‐stimulation via two CD43 epitopes differentially regulate activation of transcription factors
Previous studies have shown that T‐cell co‐stimulation via CD43 induces DNA binding activity of NF‐κB, NFAT and AP‐1 transcription factors.6 In assays using Jurkat E6 multi‐channel reporter cells that express both CD43 epitopes, co‐stimulation via CD43‐6E5 induced activation of NF‐κB (Fig. 2c, and see Supplementary material, Fig. S1f). However, NF‐κB activation was weaker compared with CD28 co‐stimulation (Fig. 2c). Co‐stimulation via CD43‐10G7 did not further enhance NF‐κB promoter activity compared with CD3 (Fig. 2c). NFAT reporter activity was comparable upon co‐stimulation via CD28 or via CD43‐6E5 but was lower upon activation via CD43‐10G7 (Fig. 2c). Compared with CD3 alone, AP‐1 promoter activity was further enhanced only upon CD28 co‐stimulation (Fig. 2c).
Differential regulation of helper T‐cell cytokines via CD43
T‐cell co‐stimulation via CD43 uses overlapping as well as distinct signalling pathways from CD28 co‐stimulation that in turn may differentially regulate target gene expression in primary human T cells.9 To further investigate the effect of CD43 co‐stimulation on subsequent T helper cell function, the production and secretion of various T‐cell cytokines in the supernatants of activated PB T cells was analysed. Similar to TCD28‐act, T6E5‐act secreted high levels of IL‐22 and IFN‐γ in the cell supernatant. However, compared with TCD28‐act, the measured levels of IL‐17 were significantly low in T6E5‐act cell supernatants (Fig. 3a). In contrast to T6E5‐act, supernatants of T10G7‐act contained significantly low amounts of IL‐22, IFN‐γ and also IL‐17 (Fig. 3a). Compared with TCD28‐act, supernatants of T6E5‐act as well as T10G7‐act contained very low levels of IL‐2 and T helper type 2 cytokines including IL‐4 and IL‐13 (Fig. 3a). These results were further confirmed by intracellular cytokine staining (Fig. 3b, and see Supplementary material, Table S2). The analysis of cytokine production at the protein level correlated with induction of mRNA. Results presented in Fig. 3(c) demonstrate that T10G7‐act expressed low levels of IFNG, IL4 and IL22 mRNA. On the other hand, IFNG and IL22 mRNA levels were high in T6E5‐act similar to TCD28‐act. However, T6E5‐act expressed only low levels of IL4 mRNA. The data suggest that T6E5‐act show substantial overlap with TCD28‐act, except for the induction of IL‐4, IL‐13 and IL‐2, whereas induction of various T‐cell signature cytokines is differentially regulated between the two epitopes on CD43 analysed in this study.
Figure 3.
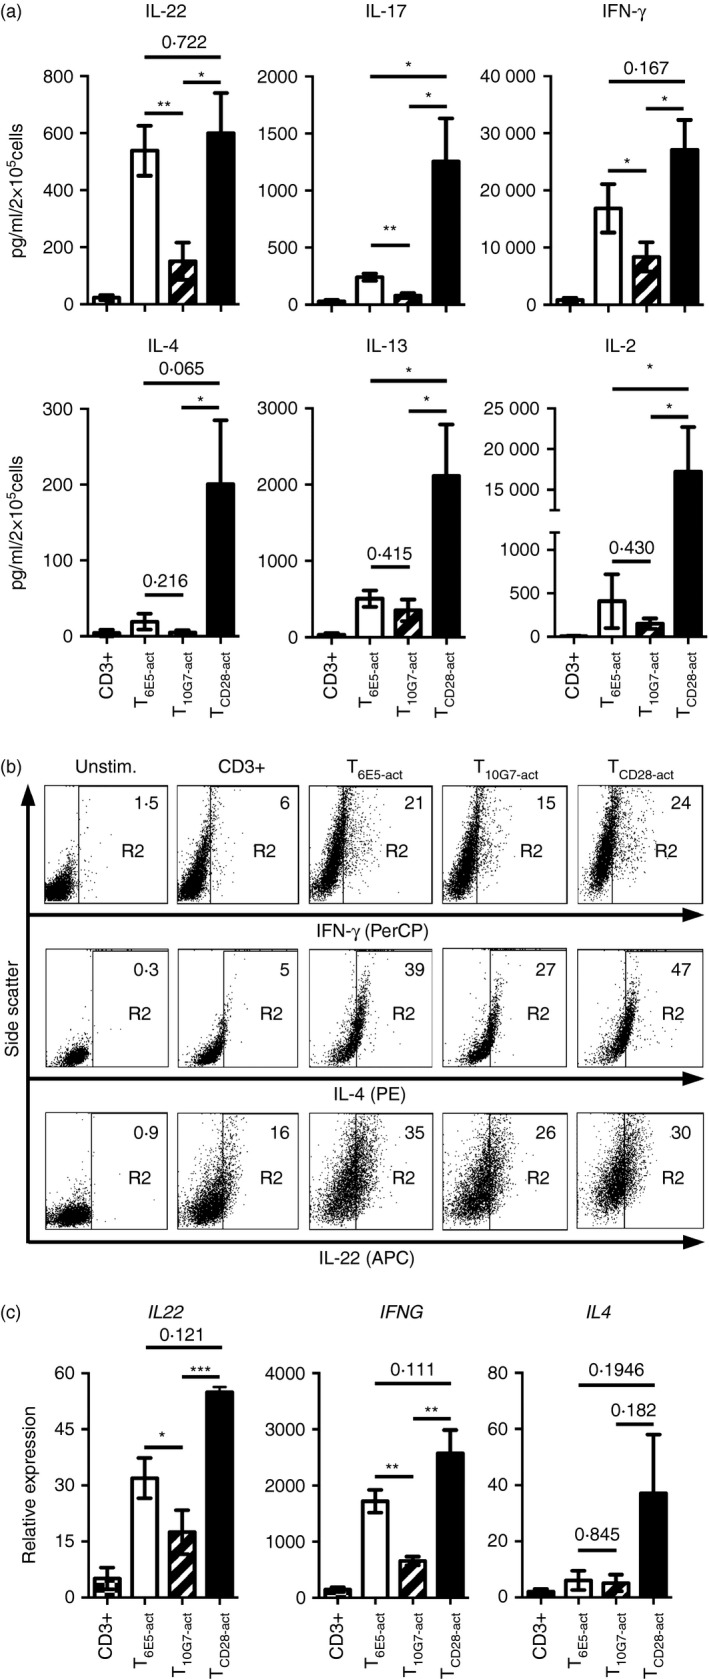
Differential regulation of pro‐inflammatory T‐cell cytokines by CD43. (a) Concentration of T‐cell cytokines measured using Luminex‐based multiplex assay from the supernatants of T cells activated via CD3 (checkered bars), T6E5‐act (open bars), T10G7‐act (striped bars) and TCD 28‐act (black bars) (no. of experiments = 5, no. of donors = 5). (b) Expression of interferon‐γ (IFN‐γ), interleukin‐4 (IL‐4) and IL‐22 analysed by intracellular cytoplasmic staining in peripheral blood (PB) T cells activated via plate‐bound CD3, CD3/CD43‐6E5, CD3/CD43‐10G7 and CD3/CD28 for 48 hr. Numbers indicate the percentage of positive cells within the gate R2. Gate R2 was set according to the results obtained with unstimulated cells. Gate R1 was set on a live cell population (not shown). Data shown are representative of two independent experiments with two different donors. (c) PB T cells were activated with respective monoclonal antibodies (mAbs) for 30 hr and expression of IFNG,IL4 and IL22 was analysed by real time PCR in T cells activated via CD3 (checkered bars), T6E5‐act (open bars), T10G7‐act (striped bars) and TCD 28‐act (black bars). Values were normalized to CD3E (no. of experiments = 4, no. of donors = 4). (a and c) Data show mean ± SEM (*P < 0·05, **P < 0·01, ***P < 0·001).
Regulation of anti‐inflammatory cytokines by CD43 co‐stimulation
Along with inflammatory cytokines, regulatory cytokines play a crucial role in shaping an effective immune response. Therefore, apart from pro‐inflammatory T‐cell cytokines, the induction of regulatory T‐cell cytokines such as IL‐10 and TGF‐β was also analysed. Production of IL‐10 was strongly induced by CD28 co‐stimulation, whereas T6E5‐act secreted moderate levels of IL‐10 (Fig. 4a). The TGF‐β was similarly regulated by all the three co‐stimulations tested (Fig. 4a). In addition, the expression of IL‐35 subunits, EBI3 and p35 was also analysed. T‐cell co‐stimulation via CD43‐10G7 induced significantly higher expression of EBI3 mRNA compared with T cell co‐stimulation either via CD43‐6E5 or CD28 (Fig. 4b). The higher expression of EBI3 protein in T10G7‐act was further confirmed by intracellular staining (Fig. 4c). The expression of p35 was also slightly up‐regulated in T10G7‐act compared with either T6E5‐act or TCD28‐act (Fig. 4b). The IL‐35 subunit EBI3 can dimerize with p28 to form IL‐27.39 The expression levels of p28 were in fact lower upon co‐stimulation with all three stimuli tested here, compared with stimulation via CD3 alone (Fig. 4b).
Figure 4.
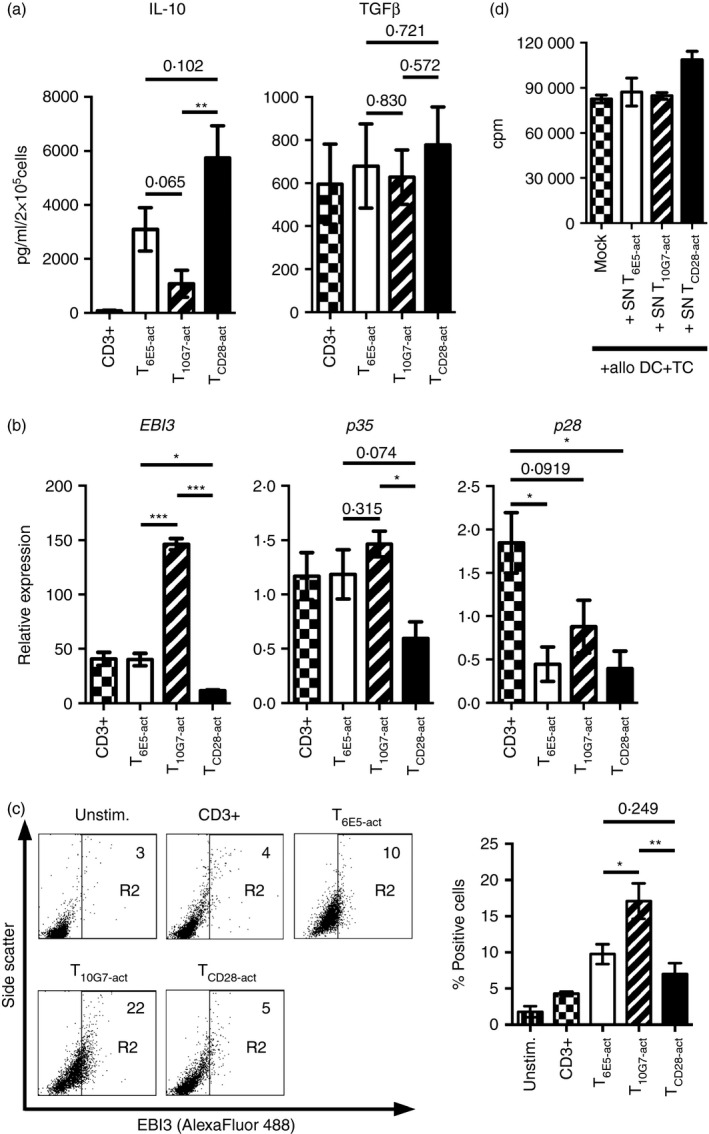
T10G7‐act produce high levels of inhibitory cytokines transforming growth factor‐β (TGF‐β) and interleukin‐35 (IL‐35) subunit, EBI3. (a) Concentration of IL‐10 and TGF‐β from the supernatants of T cells activated via CD3 (checkered bars), T6E5‐act (open bars), T10G7‐act (striped bars) and TCD 28‐act (black bars) analysed by Luminex based multiplex assay (no. of experiments = 5, no. of donors = 5). (b) Expression of EBI3 and p35 and p28 by quantitative PCR in T cells activated by the respective monoclonal antibodies (mAbs) for 30 hr. Values were normalized to CD3E (no. of experiments = 4, no. of donors = 4). (c) Expression of EBI3 analysed by intracellular cytoplasmic staining, in peripheral blood (PB) T cells activated via the respective mAbs for 48 hr. Numbers indicate the percentage of positive cells within the gate R2. Gate R2 was set according to the results obtained with unstimulated cells. Gate R1 was set on live cell population (not shown). Data shown are representative of three independent experiments with three different donors. Bar diagram show percentage of EBI3 positive cells (n = 3). (a–c) Data show mean ± SEM (*P < 0·05, **P < 0·01, ***P < 0·001). (d) Supernatants of T6E5‐act, T10G7‐act and TCD 28‐act collected at day 3, were added to an allogeneic MLR. Data show T‐cell proliferation, measured by [methyl‐3H]thymidine incorporation, induced by DC in the presence or absence (Mock) of indicated cell supernatants. Data shown are representative of four independent experiments with four different donors. Data show mean ± SD.
Interleukin‐35 is regarded as an inhibitory cytokine; therefore supernatants of activated PB T cells were tested for inhibitory effect in an allogeneic MLR. However, we could not observe a soluble factor mediated inhibition of T‐cell proliferation (Fig. 4d).
T‐cell co‐stimulation via CD43‐10G7 induces a hypo‐proliferative state
In the next set of experiments, we analysed the ability of T cells activated in the presence of CD43 co‐stimulatory signals to respond to re‐stimulation. In contrast to T6E5‐act or TCD28‐act that responded efficiently to re‐stimulation, T10G7‐act showed reduced proliferative responses irrespective of whether CD3/CD43‐6E5, CD3/CD43‐10G7 or CD3/CD28 was used as the secondary stimulus (Fig. 5a). As opposed to T6E5‐act and TCD28‐act, the addition of exogenous IL‐2 had no effect on re‐stimulation of T10G7‐act with CD3 alone (Fig. 5a,b). Exogenous IL‐2 could restore the proliferation of T10G7‐act in the presence of a co‐stimulatory signal during re‐stimulation; however, not as effectively as in the case of T6E5‐act and TCD28‐act (Fig. 5b). The reduced proliferative capacity of T10G7‐act seemed not to be due to increased T‐cell death, as indicated by Annexin V and propidium iodide staining (Fig. 5c). Furthermore, the reduced proliferation response was neither due to down‐modulation of co‐receptors during the first round of activation. We analysed the expression of CD43 epitopes recognized by mAbs CD43‐6E5, CD43‐10G7 and of CD28 on T6E5‐act, T10G7‐act and TCD28‐act (Fig. 5d). Though all three mAbs showed slightly reduced binding to T10G7‐act, this did not correlate with the extent of poor proliferative response induced upon re‐stimulation (Fig. 5a,b, d).
Figure 5.
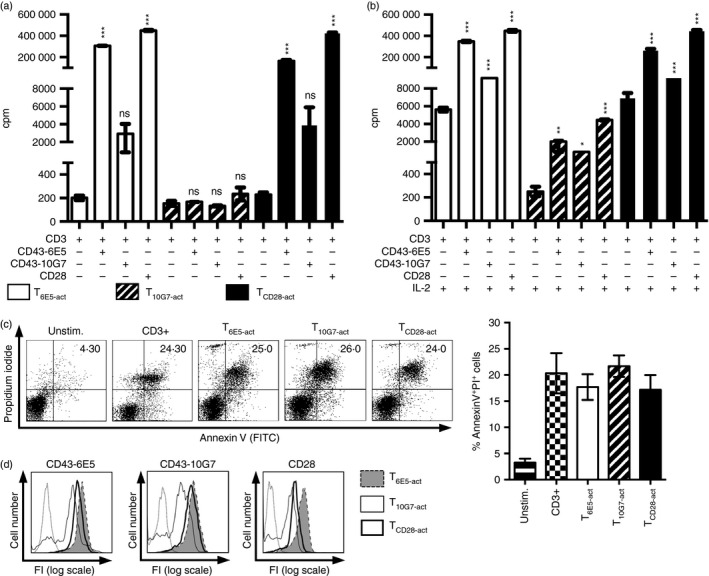
T10G7‐act acquire a hypo‐proliferative state. (a) T6E5‐act (open bars), T10G7‐act (striped bars) and TCD 28‐act (black bars) were re‐stimulated with the indicated co‐stimulus. T‐cell proliferation was measured by analysing [methyl‐3H]thymidine incorporation. (b) As in (a), but with the addition of exogenous interleukin‐2 (IL‐2; 20 U/ml). (a, b) Data show mean ± SD. (*P < 0·05, **P < 0·01, ***P < 0·001) (c) Data show Annexin V (FITC) and propidium iodide staining of unstimulated T cells, T cells activated via CD3, T6E5‐act, T10G7‐act and TCD 28‐act. Gate was set on whole cell population. Quadrant marker was set according to results obtained with unstained cells (not shown). Numbers indicate percentage of positive cells within upper right quadrant. Data shown are representative of five independent experiments with five different donors. Bar diagram show percentage of Annexin V/PI‐positive cells. Data show ± SEM (n = 5). (d) Data show expression of CD43‐6E5, CD43‐10G7 and CD28 on T6E5‐act (grey filled histograms), T10G7‐act (thin open histograms) and on TCD 28‐act (thick open histograms) analysed before re‐stimulation. Reactivity profile of isotype control is also shown (open dotted histograms). Gate was set on live cell population (not shown). (a, b and d) Data shown are representative of two independent experiments with two different donors.
Hence, in contrast to the T‐cell co‐stimulation via the CD43‐6E5‐defined epitope or via CD28, T‐cell co‐stimulation via the CD43‐10G7‐defined epitope induces a deep hypo‐proliferative state in T cells.
T10G7‐act acquire an inhibitory function
So far, T10G7‐act exhibited properties similar to many different subsets of inhibitory T cells, such as lower levels of IFN‐γ, IL‐2, IL‐4 and IL‐22 but up‐regulation of IL‐35 cytokine subunits, EBI3 and p35 and higher production of TGF‐β.40, 41, 42
To further analyse the functional properties of these cells, T‐cell suppression assays were performed. For this, irradiated T6E5‐act, T10G7‐act and TCD28‐act were added to an allogeneic MLR. T10G7‐act inhibited DC‐induced T‐cell proliferation in an MLR in a dose‐dependent manner (Fig. 6a). T10G7‐act were as efficient as regulatory T cells in their suppressive capacity (see Supplementary material, Fig. S4a). Compared with TCD28‐act, high numbers of T6E5‐act seem to exert an inhibitory effect. However, with T10G7‐act such inhibition could be achieved when almost 10 times fewer cells were used (Fig. 6a). Prior fixation of T10G7‐act cells with formaldehyde reversed their inhibitory function (Fig. 6b).
Figure 6.
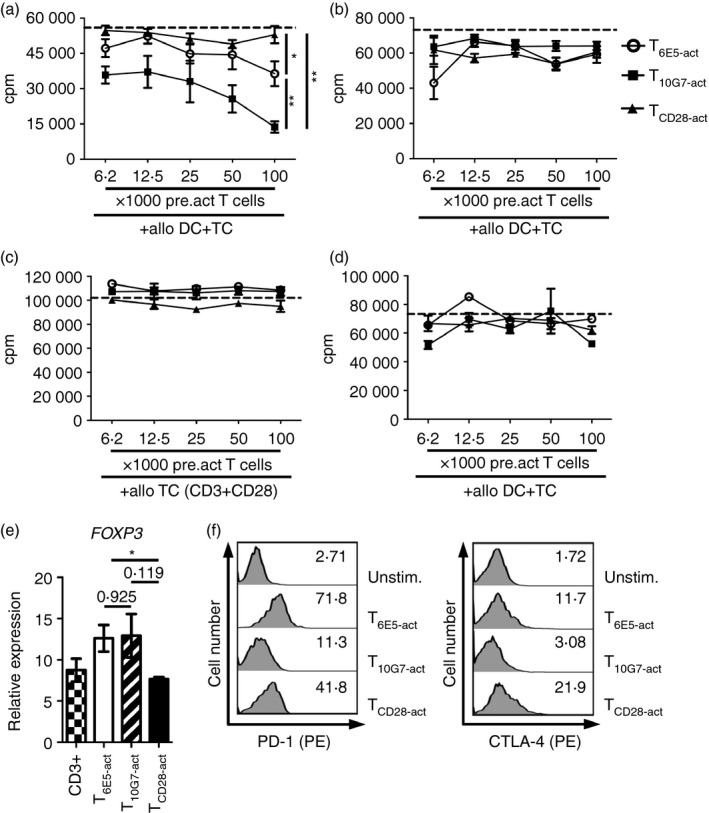
T10G7‐act acquire an inhibitory function. (a) Purified responder T cells (1 × 10⁵ cells) were stimulated with allogeneic dendritic cells (DC) (5 × 10⁴ cells) alone (dashed line) or in the presence of graded number of irradiated T6E5‐act, T10G7‐act or TCD 28‐act. (b) As in (a), but pre‐activated T cells were fixed with 1% formaldehyde, before being added to an allogeneic mixed lymphocyte reaction (MLR). Data are representative of two independent experiments with two different donors. (c) As in (a), but irradiated T cells were added to responder T cells (1 × 10⁵ cells) activated via CD3/CD28 monoclonal antibodies (mAbs). Data are representative of three independent experiments with three different donors. (d) As in (a), but allogeneic DC were also irradiated before being added to an MLR. Data are representative of two independent experiments with two different donors. (b–d) Data show mean ± SD. (e) Expression of FOXP3 by quantitative PCR in peripheral blood (PB) T cells activated for 30 hr via respective immobilized mAbs. Values were normalized to CD3E. (a and e) Data show mean ± SEM (*P < 0·05, **P < 0·01) (no. of experiments = 3, no. of donors = 3). (f) Data show expression of PD‐1 (CD279) and CTLA‐4 (CD152) on unstimulated T cells, T6E5‐act, T10G7‐act and TCD 28‐act analysed by flow cytometry. Numbers indicate percentage of positive cells. Gate was set on live cell population (not shown). Data are representative of two independent experiments with two different donors.
Furthermore, T10G7‐act could not inhibit T‐cell proliferation when added to allogeneic T cells activated via plate‐bound CD3/CD28 mAb in the absence of APC (Fig. 6c). Hence, the data suggest a crucial role of DC in the inhibition of responder T cells. The suppressive effect of T10G7‐act could also be abrogated when DC were irradiated before being added to an allogeneic MLR (Fig. 6d). This inhibitory effect was not restricted to the presence of DC, as T10G7‐act also exhibited an inhibitory effect when monocytes or monocyte‐derived macrophages were used as APC in an allogeneic MLR (data not shown).
FOXP3 is a forkhead family transcription factor important for the development and function of natural regulatory T cells.43 Therefore, expression of FOXP3 was analysed by quantitative PCR as well as by intracellular staining. FOXP3 expression did not differ between different CD43 co‐stimulations, suggesting that the suppressive function of T10G7‐act is not directly related to the expression of FOXP3 (Fig. 6e, and see Supplementary material, Fig. S4b). Activation‐induced transient expression of FOXP3 in T effector cells has been reported before and has not necessarily been associated with suppressive function of T cells in humans.22, 44, 45 Expression of cell surface molecules such as PD‐1 (CD279) and CTLA‐4 (CD152) has been previously linked with regulatory function in T cells.46, 47, 48 However, as analysed by flow cytometry, expression of PD‐1 (CD279) as well as CTLA‐4 (CD152) was in fact lower on T10G7‐act compared with T6E5‐act or TCD28‐act (Fig. 6f).
The inhibitory T10G7‐act cells do not alter the accessory molecule repertoire on DC
The finding that the inhibitory effect of T10G7‐act was observed only in the presence of APC, prompted us to analyse whether a soluble factor secreted by DC co‐cultured with T10G7‐act might be responsible for the inhibitory effect. However, results shown in Fig. 7(a) demonstrate that supernatant from an MLR with pre‐activated PB T cells had no inhibitory effect on the proliferation of responder PB T cells.
Figure 7.
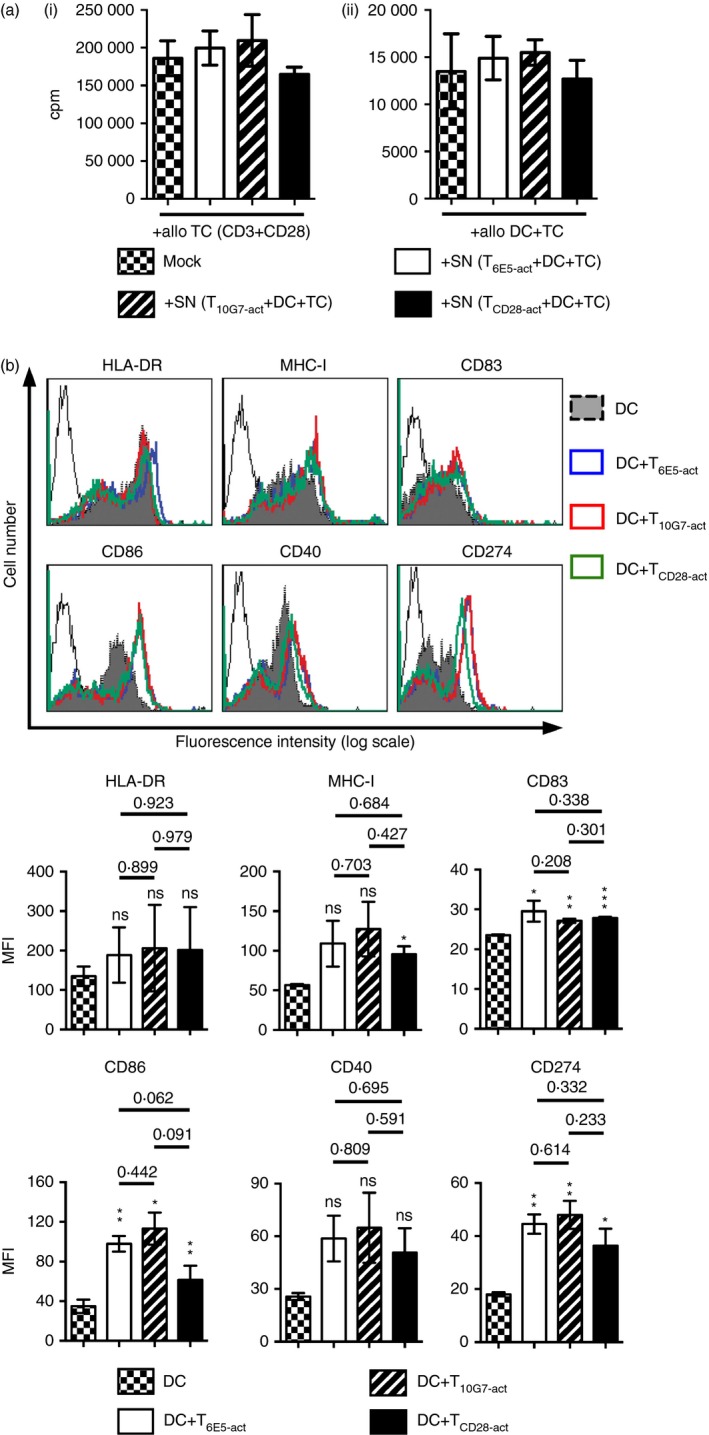
Inhibitory T10G7‐act do not alter accessory molecule repertoire on dendritic cells (DC). (a) Supernatants from an allogeneic mixed lymphocyte reaction (MLR) with irradiated T6E5‐act, T10G7‐act and TCD 28‐act collected at day 5 were added to purified T cells (2 × 10⁵ cells) activated via CD3/CD28 monoclonal antibodies (mAbs) (i) or to an allogeneic MLR (ii). T‐cell proliferation was measured by analysing [methyl‐3H]thymidine incorporation. Data show mean ± SD. Data are representative of three independent experiments with three different donors. (b) Cell surface marker expression on DC (grey filled histograms), DC co‐cultured with T6E5‐act (blue line), T10G7‐act (red line) and TCD 28‐act (green line). DC were co‐cultured with pre‐activated T cells for 48 hr and were analysed by flow cytometry. Overlays show reactivity profile of various mAbs including isotype control (black line). Gate was set on CD1a+ cell population (not shown). Data are representative of three independent experiments with three different donors. Bar diagrams show mean fluorescence intensity (MFI) of indicated cell surface receptors on DC (checkered bars), DC co‐cultured with T6E5‐act (open bars), T10G7‐act (striped bars) and TCD 28‐act (black bars). Data show ± SEM (n = 3) (*P < 0·05, **P < 0·01, ***P < 0·001).
Next, the expression of various cell surface receptors on DC co‐cultured in an allogeneic MLR with T6E5‐act, T10G7‐act or TCD28‐act was analysed. DC co‐cultured with T10G7‐act showed comparable expression of MHC‐I, HLA‐DR to DC co‐cultured with either T6E5‐act or TCD28‐act. The same is true for DC maturation markers such as CD83 or for co‐stimulatory molecules such as CD86 and CD40 (Fig. 7b). Interestingly, the inhibitory receptor B7‐H1 (CD274) was not altered on DC co‐cultured with T10G7‐act (Fig. 7b).
T10G7‐act induce stable heterotypic clustering with DC to constrain activation of responder T cells
Dendritic cells co‐cultured with irradiated T10G7‐act showed characteristic cluster formations, compared with DC co‐cultured with irradiated T6E5‐act or TCD28‐act as shown by the area of each cluster and the number of DC per cluster (Fig. 8a,b). Heterotypic aggregate formation was found to be an active process. Neither irradiated T cells co‐stimulated via plate‐bound CD3/CD43‐10G7 mAbs (see Supplementary material, Fig. S5a), nor irradiated DC co‐cultured with irradiated T10G7‐act (see Supplementary material, Fig. S5b) were able to form aggregates. Likewise, regulatory T cells have been reported to physically hinder the interaction of DC with responder T cells by forming large aggregates.49, 50, 51 Hence, T10G7‐act‐induced stable heterotypic clustering may contribute to the inhibitory effect of T10G7‐act on the accessory function of DC in co‐culture experiments.
Figure 8.
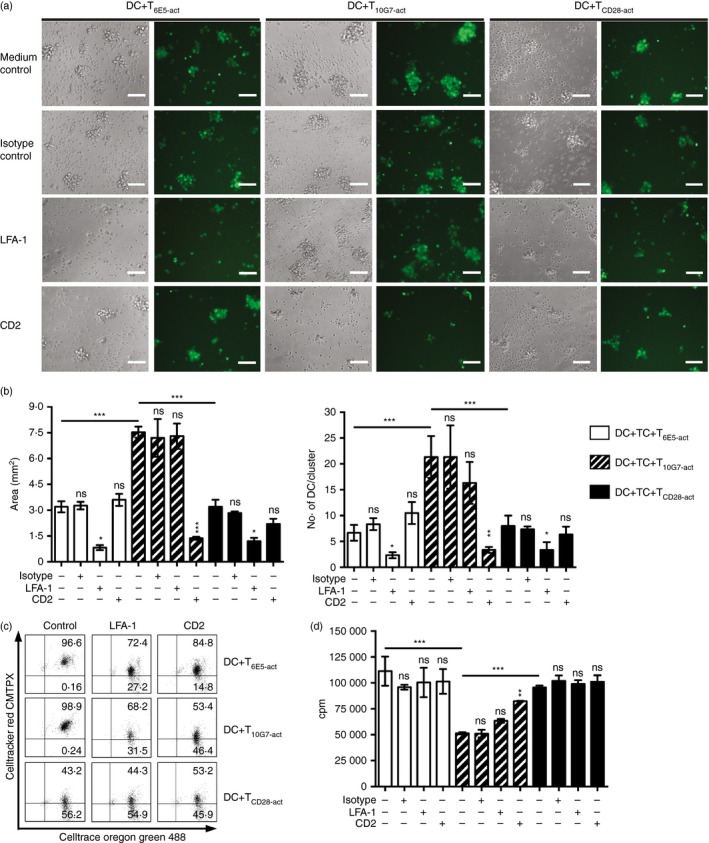
T10G7‐act form stable clusters with dendritic cells (DC), via CD2/CD58. (a) DC labelled with CellTrace™ Oregon Green® 488 co‐cultured with either irradiated (unlabelled) T6E5‐act, T10G7‐act, TCD 28‐act or cells pre‐treated with respective blocking monoclonal antibodies (mAbs) before irradiation. Original magnification: 10 ×; scale bar: 50 μm. Data are representative of three independent experiments with three different donors. (b) Bar diagrams show area of cluster and number of DC per cluster (CellTrace™ Oregon Green® 488‐positive cells). DC were co‐cultured with irradiated T6E5‐act (open bars), T10G7‐act (striped bars) and TCD 28‐act (black bars). Before irradiation, T6E5‐act, T10G7‐act and TCD 28‐act were pre‐treated with the indicated mAbs. (c) Quantitative analysis of DC–T‐cell clustering by flow cytometry. DC were labelled with CellTrace™ Oregon Green® 488; irradiated pre‐activated T cells were labelled with CellTracker™ Red CMTPX. Where indicated, pre‐activated T cells were pre‐treated with respective blocking mAbs. Double‐positive cells were counted as T cells and DC cluster. Numbers indicate percentage of cells within the quadrant. For gating strategy please see Supplementary material, Fig. S6. Data are representative of two independent experiments with two different donors. (d) T6E5‐act (open bars), T10G7‐act (striped bars) or TCD 28‐act (black bars) were pre‐treated with the indicated blocking mAbs, before irradiation and were then added to allogeneic DC and responder T cells. Proliferation of responder T‐cell was measured by analysing [methyl‐3H]thymidine incorporation at day 5. (b, d) Data show mean ± SD. Data are representative of three independent experiments with three different donors (*P < 0·05, **P < 0·01, ***P < 0·001).
As an underlying mechanism, T10G7‐act‐induced heterotypic clustering was found to be mainly CD2 dependent, whereas interaction of T6E5‐act or TCD28‐act with co‐cultured DC was LFA‐1 (CD11a/CD18) dependent (Fig. 8a–c). Heterotypic interaction of TCD28‐act with co‐cultured DC was weaker compared with T6E5‐act and T10G7‐act, as shown by a higher percentage of single‐positive DC in TCD28‐act (56·2%) control treated cells compared with T6E5‐act (0·16%) and T10G7‐act (0·24%) (Fig. 8c).
Further, pre‐treatment of T10G7‐act with a CD2 blocking mAb could abolish the inhibitory effect of T10G7‐act and restore proliferation of responder T cells. The pre‐treatment of T10G7‐act with anti LFA‐1 blocking mAb could slightly restore proliferation compared with isotype control but not as effectively as pre‐treatment with CD2 (Fig. 8d).
Discussion
Signalling via accessory cell surface receptors plays an essential role in the induction, tuning and regulation of T‐cell activation and function.52 A plethora of such co‐stimulatory receptors have been identified, which conventionally provide either positive or negative signals to T cells. CD43 is one of the most abundant cell surface receptors on human T cells. Yet, the functional role of CD43 on T cells is still controversial, with several studies reporting opposing roles of CD43 in T‐cell function.4, 5, 6, 8, 9, 13, 14, 17, 18 Here, we demonstrate that targeting of distinct epitopes on CD43 can decide the subsequent fate of T‐cell function.
This observation was made with two well‐defined CD43 mAbs (6E5, 10G7) directed against two non‐overlapping binding sites, expressed on both isoforms of CD43 (Fig. 1a, and see Supplementary material, Fig. S1a,b,e).19, 20 CD43‐6E5 mAb shares a similar epitope to CD43 mAb MEM‐59.19 Co‐stimulation via MEM‐59 along with TCR signalling could efficiently induce T‐cell activation.6, 53 Previous studies have demonstrated that targeting of CD43 with mAbs CD43‐6E5 and CD43‐10G7 induces aggregation and oxidative burst formation in neutrophils.37 Nonetheless, epitope recognized by mAb CD43‐6E5 but not CD43‐10G7 was found to be involved in T‐cell conjugate formation with APC.16 We observed that both mAbs could potently activate T cells in the presence of TCR signalling, inducing a strong proliferative response in T cells including CB T cells and CD4+ as well as CD8+ T‐cell subsets (Fig. 2a, and see Supplementary material, Fig. S3a–c). T‐cell activation via CD43 was accompanied by the expression of classical T‐cell activation markers such as CD69 and induction of homotypic clustering – a hallmark of T‐cell activation in vitro (Fig. 2b, and see Supplementary material, Fig. S3d,e).
Mattioli et al., have previously suggested that CD28 and CD43 may use different as well as overlapping signalling pathways. As a result, T‐cell co‐stimulation via CD43 may trigger expression of similar as well as different target genes compared with CD28 co‐stimulation, e.g. the expression of the important T‐cell cytokine gene IL2.9 Similarly, we observed that T6E5‐act and T10G7‐act produced low levels of IL‐2 compared with TCD28‐act. Various studies have reported that cytokine production and T‐cell proliferation are autonomously regulated upon T‐cell activation.54, 55 Yet, such low amounts of IL‐2 produced upon co‐stimulation via CD43 could be sufficient to promote T‐cell proliferation (Figs 2a, 3a).56 Compared with TCD28‐act, T6E5‐act produced similarly high levels of IFN‐γ and IL‐22 but only low amounts of IL‐2, IL‐4, IL‐13 and IL‐17. Yet, the CD43 mAbs 6E5 and 10G7 exerted polarizing effects on T cells (Fig. 3). We found that T10G7‐act synthesized low amounts of all analysed cytokines except of the inhibitory cytokines TGF‐β and IL‐35 subunit EBI3 (Figs 3 and 4a–c). Polarizing effects observed upon ligation of our two CD43 mAbs, seem not to be dependent on recognition of specific CD43 isoforms. Downstream of T‐cell co‐stimulation via different CD43 epitopes, CD4+ and CD8+ T cells showed similar functional responses like bulk T cells. Both CD4+ and CD8+ T cells, activated via CD43‐6E5 expressed higher levels of IFNG but lower levels of EBI3 mRNA, compared with their counterparts activated via CD43‐10G7 (see Supplementary material, Fig. S7).
Downstream of co‐stimulation, signal transduction through CD43 has been reported to induce DNA binding activity of NF‐κB, NFAT and AP‐1 transcription factors when CD43 is cross‐linked with mAbs.6, 7, 8 In our test system co‐stimulation via CD43 did not induce activation of AP‐1 of transcription factor (Fig. 2c). T‐cell stimulation via CD43‐6E5 mAb induced activation of NFAT and NF‐κB. However, co‐stimulation via mAb CD43‐10G7 could only induce activation of NFAT (Fig. 2c). Following T‐cell stimulation, activation of NFAT in the absence of NF‐κB and AP‐1 activation leads to anergy.57 This mechanism could explain the hypo‐proliferative phenotype of T10G7‐act as opposed to T6E5‐act seen upon re‐stimulation (Figs 2c, 5a,b). In T cells, this anergic state has also been observed for low‐strength T‐cell activation in the presence of co‐stimulation.58 The mAb CD43‐10G7 showed similar binding affinity and kinetics as CD43‐6E5 (see Supplementary material, Fig. S1c,d). T‐cell co‐stimulation via CD43‐10G7 could efficiently induce T‐cell proliferation similar to co‐stimulation via CD43‐6E5, at levels higher than CD3 alone (Fig. 2a, and see Supplementary material, Fig. S3a–c). Compared with T cells activated via CD3 alone T10G7‐act also showed higher induction of IFN‐γ, IL‐22 and IL‐10, but at levels lower than other co‐stimuli tested (Figs 3 and 4a, and see Supplementary material, Fig. S7). It will be interesting to elucidate in future studies, whether a distinct signalling pathway or a putative low strength of T‐cell activation upon CD43 cross‐linking with CD43‐10G7 compared to CD43‐6E5 is responsible for the observed co‐stimulatory functions of CD43‐10G7 mAb.
Interestingly, T10G7‐act acquired a prominent inhibitory function in contrast to T6E5‐act or TCD28‐act. The suppressive function of T10G7‐act was not mediated via a soluble factor but was dependent on cell–cell contacts. We could also show that T10G7‐act did not directly act on responder T cells. Instead T10G7‐act exhibited their suppressor function via APC such as DC (Fig. 6a,c,d). CD4+ CD25+ FOXP3+ natural regulatory T cells have also been previously reported to route their suppressor function via APC.59 One of the mechanisms includes modulating DC to produce immunosuppressive factors such as indolamine 2,3‐dioxygenase.60, 61 However, in our experiments, the supernatants from DC co‐cultured with T10G7‐act were not inhibitory (Fig. 7a). Another reported mechanism is via CTLA‐4 that results in the suppression of CD80 or CD86 expression.59, 62 We did not observe such reduced expression of CD80 or CD86 on DC co‐cultured with T10G7‐act (Fig. 7b). Indeed, T10G7‐act expressed lower levels of inhibitory receptors including CTLA‐4 (CD152) and PD‐1 (CD279) than T6E5‐act or TCD28‐act (Fig. 6f). The third mechanism of inhibition is by promoting a long stable interaction of regulatory T cells with DC mediated via various molecules including LFA‐1/ICAM‐1, CD2/CD58, neuropillin‐1 and thereby limiting the activation of responder T cells.49, 50, 51, 59 Additionally, a cross‐talk between CD2 and other co‐stimulatory receptors like CD43 and CD28 that facilitates T‐cell conjugate formation and T‐cell activation, respectively, has been reported.16, 63 Indeed, we have also observed a characteristic large aggregate formation when DC were co‐cultured with T10G7‐act that is primarily mediated via CD2. On the other hand, interaction of T6E5‐act with DC was mediated via LFA‐1 (CD11a/CD18) (Fig. 8a–c). Blocking LFA‐1 (CD11a/CD18) on T10G7‐act showed marginal effect on proliferation, whereas blocking CD2 on T10G7‐act abolished the suppressive effect and restored the proliferation of responder T cells (Fig. 8d).
CD43 is a conserved, sialylated glycoprotein with an elongated extracellular domain.2, 3 Multiple ligands have been described for CD43: ICAM‐1 (CD54), MHC‐I, Siglec‐1 (CD169), galectin‐1, E‐selectin and albumin.16, 64, 65, 66, 67, 68 The mAb CD43‐6E5‐defined epitope is involved in mediating the binding of MHC‐I molecules, an event that further strengthens the interaction of APC with T cells.16, 19 For the epitope defined by mAb CD43‐10G7, no potential ligand has been described so far. One candidate for this binding site might be Siglec‐1. We have recently reported that Siglec‐1 on DC contributes to the induction of EBI3 expression and IL‐35 production in co‐cultured T cells.22 In this study we have observed that T10G7‐act have a preferential bias to produce IL‐35, so it is tempting to speculate that Siglec‐1 might be a ligand for the CD43‐10G7‐defined epitope. The ability of the natural ligand to modulate CD43 expression might be an important feature of CD43 function. Depending on the test system and cell type used, cross‐linking of CD43 with mAb or phorbol activation has been reported to induce CD43 internalization or proteolytic cleavage in leucocytes.34, 69, 70 Such activation‐induced proteolytic cleavage of CD43 when observed in T cells, is associated with T‐cell stimulation and homeostasis.69 Hence, results presented in Fig. 1(b) offer a potential mechanism that cross‐linking of CD43‐6E5, in contrast to CD43‐10G7, allows the down‐modulation of CD43 from the cell surface and that in the absence of CD43 processing T cells acquire a regulatory function. However, these possibilities need to be analysed in more detail in future studies.
Taken together, our data suggests a unique role of CD43 in polarization of T‐cell immunity. These findings could provide an explanation for various contradictory roles of CD43 in T‐cell functions that have been previously reported.
Disclosures
The authors declare no financial and commercial conflict of interest.
Supporting information
Figure S1. Reactivity profile of CD43 monoclonal antibodies CD43‐6E5 and CD43‐10G7 on human T cells.
Figure S2. Down‐modulation of CD43 surface expression by CD43‐6E5 requires T‐cell receptor signalling.
Figure S3. CD4+, CD8+ peripheral blood T and cord blood T‐cell stimulation upon engagement of CD43 monoclonal antibodies.
Figure S4. T10G7‐act acquire FOXP3‐independent suppressive function.
Figure S5. Heterotypic interaction of dendritic cells with pre‐activated T cells is an active process.
Figure S6. Gating strategy for flow cytometry analysis of cluster formation between dendritic cells and T cells.
Figure S7. The downstream effect of CD43 co‐stimulation is similar in CD4+ and CD8+ T cells.
Table S1. Real time PCR primer sequences.
Table S2. Cytokine profile of T6E5‐act, T10G7‐act and TCD28‐act.
Acknowledgements
MM designed and performed the experiments, analysed the data and wrote the manuscript. OM, PC, SJ, AP, PS, GJZ, HS and JGG contributed key reagents/materials/analysis tools. JS conceptualized and directed the study and wrote the manuscript. The authors thank Petra Waidhofer‐Söllner, Claus Wenhart and Gerald Timelthaler for their expert technical assistance and Ilija Crncec for critically reading the manuscript. This work was supported by the Austrian Science Fund (FWF) grant DK W1212 and P22869.
References
- 1. Remold‐O'Donnell E, Zimmerman C, Kenney D, Rosen FS. Expression on blood cells of sialophorin, the surface glycoprotein that is defective in Wiskott–Aldrich syndrome. Blood 1987; 70:104–9. [PubMed] [Google Scholar]
- 2. Maemura K, Fukuda M. Poly‐N‐acetyllactosaminyl O‐glycans attached to leukosialin. The presence of sialyl Le(x) structures in O‐glycans. J Biol Chem 1992; 267:24379–86. [PubMed] [Google Scholar]
- 3. Cyster JG, Shotton DM, Williams AF. The dimensions of the T lymphocyte glycoprotein leukosialin and identification of linear protein epitopes that can be modified by glycosylation. EMBO J 1991; 10:893–902. [DOI] [PMC free article] [PubMed] [Google Scholar]
- 4. Cruz‐Munoz ME, Salas‐Vidal E, Salaiza‐Suazo N, Becker I, Pedraza‐Alva G, Rosenstein Y. The CD43 coreceptor molecule recruits the ζ‐chain as part of its signaling pathway. J Immunol 2003; 171:1901–8. [DOI] [PubMed] [Google Scholar]
- 5. Sperling AI, Green JM, Mosley RL, Smith PL, DiPaolo RJ, Klein JR et al CD43 is a murine T cell costimulatory receptor that functions independently of CD28. J Exp Med 1995; 182:139–46. [DOI] [PMC free article] [PubMed] [Google Scholar]
- 6. Santana MA, Pedraza‐Alva G, Olivares‐Zavaleta N, Madrid‐Marina V, Horejsi V, Burakoff SJ et al CD43‐mediated signals induce DNA binding activity of AP‐1, NF‐AT, and NFκB transcription factors in human T lymphocytes. J Biol Chem 2000; 275:31460–8. [DOI] [PubMed] [Google Scholar]
- 7. Wong RC, Remold‐O'Donnell E, Vercelli D, Sancho J, Terhorst C, Rosen F et al Signal transduction via leukocyte antigen CD43 (sialophorin). Feedback regulation by protein kinase C. J Immunol 1990; 144:1455–60. [PubMed] [Google Scholar]
- 8. Pedraza‐Alva G, Merida LB, Burakoff SJ, Rosenstein Y. T cell activation through the CD43 molecule leads to Vav tyrosine phosphorylation and mitogen‐activated protein kinase pathway activation. J Biol Chem 1998; 273:14218–24. [DOI] [PubMed] [Google Scholar]
- 9. Mattioli I, Dittrich‐Breiholz O, Livingstone M, Kracht M, Schmitz ML. Comparative analysis of T‐cell costimulation and CD43 activation reveals novel signaling pathways and target genes. Blood 2004; 104:3302–4. [DOI] [PubMed] [Google Scholar]
- 10. Ramirez‐Pliego O, Escobar‐Zarate DL, Rivera‐Martinez GM, Cervantes‐Badillo MG, Esquivel‐Guadarrama FR, Rosas‐Salgado G et al CD43 signals induce Type One lineage commitment of human CD4+ T cells. BMC Immunol 2007; 8:30. [DOI] [PMC free article] [PubMed] [Google Scholar]
- 11. Zhou HF, Yan H, Cannon JL, Springer LE, Green JM, Pham CT. CD43‐mediated IFN‐γ production by CD8+ T cells promotes abdominal aortic aneurysm in mice. J Immunol 2013; 190:5078–85. [DOI] [PMC free article] [PubMed] [Google Scholar]
- 12. Cannon JL, Collins A, Mody PD, Balachandran D, Henriksen KJ, Smith CE et al CD43 regulates Th2 differentiation and inflammation. J Immunol 2008; 180:7385–93. [DOI] [PMC free article] [PubMed] [Google Scholar]
- 13. Manjunath N, Correa M, Ardman M, Ardman B. Negative regulation of T‐cell adhesion and activation by CD43. Nature 1995; 377:535–8. [DOI] [PubMed] [Google Scholar]
- 14. Thurman EC, Walker J, Jayaraman S, Manjunath N, Ardman B, Green JM. Regulation of in vitro and in vivo T cell activation by CD43. Int Immunol 1998; 10:691–701. [DOI] [PubMed] [Google Scholar]
- 15. Sperling AI, Sedy JR, Manjunath N, Kupfer A, Ardman B, Burkhardt JK. TCR signaling induces selective exclusion of CD43 from the T cell‐antigen‐presenting cell contact site. J Immunol 1998; 161:6459–62. [PubMed] [Google Scholar]
- 16. Stockl J, Majdic O, Kohl P, Pickl WF, Menzel JE, Knapp W. Leukosialin (CD43)‐major histocompatibility class I molecule interactions involved in spontaneous T cell conjugate formation. J Exp Med 1996; 184:1769–79. [DOI] [PMC free article] [PubMed] [Google Scholar]
- 17. Tong J, Allenspach EJ, Takahashi SM, Mody PD, Park C, Burkhardt JK et al CD43 regulation of T cell activation is not through steric inhibition of T cell‐APC interactions but through an intracellular mechanism. J Exp Med 2004; 199:1277–83. [DOI] [PMC free article] [PubMed] [Google Scholar]
- 18. Onami TM, Harrington LE, Williams MA, Galvan M, Larsen CP, Pearson TC et al Dynamic regulation of T cell immunity by CD43. J Immunol 2002; 168:6022–31. [DOI] [PubMed] [Google Scholar]
- 19. de Smet W, Walter H, de Baetselier P. Workshop adhesion structure subpanel 9 (CD43) mAb define at least four different epitopes on human leukosialin In: Schlossmann SF, Boumsell L, Gilks W, Harlan JM, Kishimoto T, Morimoto C, Ritz J, Shaw S, Silverstein R, Springer T, Tedder TF, Todd RF. Leucocyte Typing V: White Cell Differentiation Antigens. Oxford University Press Inc., New York, 1995: 1706–7. [Google Scholar]
- 20. Remold‐O'Donnell E. CD43 Cluster report In: Schlossmann SF, Boumsell L, Gilks W, Harlan JM, Kishimoto T, Morimoto C, Ritz J, Shaw S, Silverstein R, Springer T, Tedder TF, Todd RF. Leucocyte Typing V: White Cell Differentiation Antigens. Oxford University Press Inc., New York, 1995: 1697–701. [Google Scholar]
- 21. Pickl WF, Majdic O, Kohl P, Stockl J, Riedl E, Scheinecker C et al Molecular and functional characteristics of dendritic cells generated from highly purified CD14+ peripheral blood monocytes. J Immunol 1996; 157:3850–9. [PubMed] [Google Scholar]
- 22. Seyerl M, Kirchberger S, Majdic O, Seipelt J, Jindra C, Schrauf C et al Human rhinoviruses induce IL‐35‐producing Treg via induction of B7‐H1 (CD274) and sialoadhesin (CD169) on DC. Eur J Immunol 2010; 40:321–9. [DOI] [PubMed] [Google Scholar]
- 23. Collison LW, Vignali DA. In vitro Treg suppression assays. Methods Mol Biol 2011; 707:21–37. [DOI] [PMC free article] [PubMed] [Google Scholar]
- 24. Mortensen DM, Roge R, Ozbay A, Koefoed‐Nielsen PB, Jorgensen KA. Gene expression analysis of calcineurin isoforms in T‐lymphocytes – a method applied on kidney‐transplant recipients. Transpl Immunol 2010; 23:24–7. [DOI] [PubMed] [Google Scholar]
- 25. Untergasser A, Nijveen H, Rao X, Bisseling T, Geurts R, Leunissen JA. Primer3Plus, an enhanced web interface to Primer3. Nucleic Acids Res 2007; 35:W71–4. [DOI] [PMC free article] [PubMed] [Google Scholar]
- 26. Schindelin J, Arganda‐Carreras I, Frise E Kaynig V, Longair M, Pietzsch T et al Fiji: an open‐source platform for biological‐image analysis. Nat Methods 2012; 9:676–82. [DOI] [PMC free article] [PubMed] [Google Scholar]
- 27. Ratzinger F, Haslacher H, Poeppl W, Hoermann G, Kovarik JJ, Jutz S et al Azithromycin suppresses CD4+ T‐cell activation by direct modulation of mTOR activity. Sci Rep 2014; 4:7438. [DOI] [PMC free article] [PubMed] [Google Scholar]
- 28. Jutz S, Leitner J, Schmetterer K, Doel‐Perez I, Majdic O, Grabmeier‐Pfistershammer K et al Assessment of costimulation and coinhibition in a triple parameter T cell reporter line: simultaneous measurement of NF‐κB, NFAT and AP‐1. J Immunol Methods 2016; 430:10–20. [DOI] [PubMed] [Google Scholar]
- 29. Saitoh O, Piller F, Fox RI, Fukuda M. T‐lymphocytic leukemia expresses complex, branched O‐linked oligosaccharides on a major sialoglycoprotein, leukosialin. Blood 1991; 77:1491–9. [PubMed] [Google Scholar]
- 30. Sportsman JR, Park MM, Cheresh DA, Fukuda M, Elder JH, Fox RI. Characterization of a membrane surface glycoprotein associated with T‐cell activation. J Immunol 1985; 135:158–64. [PubMed] [Google Scholar]
- 31. Jones AT, Federsppiel B, Ellies LG, Williams MJ, Burgener R, Duronio V et al Characterization of the activation‐associated isoform of CD43 on murine T lymphocytes. J Immunol 1994; 153:3426–39. [PubMed] [Google Scholar]
- 32. Popow I, Leitner J, Grabmeier‐Pfistershammer K, Majdic O, Zlabinger GJ, Kundi M et al A comprehensive and quantitative analysis of the major specificities in rabbit antithymocyte globulin preparations. Am J Transplant 2013; 13:3103–13. [DOI] [PubMed] [Google Scholar]
- 33. Galvan M, Tsuboi S, Fukuda M, Baum LG. Expression of a specific glycosyltransferase enzyme regulates T cell death mediated by galectin‐1. J Biol Chem 2000; 275:16730–7. [DOI] [PubMed] [Google Scholar]
- 34. Bazil V, Strominger JL. CD43, the major sialoglycoprotein of human leukocytes, is proteolytically cleaved from the surface of stimulated lymphocytes and granulocytes. Proc Natl Acad Sci U S A 1993; 90:3792–6. [DOI] [PMC free article] [PubMed] [Google Scholar]
- 35. Layseca‐Espinosa E, Pedraza‐Alva G, Montiel JL, del Rio R, Fierro NA, Gonzalez‐Amaro R et al T cell aggregation induced through CD43: intracellular signals and inhibition by the immunomodulatory drug leflunomide. J Leukoc Biol 2003; 74:1083–93. [DOI] [PubMed] [Google Scholar]
- 36. Nong YH, Remold‐O'Donnell E, LeBien TW, Remold HG. A monoclonal antibody to sialophorin (CD43) induces homotypic adhesion and activation of human monocytes. J Exp Med 1989; 170:259–67. [DOI] [PMC free article] [PubMed] [Google Scholar]
- 37. Rosenkranz AR, Majdic O, Stockl J, Pickl W, Stockinger H, Knapp W. Induction of neutrophil homotypic adhesion via sialophorin (CD43), a surface sialoglycoprotein restricted to haemopoietic cells. Immunology 1993; 80:431–8. [PMC free article] [PubMed] [Google Scholar]
- 38. Axelsson B, Youseffi‐Etemad R, Hammarstrom S, Perlmann P. Induction of aggregation and enhancement of proliferation and IL‐2 secretion in human T cells by antibodies to CD43. J Immunol 1988; 141:2912–7. [PubMed] [Google Scholar]
- 39. Pflanz S, Timans JC, Cheung J, Rosales R, Kanzler H, Gilbert J et al IL‐27, a heterodimeric cytokine composed of EBI3 and p28 protein, induces proliferation of naive CD4+ T cells. Immunity 2002; 16:779–90. [DOI] [PubMed] [Google Scholar]
- 40. Collison LW, Workman CJ, Kuo TT, Boyd K, Wang Y, Vignali KM et al The inhibitory cytokine IL‐35 contributes to regulatory T‐cell function. Nature 2007; 450:566–9. [DOI] [PubMed] [Google Scholar]
- 41. Andersson J, Tran DQ, Pesu M, Davidson TS, Ramsey H, O'Shea JJ et al CD4+ FoxP3+ regulatory T cells confer infectious tolerance in a TGF‐β‐dependent manner. J Exp Med 2008; 205:1975–81. [DOI] [PMC free article] [PubMed] [Google Scholar]
- 42. Roncarolo MG, Bacchetta R, Bordignon C, Narula S, Levings MK. Type 1 T regulatory cells. Immunol Rev 2001; 182:68–79. [DOI] [PubMed] [Google Scholar]
- 43. Hori S, Nomura T, Sakaguchi S. Control of regulatory T cell development by the transcription factor Foxp3. Science 2003; 299:1057–61. [DOI] [PubMed] [Google Scholar]
- 44. Roncarolo MG, Gregori S. Is FOXP3 a bona fide marker for human regulatory T cells? Eur J Immunol 2008; 38:925–7. [DOI] [PubMed] [Google Scholar]
- 45. Allan SE, Crome SQ, Crellin NK, Passerini L, Steiner TS, Bacchetta R et al Activation‐induced FOXP3 in human T effector cells does not suppress proliferation or cytokine production. Int Immunol 2007; 19:345–54. [DOI] [PubMed] [Google Scholar]
- 46. Nishimura H, Nose M, Hiai H, Minato N, Honjo T. Development of lupus‐like autoimmune diseases by disruption of the PD‐1 gene encoding an ITIM motif‐carrying immunoreceptor. Immunity 1999; 11:141–51. [DOI] [PubMed] [Google Scholar]
- 47. Keir ME, Butte MJ, Freeman GJ, Sharpe AH. PD‐1 and its ligands in tolerance and immunity. Annu Rev Immunol 2008; 26:677–704. [DOI] [PMC free article] [PubMed] [Google Scholar]
- 48. Read S, Malmstrom V, Powrie F. Cytotoxic T lymphocyte‐associated antigen 4 plays an essential role in the function of CD25+ CD4+ regulatory cells that control intestinal inflammation. J Exp Med 2000; 192:295–302. [DOI] [PMC free article] [PubMed] [Google Scholar]
- 49. Onishi Y, Fehervari Z, Yamaguchi T, Sakaguchi S. Foxp3+ natural regulatory T cells preferentially form aggregates on dendritic cells in vitro and actively inhibit their maturation. Proc Natl Acad Sci U S A 2008; 105:10113–8. [DOI] [PMC free article] [PubMed] [Google Scholar]
- 50. Sakaguchi S, Wing K, Onishi Y, Prieto‐Martin P, Yamaguchi T. Regulatory T cells: how do they suppress immune responses? Int Immunol 2009; 21:1105–11. [DOI] [PubMed] [Google Scholar]
- 51. Herman S, Krenbek D, Klimas M, Bonelli M, Steiner CW, Pietschmann P et al Regulatory T cells form stable and long‐lasting cell cluster with myeloid dendritic cells (DC). Int Immunol 2012; 24:417–26. [DOI] [PubMed] [Google Scholar]
- 52. Leitner J, Grabmeier‐Pfistershammer K, Steinberger P. Receptors and ligands implicated in human T cell costimulatory processes. Immunol Lett 2010; 128:89–97. [DOI] [PubMed] [Google Scholar]
- 53. Alvarado M, Klassen C, Cerny J, Horejsi V, Schmidt RE. MEM‐59 monoclonal antibody detects a CD43 epitope involved in lymphocyte activation. Eur J Immunol 1995; 25:1051–5. [DOI] [PubMed] [Google Scholar]
- 54. Evavold BD, Allen PM. Separation of IL‐4 production from Th cell proliferation by an altered T cell receptor ligand. Science 1991; 252:1308–10. [DOI] [PubMed] [Google Scholar]
- 55. Guy CS, Vignali KM, Temirov J, Bettini ML, Overacre AE, Smeltzer M et al Distinct TCR signaling pathways drive proliferation and cytokine production in T cells. Nat Immunol 2013; 14:262–70. [DOI] [PMC free article] [PubMed] [Google Scholar]
- 56. Sagerstrom CG, Kerr EM, Allison JP, Davis MM. Activation and differentiation requirements of primary T cells in vitro . Proc Natl Acad Sci U S A 1993; 90:8987–91. [DOI] [PMC free article] [PubMed] [Google Scholar]
- 57. Schwartz RH. T cell anergy. Annu Rev Immunol 2003; 21:305–34. [DOI] [PubMed] [Google Scholar]
- 58. Schwartz RH. Models of T cell anergy: is there a common molecular mechanism? J Exp Med 1996; 184:1–8. [DOI] [PMC free article] [PubMed] [Google Scholar]
- 59. Shevach EM. Mechanisms of foxp3+ T regulatory cell‐mediated suppression. Immunity 2009; 30:636–45. [DOI] [PubMed] [Google Scholar]
- 60. Fallarino F, Grohmann U, Hwang KW, Orabona C, Vacca C, Bianchi R et al Modulation of tryptophan catabolism by regulatory T cells. Nat Immunol 2003; 4:1206–12. [DOI] [PubMed] [Google Scholar]
- 61. Vignali DA, Collison LW, Workman CJ. How regulatory T cells work. Nat Rev Immunol 2008; 8:523–32. [DOI] [PMC free article] [PubMed] [Google Scholar]
- 62. Misra N, Bayry J, Lacroix‐Desmazes S, Kazatchkine MD, Kaveri SV. Cutting edge: human CD4+ CD25+ T cells restrain the maturation and antigen‐presenting function of dendritic cells. J Immunol 2004; 172:4676–80. [DOI] [PubMed] [Google Scholar]
- 63. Green JM, Karpitskiy V, Kimzey SL, Shaw AS. Coordinate regulation of T cell activation by CD2 and CD28. J Immunol 2000; 164:3591–5. [DOI] [PubMed] [Google Scholar]
- 64. Rosenstein Y, Park JK, Hahn WC, Rosen FS, Bierer BE, Burakoff SJ. CD43, a molecule defective in Wiskott–Aldrich syndrome, binds ICAM‐1. Nature 1991; 354:233–5. [DOI] [PubMed] [Google Scholar]
- 65. van den Berg TK, Nath D, Ziltener HJ, Vestweber D, Fukuda M, van Die I et al Cutting edge: CD43 functions as a T cell counterreceptor for the macrophage adhesion receptor sialoadhesin (Siglec‐1). J Immunol 2001; 166:3637–40. [DOI] [PubMed] [Google Scholar]
- 66. Hernandez JD, Nguyen JT, He J, Wang W, Ardman B, Green JM et al Galectin‐1 binds different CD43 glycoforms to cluster CD43 and regulate T cell death. J Immunol 2006; 177:5328–36. [DOI] [PubMed] [Google Scholar]
- 67. Matsumoto M, Atarashi K, Umemoto E, Furukawa Y, Shigeta A, Miyasaka M et al CD43 functions as a ligand for E‐Selectin on activated T cells. J Immunol 2005; 175:8042–50. [DOI] [PubMed] [Google Scholar]
- 68. Nathan C, Xie QW, Halbwachs‐Mecarelli L, Jin WW. Albumin inhibits neutrophil spreading and hydrogen peroxide release by blocking the shedding of CD43 (sialophorin, leukosialin). J Cell Biol 1993; 122:243–56. [DOI] [PMC free article] [PubMed] [Google Scholar]
- 69. Seo W, Ziltener HJ. CD43 processing and nuclear translocation of CD43 cytoplasmic tail are required for cell homeostasis. Blood 2009; 114:3567–77. [DOI] [PubMed] [Google Scholar]
- 70. Fanales‐Belasio E, Zambruno G, Cavani A, Girolomoni G. Antibodies against sialophorin (CD43) enhance the capacity of dendritic cells to cluster and activate T lymphocytes. J Immunol 1997; 159:2203–11. [PubMed] [Google Scholar]
Associated Data
This section collects any data citations, data availability statements, or supplementary materials included in this article.
Supplementary Materials
Figure S1. Reactivity profile of CD43 monoclonal antibodies CD43‐6E5 and CD43‐10G7 on human T cells.
Figure S2. Down‐modulation of CD43 surface expression by CD43‐6E5 requires T‐cell receptor signalling.
Figure S3. CD4+, CD8+ peripheral blood T and cord blood T‐cell stimulation upon engagement of CD43 monoclonal antibodies.
Figure S4. T10G7‐act acquire FOXP3‐independent suppressive function.
Figure S5. Heterotypic interaction of dendritic cells with pre‐activated T cells is an active process.
Figure S6. Gating strategy for flow cytometry analysis of cluster formation between dendritic cells and T cells.
Figure S7. The downstream effect of CD43 co‐stimulation is similar in CD4+ and CD8+ T cells.
Table S1. Real time PCR primer sequences.
Table S2. Cytokine profile of T6E5‐act, T10G7‐act and TCD28‐act.