Abstract
Analysis of individual cells at the subcellular level is important for understanding diseases and accelerating drug discovery. Nanoscale endoscopes allow minimally invasive probing of individual cell interiors. Several such instruments have been presented previously, but they are either too complex to fabricate or require sophisticated external detectors because of low signal collection efficiency. Here we present a nanoendoscope that can locally excite fluorescence in labelled cell organelles and collect the emitted signal for spectral analysis. Finite Difference Time Domain (FDTD) simulations have shown that with an optimized nanoendoscope taper profile, the light emission and collection was localized within ~100 nm. This allows signal detection to be used for nano-photonic sensing of the proximity of fluorophores. Upon insertion into the individual organelles of living cells, the nanoendoscope was fabricated and resultant fluorescent signals collected. This included the signal collection from the nucleus of Acridine orange labelled human fibroblast cells, the nucleus of Hoechst stained live liver cells and the mitochondria of MitoTracker Red labelled MDA-MB-231 cells. The endoscope was also inserted into a live organism, the yellow fluorescent protein producing nematode Caenorhabditis elegans, and a fluorescent signal was collected. To our knowledge this is the first demonstration of in vivo, local fluorescence signal collection on the sub-organelle level.
Nano-scale instruments that allow sensing at the cellular and subcellular level1,2,3 are crucial for gaining a fundamental understanding of the molecular dynamics inside the single cell. It is likely this information will help elucidate the pathophysiology of many diseases such as cancer and Alzheimer’s4,5,6,7 and facilitate the design of new therapies1,8,9. Various single cell devices have been reported including carbon nanotubes on Atomic-force microscope (AFM) tips10,11; glass pipettes5,12; capillaries13; boron nitride nanotubes affixed onto tungsten wires14; sharpened macroscopic needles15; Ag nanowires on electrochemically etched Tungsten tip16; Focused ion beam (FIB)-milled AFM tips17; optical fibre-nanowire-based endoscopes18,19; optical fibre-photonic crystal based endoscope20; as well as, nanofibres nanofibres6,9,21,22,23,24,25,26,27,28. These devices can perform the intracellular sensing of enzymes6,21, pH22, calcium ions9,23, carcinogens26, biomarkers24,25,27, and quantum dots18 using fluorescence. Intracellular proteins can be investigated using photoluminescence20 or localized surface plasmon resonance28. In-situ electrochemical measurements12,14 or Surface-enhanced Raman spectroscopy (SERS) measurements for sensing biomolecules in single cell organelle12,13,29 can also be conducted. Apart from sensing, these devices may also be used to perform the payload delivery of quantum dots10,15,18, DNA17, and other materials12. Widespread application of these devices has been limited due to fabrication issues and their need for manual assembly18,20, and they usually require sophisticated external detectors for sensing30.
This method creates the nanoscale-endoscope that is easily fabricated in large quantities, is minimally invasive, allows for single cell manipulation, and has the capability to simultaneously transmit and receive optical signals from intracellular organelle without the use of external detectors. This technology permits the efficient and cost effective in vitro and in vivo, single cell organelle analysis. The experiment involved FDTD simulations of light emerging from a tapered nanoendoscope tip and simulations of the back coupling of light into the nanoendoscope taper. Multiple nanoendoscopes were fabricated and characterized using scanning electron microscopy. The Experimental validation of forward and back coupling of light into the endoscope was obtained by collecting optical signals from fluorescently labelled intracellular organelle of fibroblast, liver cell line and MDA-MB-231cancer cells. These experiments demonstrated that fluorescent light can be coupled back through an endoscope and the localized spectra from the cell interior can be acquired. This advancement allowed for the intracellular fluorescent spectrum to be collected in-vivo from live Caenorhabditis elegans worms.
Results and Discussion
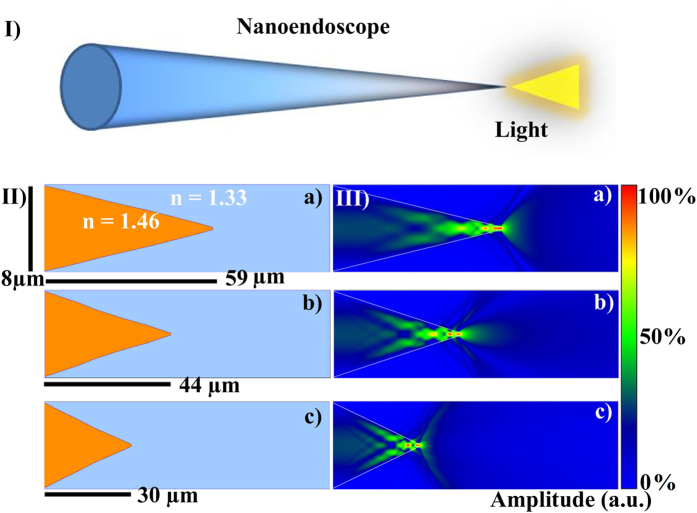
Figure 1(I) shows the schematic of the nanoendoscope that can guide light and can be inserted safely into single cells for detailed spectrum analysis, both in-vitro and in-vivo. Figure 1(II,III) shows FDTD simulations of light transmission profiles, with tapers consisting of an 8 μm base narrowing to a 200 nm tip over taper lengths ranging from 30 μm to 59 μm. It is observed that the shape of the output beam is a function of the taper length. At a taper length of 30 μm, the transmission of light was very local and close to the apex. For the taper lengths of 44 μm and 59 μm, the mode propagating in the optical fibre was shown to be continuously squeezed along the taper of the nanoendoscope, before fanning out at the apex. For the 44 μm taper length, the transmission is focused over a distance of several micrometers from the apex; comparatively, the 59 μm taper length emits an unfocused beam that spreads widely at a very short distance from the apex. The range of light transmission geometries allows for different tapered profile tips to be used for different application. For example, a taper length of 30 μm can be utilized for an experiment that requires near field excitation, while taper lengths of 44 μm or 59 μm can be used for local fluorescent spectra collection inside single cells.
Figure 1. Light coupling into nanoscale endoscope.
(I) Schematic of a nanoendoscope showing light shining out of the tip. (II,III) FDTD simulations of light coupling into nanoendoscopes tapered from 8 μm to 200 nm over different lengths (a) 59 μm (b) 44 μm and (c) 30 μm.
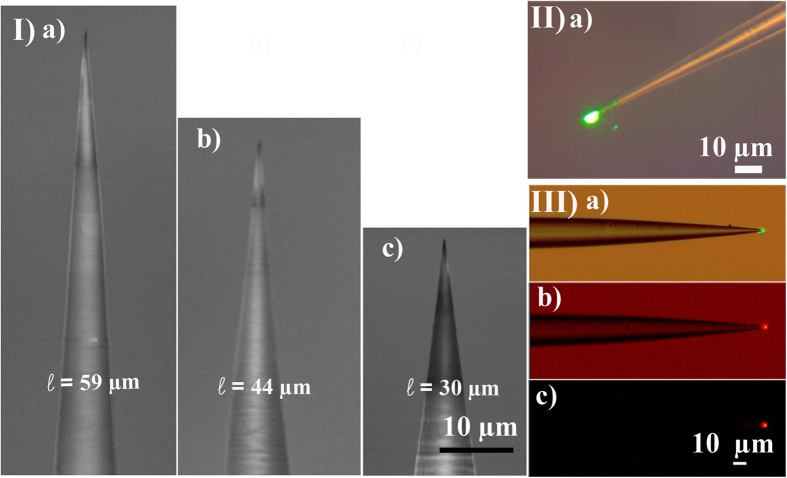
Using conventional (HF) wet etching technique31,32, nanoendoscope tips of the three lengths corresponding to the simulations, 30 μm, 44 μm and 59 μm were fabricated. This process was shown to be reproducible by using scanning electron microscopy to characterize the results of the wet etch processing. Figure 2I shows nanoendoscope tips of different taper lengths, ranging from 30 μm to 59 μm with a nanoscale apex diameter close to 200 nm. The fabricated nanoendoscopes were fusion spliced to the cleaved end of an optical fibre and inserted to an Eppendorf micro manipulator for nm resolution control of nanoendoscope movement during experiments. Figure 2II shows optical microscopy images of 532 nm light shining out of the nanoendoscope tip. The shape of the beam was very similar to the simulated shown in Fig. 1III(b) and the light propagates over a distance of several micrometers in agreement with the simulations. Figure 2III shows the excitation of a fluorescent dye when the nanoendoscope forward coupled with 532 nm light was dipped into the dye solution. It can be observed that the nanoendoscope is able to locally excite fluorescence in the solution.
Figure 2. Nano endoscope characterization.
Part I shows scanning electron microscope images of the single cell endoscope tips fabricated with different tapered lengths (a) 59 μm (b) 44 μm and (c) 30 μm. Part II) (a) experimental demonstration of 532 nm light coupling into the endoscope under microscope for 44 μm tapered length fibre. Part III is excitation of fluorescent dye on the endoscope tip using 532 nm light, (a) is green light coupling to the endoscope, (b) is excitation of dye observed using red filter with ambient light turned on and (c) is excitation of dye observed using red filter with ambient light turned off.
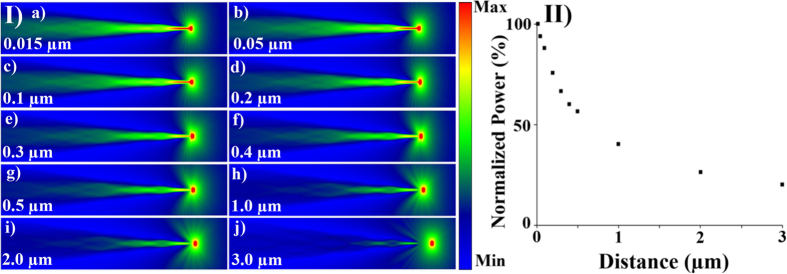
Figure 3I(a–j) shows the back coupling of light into a nanoendoscope with the taper length 44 μm from a point source located at different distances from the apex of the tip. It is observed that the coupling efficiency quickly decreases when the point source is moved from 0.015 μm to 3.0 μm away from the apex of the nanoendoscope tip. This information can be applied to a case when an external light source is used for the excitation of a fluorescent sample and a nanoendoscope is used to collect the intensity of the fluorescent signal. The relative intensity decreases from 100% at distance 0.015 μm from the apex to 40% over a distance of 1 μm, Fig. 3II. In order to simulate the simultaneous forward and back coupling of light and to optimize the geometric position of the fluorescent source with respect to the endoscope tip for effective back coupling, further analysis was conducted.
Figure 3. Nanoendoscope tip light collection characterization.
Part I (a) shows FDTD 2D single cell endoscope tip tapering from an 8 μm diameter base to 200 nanometers at the apex of the tip over a distance of 44 μm with a point light source places at different distances from the tip from 0.015 μm to 3.0 μm. (II) Is the plot of normalized power (%) with respect to 0.015 μm distance from the point source to the apex of optical fibre.
Figure 4 shows 3D plots of the relative power intensities for (a) forward (b) back and (c) the cross product of the forward and backward coupling. The Z axis is parallel to the endoscope. The X axis is perpendicular to the direction of light propagation. Intensity of light transmitted in the endoscope is shown in Fig. 4(a). Efficiency of coupling from different points (X, Z) into the endoscope tip is shown in Fig. 4(b). The third coordinate in the images represents light intensity. It can be observed that light coupled into endoscope illuminates microscale area. Light intensity drops to 30% 2 μm away from the tip. In Fig. 4(b) back-coupling efficiency is also local, and only 20% of the signal can be detected 3 μm away from the tip. In order to simulate simultaneous forward and back coupling of light, the product of forward and backward intensities is calculated and shown in Fig. 4(c). The total collection efficiency drops to 45% after moving by just 300 nm away from the tip. This demonstrates that when nanoendoscope is used for light delivery, the collection by the same nanoendoscope tip is very local and works efficiently only within 100’s of nanometers. Thus detection of fluorescent signal combined with simultaneous delivery can be used for nanophotonic sensing of XYZ position of the fluorophore. The local signal detection in proximity to fluorescent dye was demonstrated using simultaneous light delivery and collection in Supplementary Information. Next in vitro and in vivo light collection experiments were conducted.
Figure 4. Theoretical optimization of light delivery and collection by the nanoscale endoscope tip.
(a) Forward coupling of light (b) Back coupling of light (c) is a product of forward and back coupling intensities.
First, three types of cell viability experiments were conducted and reported in the Supplementary Information demonstrating that the device can safely penetrate single cells without short term or long term damage. Following this, spectrum collection from a number of commercially available florescent dyes using external excitation and simultaneous excitation and emission were conducted to demonstrate broad spectral range that can be used.
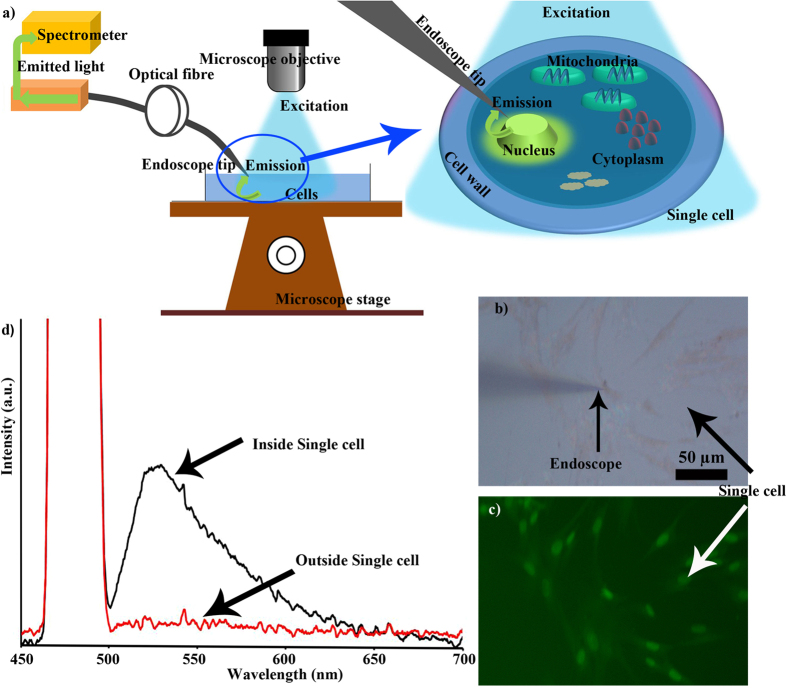
Figure 5 summarizes the fluorescence spectra obtained from the excitation of a single fibroblast human lung cell stained with Acridine Orange. Figure 5(a) shows the schematics of the experiment. The nanoendoscope was inserted into the cell using a high precision 40 nm step resolution micromanipulator that was controlled using custom made software. The cell nuclei were labelled with Acridine Orange which has an absorption peak at 490 nm and a fluorescence emission peak at around 525 nm. The cells were excited with blue light generated by passing the microscope broadband illumination light via fluorescent filter. As the cell emitted the fluorescence signal from its interior, the endoscope at a close proximity to the organelle (Fig. 5(b,c)) collected the spectrum. Figure 5(d) shows the emission peak (black) at 525 nm for Acridine orange in a single cell. While outside of the cell (red curve), no signal at 525 nm was detected. Here we have demonstrated the nanoendoscopes ability to collect the spectrum from sub-cellular organelle.
Figure 5. In vitro spectrum collection using nanoendoscope.
(a) Schematics of the experiment where internal microscope light source was used for fluorescence excitation. (b) A bright field image of the nanoendoscope inserted into a fibroblast single cell and (c) the corresponding fluorescence image. (d) The black curve is the spectrum (peak ~525 nm) from a single cell collected using nanoendoscope, while red curve is the spectrum taken outside the cell. The Y axis shows intensity (linear scale).
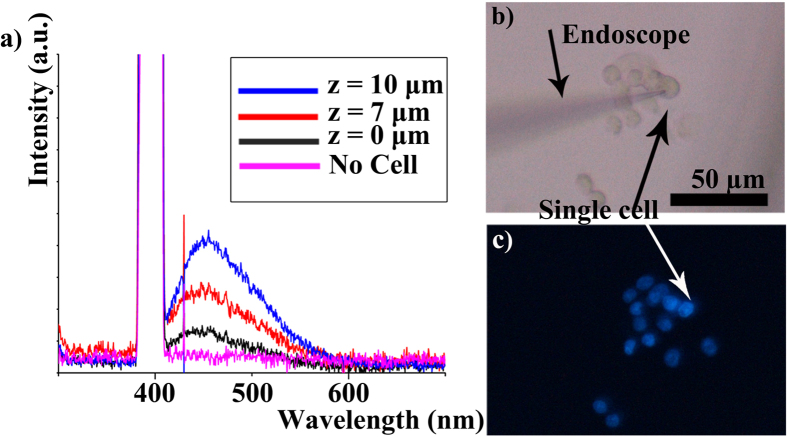
Next, live liver cells were stained with Hoechst (see details in Supplementary Information) and probed with a nanoendoscope (Fig. 6). Spectra were taken as the nanoendoscope was inserted into the nucleus of the cells (Fig. 6(a,b)). It can be observed in Fig. 6(a) that the fluorescence intensity increased as nanoenscope goes deeper into the interiors of the cell. “No cell” indicates background signal, z = 0 μm is when endoscope initially penetrates the cell surface, and z = 7 and 10 μm are signals obtained when nanoendoscope goes deeper into the cell by these distances. This difference cannot be perceived using conventional optical microscopy as seen in Fig. 6(c). The change in spectra closely resembles that observed in FDTD simulations. Spectral information with respect to the location of the nanoendoscope can be used for high resolution imaging or to locate intracellular organelle.
Figure 6. In vitro spectrum collection using nanoendoscope.
(a) Spectrum collected from Hoechst stained cells at different heights in the cell. (b) A bright field image of the nanoendoscope inserted into a Live liver cell (c) the corresponding fluorescent image.
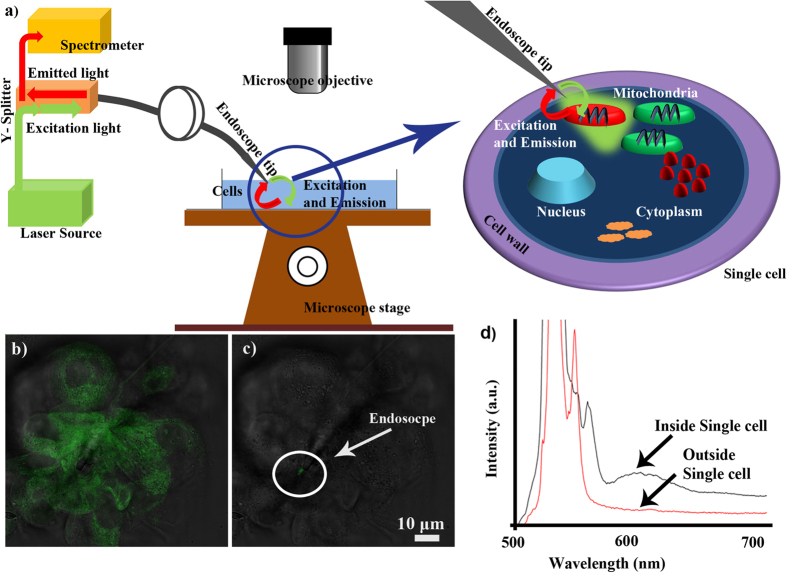
Next, an experiment for the simultaneous delivery and collection of optical signals via the single cell nanoendoscope was conducted on live MDA-MB-231 cells that were stained with mito tracker (Fig. 7(a)). The staining procedure is provided in the Supplementary Information. The expected value for excitation and emission were approximately 525 nm and 600 nm respectively. The excitation source, a 532 nm green laser, was coupled into the endoscope via a Y splitter. Figure 7(b) shows fluorescent image of the whole cell exposed to wide field excitation. Figure 7(c) demonstrates local excitation of fluorescence using nanoscale endoscope delivering light into the cell. The fluorescence emitted near the nanoendoscope tip was coupled back and analyzed using spectrometer (Fig. 7(d), black curve).
Figure 7.
Fluorescent spectrum collected using configuration shown in (a) from a Mito tracker stained MDA-MB-231 cell. (b) Fluorescent image observed under microscope when entire field of view was illuminated by excitation light, and (c) fluorescent image when local fluorescence was excited with the nanoendoscope. (d) Spectra from inside a Mito-tracker-labeled cell (peak ~600 nm) and outside the cell.
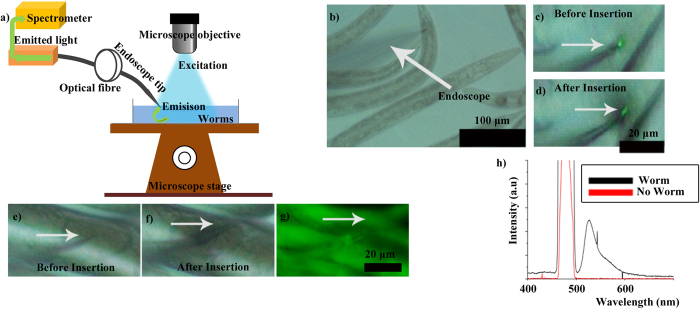
Next, in vivo experiments were conducted using C. elegans strain AM140, which harbors an integrated multi-copy neurodegeneration model transgene integrated into the genome33. The sample preparation is provided in the Supplementary Information. The worms fluoresce upon excitation with blue light and emit green signal at ~525 nm. The nanoendoscope was inserted into the worms as shown in Fig. 8(a–f). Yellow fluorescent protein (YFP) in the worms was excited using an external microscope light (Fig. 8(g)) and a spectrum was collected using the nanoendoscope. The spectrum from the in vivo experiment shows a peak (black curve) at 525 nm (Fig. 8(h)).
Figure 8. In-vivo fluorescent signal collection from a live C. elegans nematodes (AM140).
(a) The schematics of the experiment. (c–f) Optical microscopy images showing nanoendoscope during insertion into the worm body (c,d) and an egg (e,f). (g) Fluorescence of the worm observed under a microscope with corresponding spectrum (black curve) collected via nanoendoscope (h), where “no worm” (red) indicates the background signal without worm.
Conclusion
A single cell endoscope that can simultaneously deliver and collect light on the sub-cellular level was fabricated. FDTD simulations of simultaneous light delivery and collection showed that the performance of endoscope depended on the location of the tip with respect to the fluorescent sample. Following the simulations, the endoscope was shown experimentally to collect the spectrum from intracellular organelle in two configurations, using an external light source and light source propagating from the endoscope itself. We were also able to insert nanoendoscope and measure fluorescence in a live multicellular organism. To our knowledge, this is the first time a nanoendoscope has been used to collect in-vivo fluorescence spectrum. This technology is an important step towards the realization of in vivo analysis that eliminates the requirement of a microscope objective for signal collection.
Methods
The nanoendoscope taper profile optimization was conducted using FDTD simulations in commercially available software OPTI-FDTD. A silicon dioxide fibre with a refractive index of 1.46 was modeled to have taper with a diameter ranging from 8 μm base to 200 nm tip over a taper length of 30 μm, 44 μm and 59 μm (Fig. 1). Green light, with a wavelength of 532 nm, was coupled into each respective structure and subsequently the shape of the outcome beam was analyzed.
Next, back coupling simulations were conducted by placing a point source of light near the tip of the nanoendoscope and relocating the source in a 2D array of points to investigate efficiency of coupling at the different geometric locations. This was used to approximate the mechanisms and properties used when collecting fluorescence from a sample excited by an external light source. Further analysis was then conducted to investigate the efficiency of the back coupling of light if measured while forward coupled light was simultaneously propagating through the endoscope.
Following this, single cell nanoendoscopes of three different taper lengths 30 μm, 44 μm and 59 μm were fabricated from cleaved single mode silicon dioxide 125/8 μm fibres using HF wet etching31,32. The resultant tapered fibre tips were characterized using a HITACHI SU-70 scanning electron microscope (SEM) and then spliced to a regular single mode fibres using an IFS 10 Arc fusion splicer to provide an optical connection with minimal loss. Several nanoendoscope viability tests have been conducted on single cells and reported in Supplementary Information.
After these simulations, experiments that measured the light collected from sub cellular organelle via the single cell nanoendoscope were conducted using two experimental setups. In the first setup, a human lung fibroblast cell was stained with Acridine orange and excited using an external light source generated by a built-in Nikon, blue excitation, fluorescent filter. The fluorescent emission signal was then collected using the nanoendoscope which had been inserted into nucleus of the cell. Similarly, signal was collected from Hoechst stained Liver cells. In the second setup, the nanoendoscope was inserted into an MDA-MB-231 cell that was stained with MitoTracker Red. The fluorescence in the cell was excited using green light (532 nm) forward coupled into the nanoendoscope. Simultaneously, the back coupled fluorescent emission signal was collected and measured using the same nanoendoscope. Following this, in-vivo experiments were conducted using C. elegans worms. Neurodegeneration model animals that stably express polyglutamine residues fused to Yellow Fluorescent Protein (YFP) in the body wall muscle (strain AM140, genotype rmIs132 unc-54p::Q35::YFP)33, were anesthetized with 10 mM Levamisole, mounted on 2% agarose pads, and then probed with the nanoendoscope. The emitted spectrum was then collected by the nanoendoscope.
Additional Information
How to cite this article: Cheemalapati, S. V. et al. Subcellular and in-vivo Nano-Endoscopy. Sci. Rep. 6, 34400; doi: 10.1038/srep34400 (2016).
Supplementary Material
Acknowledgments
This work has been partially conducted using facilities of the Florida Center of Excellence for Drug Discovery and Innovation at the University of South Florida and USF Nanotechnology Research and Education Center. We thank Moffitt Cancer Research Center for the access to confocal microscopy. C. elegans strain AM140 was provided by the Caenorhabditis Genetics Center (CGC), which is funded by National Institutes of Health (NIH) Office of Research Infrastructure Programs (P40 OD010440). S.V.C. was supported by the USF Signature Research Doctoral Fellowship. A.Z. was supported by USF Presidential Fellowship. A.P. was supported by USF New Researcher Grant. A.R., S.R.A. and R.H.Y.J. sincerely thank John H Adams and Amy Conway for providing some experimental materials. We thank NIH funding #R01AI117017 and #R35CA197731 as well as USF New Investigator Funding to R.H.Y.J.
Footnotes
Author Contributions A.P. conceived the idea of the research and supervised the entire project. S.V.C. and J.W. optimized the fabrication procedure and fabricated the devices. K.K. programmed the micromanipulator. S.V.C. and A.Z. conducted the endoscope-fluorescent dye experiments. S.V.C. conducted the experiments on in-vitro and in-vivo spectroscopy. H.W. cultured and stained fibroblast cells. A.D. cultured the worms under supervision of S.D.W. and T.D. cultured and stained the MDA-MD-231 cells under supervision of R.G., A.R. and M.N. cultured and stained the liver cells under supervision of J.H., S.V.C., H.W. and S.R.A. conducted second liver cell viability experiment. S.V.C. and S.R.A. conducted third liver cell viability experiments. S.V.C. and H.W. conducted fibroblast cells viability experiment. S.V.C. analyzed all the data and prepared the figures. All coauthors participated in writing the manuscript.
References
- Zheng X. T. & Li C. M. Single cell analysis at the nanoscale. Chem Soc Rev 41, 2061–2071 (2012). [DOI] [PubMed] [Google Scholar]
- Obataya I. et al. Nanoscale operation of a living cell using an atomic force microscope with a nanoneedle. Nano Lett 5, 27–30 (2005). [DOI] [PubMed] [Google Scholar]
- Vo-Dinh T. Nanobiosensors: Probing the sanctuary of individual living cells. J Cell Biochem 154–161 (2002). [DOI] [PubMed] [Google Scholar]
- Walling M. A. & Shepard J. R. E. Cellular heterogeneity and live cell arrays. Chem Soc Rev 40, 4049–4076 (2011). [DOI] [PubMed] [Google Scholar]
- Orynbayeva Z. et al. Physiological validation of cell health upon probing with carbon nanotube endoscope and its benefit for single-cell interrogation. Nanomed-Nanotechnol 8, 590–598 (2012). [DOI] [PubMed] [Google Scholar]
- Zheng X. T., Yang H. B. & Li C. M. Optical Detection of Single Cell Lactate Release for Cancer Metabolic Analysis. Anal Chem 82, 5082–5087 (2010). [DOI] [PubMed] [Google Scholar]
- Gao Y. et al. One-dimensional nanoprobes for single-cell studies. Nanomedicine-Uk 9, 153–168 (2014). [DOI] [PubMed] [Google Scholar]
- Evanko D. Watching single molecules in cells. Nat Methods 5, 25–25 (2008). [Google Scholar]
- Wang S. et al. Detection of [Ca2+] I Changes In Sub-Plasma Membrane Micro Domains in A Single Living Cell By an Optical Fiber-Based Nanobiosensor. Austin Journal of Nanomedicine and Nanotechnology 2, 1022 (2014). [Google Scholar]
- Chen X., Kis A., Zettl A. & Bertozzi C. R. A cell nanoinjector based on carbon nanotubes. Proceedings of the National Academy of Sciences 104, 8218–8222 (2007). [DOI] [PMC free article] [PubMed] [Google Scholar]
- Menard-Moyon C., Kostarelos K., Prato M. & Bianco A. Functionalized Carbon Nanotubes for Probing and Modulating Molecular Functions. Chemistry & Biology 17, 107–115 (2010). [DOI] [PubMed] [Google Scholar]
- Singhal R. et al. Multifunctional carbon-nanotube cellular endoscopes. Nat Nanotechnol 6, 57–64 (2011). [DOI] [PubMed] [Google Scholar]
- Niu J. J., Schrlau M. G., Friedman G. & Gogotsi Y. Carbon Nanotube-Tipped Endoscope for In Situ Intracellular Surface-Enhanced Raman Spectroscopy. Small 7, 540–545 (2011). [DOI] [PubMed] [Google Scholar]
- Yum K. S., Cho H. N., Hu H. & Yu M. F. Individual nanotube-based needle nanoprobes for electrochemical studies in picoliter microenvironments. Acs Nano 1, 440–448 (2007). [DOI] [PubMed] [Google Scholar]
- Yum K. et al. Mechanochemical Delivery and Dynamic Tracking of Fluorescent Quantum Dots in the Cytoplasm and Nucleus of Living Cells. Nano Lett 9, 2193–2198 (2009). [DOI] [PMC free article] [PubMed] [Google Scholar]
- Lu G. et al. Live-Cell SERS Endoscopy Using Plasmonic Nanowire Waveguides. Adv Mater 26, 5124–5128 (2014). [DOI] [PubMed] [Google Scholar]
- Han S. W. et al. A molecular delivery system by using AFM and nanoneedle. Biosens Bioelectron 20, 2120–2125 (2005). [DOI] [PubMed] [Google Scholar]
- Yan R. X. et al. Nanowire-based single-cell endoscopy. Nat Nanotechnol 7, 191–196 (2012). [DOI] [PubMed] [Google Scholar]
- Ladanov M., Cheemalapati S. & Pyayt A. Optimization of light delivery by a nanowire-based single cell optical endoscope. Opt Express 21, 28001–28009 (2013). [DOI] [PubMed] [Google Scholar]
- Shambat G. et al. Single-Cell Photonic Nanocavity Probes. Nano Lett (2013). [DOI] [PMC free article] [PubMed] [Google Scholar]
- Kasili P. M., Song J. M. & Vo-Dinh T. Optical sensor for the detection of caspase-9 activity in a single cell. J Am Chem Soc 126, 2799–2806 (2004). [DOI] [PubMed] [Google Scholar]
- Tan W. H. et al. Submicrometer Intracellular Chemical Optical Fiber Sensors. Science 258, 778–781 (1992). [DOI] [PubMed] [Google Scholar]
- Wang S. et al. Silver-coated near field optical scanning microscope probes fabricated by silver mirror reaction. Applied Physics B 92, 49–52 (2008). [Google Scholar]
- Vo-Dinh T., Alarie J. P., Cullum B. M. & Griffin G. D. Antibody-based nanoprobe for measurement of a fluorescent analyte in a single cell. Nat Biotechnol 18, 764–767 (2000). [DOI] [PubMed] [Google Scholar]
- Zheng X. T. & Li C. M. Single living cell detection of telomerase over-expression for cancer detection by an optical fiber nanobiosensor. Biosens Bioelectron 25, 1548–1552 (2010). [DOI] [PubMed] [Google Scholar]
- Kasili R. M., Cullum B. M., Griffin G. D. & Vo-Dinh T. Nanosensor for in vivo measurement of the carcinogen benzo[a]pyrene in a single cell. J Nanosci Nanotechno 2, 653–658 (2002). [DOI] [PubMed] [Google Scholar]
- Clark H. A., Kopelman R., Tjalkens R. & Philbert M. A. Optical nanosensors for chemical analysis inside single living cells. 2. Sensors for pH and calcium and the intracellular application of PEBBLE sensors. Anal Chem 71, 4837–4843 (1999). [DOI] [PubMed] [Google Scholar]
- Hong W. et al. Nanoscale Label-free Bioprobes to Detect Intracellular Proteins in Single Living Cells. Sci Rep-Uk 4, (2014). [DOI] [PMC free article] [PubMed] [Google Scholar]
- Vitol E. A. et al. In Situ Intracellular Spectroscopy with Surface Enhanced Raman Spectroscopy (SERS)-Enabled Nanopipettes. Acs Nano 3, 3529–3536 (2009). [DOI] [PubMed] [Google Scholar]
- van Zanten T. S., Cambi A. & Garcia-Parajo M. F. A nanometer scale optical view on the compartmentalization of cell membranes. Bba-Biomembranes 1798, 777–787 (2010). [DOI] [PubMed] [Google Scholar]
- Puygranier B. A. F. & Dawson P. Chemical etching of optical fibre tips - experiment and model. Ultramicroscopy 85, 235–248 (2000). [DOI] [PubMed] [Google Scholar]
- Cao J. & Wang J. Z. Development of Ag nanopolyhedra based fiber-optic probes for high performance SERS detection. New J Chem 39, 2421–2424 (2015). [Google Scholar]
- Morley J. F., Brignull H. R., Weyers J. J. & Morimoto R. I. The threshold for polyglutamine-expansion protein aggregation and cellular toxicity is dynamic and influenced by aging in Caenorhabditis elegans. Proceedings of the National Academy of Sciences 99, 10417–10422 (2002). [DOI] [PMC free article] [PubMed] [Google Scholar]
Associated Data
This section collects any data citations, data availability statements, or supplementary materials included in this article.


