

Abstract
A novel rat model for a well-characterized human mitochondrial disease, mitochondrial DNA depletion syndrome with associated deoxyguanosine kinase (DGUOK) deficiency, is described. The rat model recapitulates the pathologic and biochemical signatures of the human disease. The application of electron paramagnetic (spin) resonance (EPR) spectroscopy to the identification and characterization of respiratory chain abnormalities in the mitochondria from freshly frozen tissue of the mitochondrial disease model rat is introduced. EPR is shown to be a sensitive technique for detecting mitochondrial functional abnormality in situ and, here, is particularly useful in characterizing the redox state changes and oxidative stress that can result from depressed expression and/or diminished specific activity of the distinct respiratory chain complexes. As EPR requires no sample preparation or non-physiological reagents, it provides information on the status of the mitochondrion as it was in the functioning state. On its own, this information is of use in identifying respiratory chain dysfunction; in conjunction with other techniques, the information from EPR shows how the respiratory chain is affected at the molecular level by the dysfunction. It is proposed that EPR has a role in mechanistic pathophysiological studies of mitochondrial disease and strong potential as an additional diagnostic tool.
Keywords: DGUOK, redox, oxidative, stress, mtDNA depletion, pathology
Graphical Abstract

Introduction
Mitochondrial disease (MD) occurs where depletion of mitochondrial DNA (mtDNA) or mutations in mtDNA and/or nuclear DNA (nDNA) lead to altered mitochondrial function.(1–4) Altered activities of Complexes I – V have been identified and physiological consequences of mitochondrial respiratory chain defects include reduced metabolic capacity, reduced ATP synthesis, and increased oxidative and nitrosative stress.(5–15) Symptoms of MD are manifold and include weakness (from central nervous system, peripheral nerve, and/or skeletal muscle disease), pain, intolerance of some general anesthetics and anti-epileptic drugs, gastrointestinal disorders, ophthalmoplegia and/or visual failure, failure to thrive, cardiac and respiratory disease, liver disease, diabetes, seizures, sensorineural hearing loss, mental retardation, dementia, movement disorders, increased susceptibility to infection, and pregnancy loss.(1, 2, 16–38) Establishing diagnoses and understanding the pathophysiology of mitochondrial disease (MD) has proven extremely challenging because of the extraordinary range of clinical symptoms and testing abnormalities (39). MD is often suspected in early childhood from clinical differential diagnosis of patients with diseases involving the brain, muscle, or liver. Traditional methods for diagnosing MD include clinical presentation, family history, pathology, metabolic profiling, enzyme activity levels, electrophysiology, magnetic resonance imaging (MRI) of brain and magnetic resonance spectroscopy (MRS) of metabolites, and mtDNA analysis (3, 7, 31, 40–53). Additional indicators include observation of mitochondrial proliferation, abnormalities on muscle histology (e.g., ragged red fibers or succinate dehydrogenase-positive fibers) (41, 54), and abnormalities in electron microscopy (46, 55). However, muscle histology may be normal despite the presence of biochemical abnormalities in the tissue. The determination of whether MD is present in a given patient can be extremely complex, given that (i) mitochondrial function can be secondarily affected due to the disease processes in non-mitochondrial diseases, (ii) there can be extensive variability in the distribution of abnormal mitochondria within an individual patient, allowing a “false negative” testing profile to occur when tissues with mitochondrial abnormalities are not tested, and (iii) there are no uniform, definitive pathological abnormalities that distinguish all MD patients from patients with other disorders. Diagnosis may ultimately rely on the application of diagnostic algorithms to predict the likelihood of MD (56, 57) but MD is currently an under-diagnosed disease (4, 58–64).
Mechanistic information on MD has largely arisen from mitochondrial electron transport chain component activity assays on the components, isolated from their native matrix from fresh or frozen tissue, or from cultured cells. These assays are, like most clinical biochemical assays, performed under non-physiologic basal conditions and with very different substrate concentrations than are seen in-vivo. Complex interactions between the substrates of these assays and other cellular components can lead to erroneous results (65) though these problems can, in principle be, overcome with careful isolation of proteins or in-gel assays. Assays of activities outside of the intact mitochondrial environment cannot identify defects in mitochondrial membrane potential or coupling. In clinical practice, it has been found that the methodological variations, limitations and difficulties associated with the use of respiratory chain functional assays as a diagnostic method for MD has led to massive inter-laboratory variability in results (66). In alternative approaches, substrates are added to whole cells or isolated mitochondrial preparations, and either oxygen consumption or ATP generation is measured [reviewed in (67)]. While recognized as the current standard for mitochondrial testing there are, again, significant limitations. Most apparent is the requirement for viable functioning mitochondria, requiring cell preparation or mitochondrial isolation and testing to be carried out temporally, and therefore geographically, proximate to the biopsy. The process of isolating mitochondria from native tissue risks damage and places the organelle outside of a truly physiologic condition. Conversely, whole cell assays require permeabilization of the cell to the substrates and transport to the mitochondria. The potentially limited ability to get reagents to the site of action can lead to a loss of sensitivity and specificity. In all of the currently employed assays, the mitochondrial function is not assessed in its native-organ context in the human and the need persists for an assay that measures the functional ability of mitochondria in an intact tissue preserved in a state as close as possible to that in situ.
Electron paramagnetic (spin) resonance (EPR, ESR) is a technique that can provide unique insight into mitochondrial status. EPR detects and characterizes free radicals and many transition metal ions and clusters in biological systems by measuring the magnetic field dependence of the absorption of microwave radiation at a given frequency by the unpaired electrons residing in these species (68). The mitochondrial respiratory chain Complexes I – IV are particularly rich in transition metal-containing redox centers, with a complement of 21 centers that include heme iron, copper, and [2Fe2S], [3Fe4S] and [4Fe4S] iron sulfur (FeS) clusters. Up to 18 of these adopt EPR-detectable paramagnetic states in native mitochondria and are readily observed at temperatures close to liquid helium (10 – 40 K) (69). The spin-Hamiltonian parameters, midpoint potentials and relaxation behavior of these centers have been reasonably well characterized (69–87), along with some other tissue-specific signals from transferrin, ceruloplasmin, and catalase (88–90). Specific applications of EPR to mitochondria have included detection of an irreversible deficiency in Complex I FeS clusters in iron-deficient rats (91), heme-nitrosyl in substantia nigra of Parkinson’s diseased brain (92), chromium-dependent inhibition of Complexes I & II and aconitase (93), cardio- and neuro-protection against doxorubicin (80), prophylaxis against 1-methyl-4-phenyl-1,2,3,6-tetrahydropyridine in a Parkinson’s mouse model (82), the differential sensitivity of aconitase and FeS clusters from Complexes I & III to oxidative and nitrosative stress in heart (94), and the sensitivity of Complex III FeS clusters in aging heart to ischemia (95). However, despite these successes in mechanistic studies, the authors are unaware of any direct application of EPR for functional pathophysiologic studies in humans or whole animal models with primary mitochondrial disease; the closest analog is a study in which a comparison of EPR signals from muscle biopsies of sepsis patients indicated significant depletion of Complex I FeS signals in those who died compared to survivors (86, 96).
One group of MD that has been recently well-characterized and suggests itself as a promising model for evaluation of new pathophysiologic methodologies is the mitochondrial DNA (mtDNA) depletion syndromes (MDS). MDS comprises a genetically and clinically heterogeneous group of autosomal recessive diseases characterized by a reduction in tissue-specific mtDNA copy number. This reduction is a result of molecular defects in either the genes responsible for mtDNA biogenesis, or those required for the maintenance of deoxynucleotide pools or mtDNA integrity (97–99). The loss of mtDNA can lead to a variety of clinical presentations that are dependent on the gene involved and the nature of the mutation. Depletion of mtDNA is the most common cause of multi-systemic oxidative phosphorylation defects (100), with deoxyguanosine kinase (DGUOK) deficiency being the most frequent cause. Death commonly results from liver failure (26, 97, 101, 102), which may occur in the context of natural disease progression, exposure to sodium valproate (103–105) or complications of viral infections such as influenza (55, 106). Less severe attenuation of DGUOK function may result in a susceptibility to isolated liver failure (97, 107, 108) or a myopathic presentation of DGUOK deficiency (109). Some cases with milder mutations have required liver transplantation, with its attendant complications, and may subsequently develop myopathy (97, 108). Over the preceding 5 years, we have developed an accurate method for assay of tissue-specific mitochondrial DNA content using quantitative real-time polymerase chain reaction (qPCR) that has led to accurate retrospective modeling and prospective diagnosis of patients with hepatic mtDNA depletion (55, 110–116). This is accepted as the clinical standard for diagnosis of mtDNA depletion (54). The development of a robust diagnosis for MDS and the detailed characterization of DGUOK deficiency, in particular, suggested to us that an animal model of DGUOK deficiency would be of great value in developing and evaluating the potential of new diagnostic and pathophysiologic techniques for MD.
In the present work, we aim to introduce EPR of tissue samples at cryogenic temperatures as a mechanistic tool for MD. We have developed a rat model of DGUOK deficiency (referred to by the trivial name “DGUOK”) that exhibits characteristic biomarkers, and we have applied standard biochemical and pathological tests along with EPR. The goals of this work are to characterize the DGUOK rat in terms of mitochondrial dysfunction and pathological outcome, and to evaluate EPR as a new and additional technique in an integrated characterization of MD.
Materials and Methods
The DGUOK rat model of DGUOK deficiency
Previously described zinc-finger nuclease (ZFN) technology was employed (117, 118). A preferred binding/cutting site of GTCGGTTCCTTCTGCgtagacTCCGAGCGTCTTTCCG was identified from a clinically relevant transcript of DGUOK and the appropriate ZFN was obtained from Sigma Aldrich (CompoZr Custom ZFN Service). This was injected into the pronucleus of a fertilized one-cell embryo. These microinjected embryos were then implanted into a “pseudo-pregnant” recipient female rat. This resulted in the generation of four characterized DGUOK rat knockout lines named SSdguokM1 SSdguokM2 SSdguokM3 and SSdguokM4. Because of the rare potential for an off-target effect, where ZFNs cause double-strand breaks and mutations at undesired loci, we backcrossed and bred homozygote animals from these two lines (117). The “M1” line has a 31 base pair deletion after amino acid six leading to a premature stop codon, i.e., a polypeptide with 34 amino acids (the first 6 from the original protein sequence and 28 from the missense). Similarly, the “M2” line has a 37 base pair amino acid deletion after amino acid six. This frame-shift mutation would lead to a 42 amino acid polypeptide with only the first 6 amino acids consistent with the original protein sequence.
The M3 line had a net 57bp frameshift deletion in exon 1 including the initiation codon which is predicted to lead to the use of an alternate start codon in exon 1 with a 5′ truncated protein devoid of the mitochondrial targeting sequence. The M4 line had an in-frame deletion of 9 nucleotides in the targeting sequence. This strain does not have hepatic mtDNA depletion and, because of the adequacy of the first two models, was not further characterized.
The generation of the animal model and all subsequent animal experiments were performed under approved Animal Use Application by the Institutional Animal Care and Use Committee (IACUC) of the Medical College of Wisonsin (protocols 2214 and 1764, respectively).
mtDNA assay
Real time analysis was performed as previously published and validated in humans (55, 97, 112) using rat specific primers. DNA was extracted using Qiagen Blood Core Kit #158389 and quantified using the Quant-iT PicoGreen double stranded DNA kit (Invitrogen) and a Varioskan plate reader (Thermo Fisher) in 96 well format. DNA is diluted to a concentration falling with in efficiency range of the assay 0.125–4 ng/l. qPCR was carried out on 10 μl samples, each containing between 0.35 and 12 ng of extracted DNA, 5 pmol of each forward and reverse primer, and 5 μl iTAQ SYBR Green Supermix with ROX (BioRad). The mitochondrial genome-targeted rat-specific primers used were tRNALeu F: GGTTATTAGGGTGGCAGAGC and tRNALeu R:GGAAGGCCATGGCAATTAAG. Nuclear primers, targeted to the ActB coding region, were ActB F:TACCACTGGCATTGTGATGG and ActB R: ACGCTCGGTCAGGATCTTC. The Basic Local Alignment Search Tool (National Center for Biotechnology Information) was used to show that primers hybridized to unique sequences in Rattus norvegicus. The real-time qPCR cycling conditions were (i) 50°C for 2 min, (ii) 95°C for 10 min, (iii) 45 cycles of 15 seconds at 95°C, and (iv) a combined 62°C anneal/extension for 30 seconds. Upon completion of 45 cycles, a pre-programmed dissociation step was carried out by one cycle of 95°C for 15 seconds, 50°C for 15 seconds and 95°C for 15 seconds. Real-time fluorescence was measured and analyzed on a 7900HT Fast Real-Time PCR system (Applied Biosystems, Foster City, CA) using SDS V2.3 software. All samples were assayed in triplicate. The relative mtDNA copy number was determined from the threshold difference between the averages of each set of triplicate reactions.
Histology
A portion of each heart, lung, liver, spleen, and kidney from 4 wild-type SS rats and 5 SSdguokM2DGUOK rats at 11 months of age was fixed in formalin for histological analysis. Fixed tissue was paraffin-embedded, sectioned, and stained with hematoxylin and eosin (H&E) using standard techniques. To evaluate possible liver fibrosis, sections of liver were also stained using Masson trichrome stain using standard techniques. For evaluation of muscle pathology, a quadriceps muscle from each animal was frozen in isopentane at −78.5 °C, and 8 μm cryosections were stained for H&E, Gomori trichrome, reduced nicotinamide adenine dinucleotide (NADH), cytochrome oxidase (COX), and succinate dehydrogenase (SDH) using standard techniques.
Protein immunoblot (western blot)
Protein homogenates prepared from the quadriceps muscle were evaluated for mitochondrial electron transport chain complex expression using standard western blot techniques (119). Transferred proteins were probed with a MitoProfile Total OXPHOS Blue Native WB Antibody Cocktail (MitoSciences #MS603, Abcam, Cambridge, MA), which includes antibodies against mitochondrial respiratory chain complexes I–V, and visualized using enhanced chemiluminescence. Quantification was performed using ImageJ version 1.44p and statistics were evaluated using Student’s t-test.
Electron transport chain activity assay
Electron transport chain activity assays were carried out on frozen rat muscle and liver (n = 6 for controls and n = 5 for DGUOK rats) according to protocols previously described in detail (120, 121) with the modification that the linear initial velocity in the first minute was determined for Complex III, instead of a formal rate constant, due to the lower activity compared to Complexes I, II and IV. The activities of Complexes I – IV were normalized for mitochondrial content by dividing by citrate synthase activity. The results of electron transport chain activity assays are not normally distributed but become so after transformation to their natural logarithms. Results are expressed as average values and the standard error of the mean. Significance is expressed by the non-parametric Mann-Whitney U test on the raw data and by Student’s t-test of the logarithmically transformed data. Blue native PAGE analysis with in-gel activity staining was carried out as previously described (121–123). This allowed the identification of decreased synthesis of mitochondrial subunits (124).
EPR spectroscopy
Fresh tissue samples for EPR were rapidly extruded into 3 mm diameter EPR tubes and frozen in liquid nitrogen within 90 s of harvest (we have found that tissue can be frozen much more rapidly than dilute aqueous solutions and with much reduced risk of the EPR tube breaking). Samples entirely filled the active length of the EPR resonator. EPR spectra were recorded on a Bruker EleXsys E600 spectrometer equipped with a Super-X microwave bridge with integrated microwave counter, an ER4112SHQ resonant cavity operating at 9.38 GHz, and an Oxford Instruments ESR900 helium flow cryostat and ITC503 temperature controller. Spectra were recorded with 10 G magnetic field modulation at 100 kHz and this modulation amplitude determined the spectral resolution. Microwave powers and temperatures are given in the figure legends. Scans of 4096 points, 8000 G field envelope and 3 min duration were averaged over 60 – 180 min to provide the final spectrum. A background spectrum collected on frozen water was subtracted from rat tissue spectra. Experimental spectra were modeled by fitting a library of computed spectra corresponding to the mitochondrial respiratory chain centers and the [3Fe4S] cluster of aconitase (69), using a Levenberg-Marquardt algorithm to minimize χ2 (IGOR Pro v. 6.32A, Wavemetrics, Lake Oswego, OR). The contributions of each component were constrained to ≥ 0. Correlation matrices indicated strong interdependencies (correlation coefficients ~ 0.7) of contributions from the pairs of signals (i) Complex II S3 3Fe4S and aconitase 3Fe4S, and (ii) Complex I N1b and N2 FeS clusters. N1b and N2 could not be deconvoluted and only the overall contribution from N1b + N2 is given, whereas S3 and aconitase were deconvoluted by the use of two temperatures (69). Computed spectra of the individual components were calculated with XSophe (Bruker Biospin; (125, 126)) using spin Hamiltonian parameters from the literature (69–79), and computed spectra were normalized for the intensity of ∫χ″.dH (i.e. the first integral of the EPR absorption, or so-called “double-integrated spectrum”) prior to fitting to the experimental data.
Results
Recapitulation of mtDNA depletion in DGUOK rat
To evaluate the phenotype, three M2, four M1 and six SS 8-week-old females were sacrificed and tissue harvested. DNA was extracted and subject to qPCR evaluation using validated rat-specific primers, but otherwise as previously described (112). This method demonstrates an approximately 90% reduction in hepatic mtDNA content (Figure 1). This reduction is similar to the 80–90% reduction in hepatic mtDNA seen in humans with this disorder (112). Similarly, a 60–80% reduction in splenic DNA content was observed (100). The situation was less clear in muscle; while M1 rats exhibited about 60 % depletion in mtDNA, the mtDNA level in the M2 rat was indistinguishable from that in wild-type. Consequently mtDNA content was assessed in sections of the same tissue that was used for Histology, ETC and EPR assays. This demonstrates no significant difference in mtDNA content in skeletal muscle, regardless of predominant oxidative fiber type (Table S1).
Figure 1. Absolute mtDNA content in DGUOK rats.

The mtDNA copy numbers for eight week old M1 and M2 DGUOK knockout rats compared with wild-type (SS) rats. The error bars indicate standard deviations for n = 6 (SS), n = 4 (M1) and n = 3 (M2).
Pathology of the DGUOK rat
A pathological analysis was performed on 4 wild-type and 5 DGUOK rats at approximately 11 months of age, including the histological evaluation of heart, lung, liver, spleen, kidney, and muscle. H&E-stained sections of heart, lung, liver, spleen, and kidney revealed no apparent differences in the organ histology when comparing wild-type and DGUOK rats. Liver fibrosis was further evaluated using Masson trichrome staining, which also showed no evident differences between wild-type and DGUOK livers. In contrast, there were marked differences on oxidative enzyme staining when comparing the quadriceps muscles of wild-type and DGUOK rats (Figure 2). While pathological differences were not apparent on H&E staining, there were numerous fibers that showed negative staining on both cytochrome oxidase (COX) and succinate dehydrogenase (SDH) stains (Figure 2). Large numbers (up to 20–30% of fibers) of these COX negative/SDH negative fibers were seen in all DGUOK rats, whereas they were essentially absent in all of the wild-type rat muscles examined.
Figure 2. Skeletal muscle pathology in 11 month old WT and DGUOK rats.

Quadriceps muscles from DGUOK rats display little differences on H&E staining in comparison to WT littermates. In contrast, staining for COX and SDH reveals numerous fibers in DGUOK rat muscle that are negative for both COX and SDH, whereas no such fibers were evident in WT rat muscle. The bar at the bottom, right corresponds to 200 μm.
Expression of respiratory chain complexes
Mitochondrial protein expression was found to be altered in quadriceps muscle of the 11 month old DGUOK rat (Figure 3). Specifically, the data indicated that Complex I was significantly under-expressed (54 % of wild-type; p = 0.05) and suggested that Complex III was also under expressed (47 % of wild-type; p = 0.12). The expression levels of Complexes II, IV & V were unchanged in DGUOK rat muscle. Varying, though generally low, amounts of an unidentified immunoreactive protein with Mr ≈ 30 kDa were also observed.
Figure 3. Respiratory chain complex expression in DGUOK rat muscle.

Western blots of mitochondrial electron transport chain complexes I–V and GAPDH from stripped membranes of quadriceps muscle from 11 month old wild-type and DGUOK rats are shown in the top panel. The results of quantitation of the respiratory chain complex bands are shown below, normalized for GAPDH expression. The error bars indicate standard errors for n = 4.
Electron chain transport assays
Significantly lower activities for Complexes I, III and IV were observed in DGUOK rat liver, corresponding to about 20 %, 7 % and 13 % of wild-type activity, respectively, whereas Complex II activities were statistically indistinguishable (Figure 4, Table 1). In DGUOK muscle, the activities of Complexes I and III were only 9 % and 20 % of wild-type, respectively, whereas Complex II and IV activities were essentially indistinguishable.
Figure 4. Electron transport chain functional assays of Complexes I– IV.
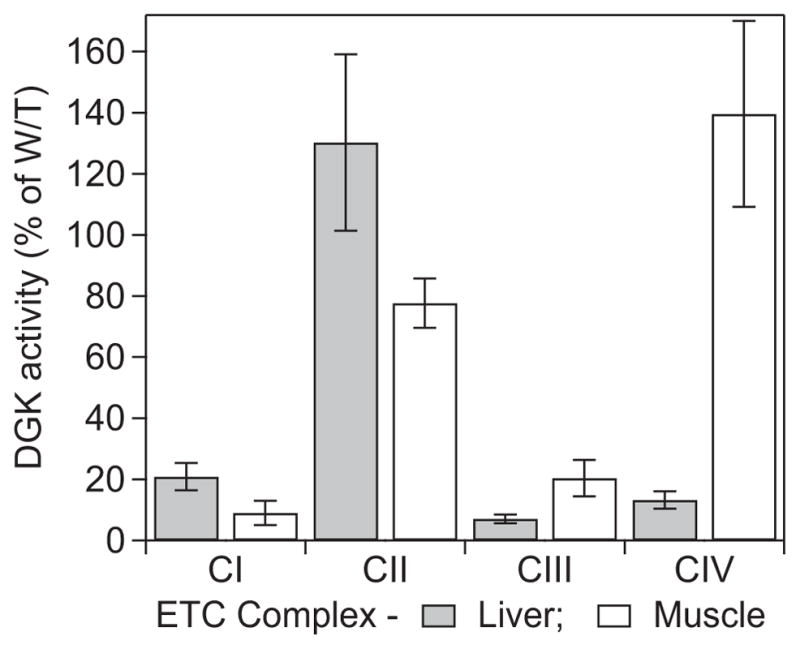
The functional activities of Complexes I – IV from liver and quadriceps muscle of DGUOK rat are shown, normalized for mitochondrial content (as citrate synthase activity) and expressed as percentages of activities from wild-type. Detailed results are given in Table 1 (or S1).
Table 1.
Results of electron transport chain assays of Complexes I – IV from muscle and liver from wild-type and DGUOK rats
| TISSUE Activity assayed |
1000 × Wild-type activity ÷ citrate synthase activity | 1000 × DGUOK activity citrate ÷ synthase activity | Mann-Whitney U test p-value | t-Test with transformed data p-value |
|---|---|---|---|---|
| LIVER | ||||
| Complex I | 230.08 ± 18.81 | 47.64 ± 9.53 | 0.008 | 0.002 |
| Complex II | 991.9 ± 95.3 | 1291.6 ± 258.3 | 0.522 | 0.250 |
| Complex III | 14.35 ± 0.80 | 1.02 ± 0.20 | 0.008 | 0.001 |
| Complex II – III | 430.1 ± 32.6 | 129.3 ± 25.9 | 0.029 | 0.012 |
| Complex IV | 137.54 ± 11.69 | 17.70 ± 3.54 | 0.014 | 0.002 |
| MUSCLE | ||||
| Complex I | 108.1 ± 8.25 | 9.73 ± 4.25 | 0.008 | 0.015 |
| Complex II | 278.1 ± 16.42 | 215.8 ± 18.41 | 0.522 | 0.093 |
| Complex III | 3.43 ± 0.48 | 0.70 ± 0.18 | 0.036 | 0.025 |
| Complex II –III | 263.7 ± 28.53 | 157.6 ± 15.36 | 1.00 | 0.070 |
| Complex IV | 38.63 ± 5.60 | 53.93 ± 8.76 | 0.412 | 0.434 |
EPR spectroscopy
The EPR spectra at 12 K of liver, quadriceps muscle and heart from wild-type and DGUOK rats are shown in Figure 5. The signals are complex but some features are immediately identifiable and are labeled a – k in Figure 5. Feature a at g′ ~ 6 is due to high-spin ferriheme; b at g′ ~ 4 is due largely to Fe(III) in transferrin; a complex pattern extending upfield from c is due to Mn(II), which is prominent in liver but much less so in quadriceps muscle and not detectable in heart, and overlaps the signals from the respiratory chain iron sulfur clusters; the prominent feature at d is the so-called “g = 2.01” signal and is due to overlapping signals from the oxidized 3Fe4S clusters of Complex II and oxidatively-damaged aconitase; the signal at e, the so-called “g = 1.94” signal, is due to overlapping g2 resonances from reduced 2Fe2S and 4Fe4S clusters, primarily those from Complex I; the signals at f are the g3 resonances from Complex I N4 4Fe4S (lower field) and Complex I N3 2Fe2S (higher field) and are overlaid on the highest field mI = 5/2 resonance of the mS = ½ manifold of S = 5/2 Mn(II) (the latter is not clear in trace A but much more pronounced in trace B); the resonances labeled g are gx and gy of the rhombic high-spin ferriheme of catalase (88); the resonances around h are due to low-spin ferriheme; feature i is the g1 (gx) resonance of low-spin heme a of Complex IV; and k indicates the g1 (gx; lower field) and g3 (gz; higher field) resonances from the Rieske 2Fe2S cluster of Complex II. The broad EPR absorption in the liver spectra from about 2000 G is largely due to rapid-passage of the Mn(II) leading to an absorption-like signal that includes components from the mS = 3/2 and mS = 5/2 manifolds (127), along with some contribution from CuA of Complex IV.
Figure 5. 12 K EPR spectra from wild-type and DGUOK rat tissue.

The spectra are from samples of A, wild-type rat liver; B, DGUOK rat liver; C, wild-type rat quadriceps muscle; D, DGUOK rat quadriceps muscle; E, wild-type rat heart; and F, DGUOK rat heart. In each case, the sample completely filled the part of the EPR tube that occupied the active region of the resonator. A & B shown × 1, C & D are shown × 2, and E & F shown × 0.5. Spectra were recorded at 12 K, 2.5 mW power. The lower-case labels identify specific signals in the spectra: (a) high-spin axial ferriheme g⊥; (b) transferrin non-heme Fe(III); (c) the mI = 5/2 line at the low-field extremity of the six-line Mn(II) hyperfine pattern; (d) overlapping signals from aconitase and S3 [3Fe4S] clusters; (e) overlapping g2 resonances from Complex I [2Fe2S] and [4Fe4S] clusters; (f) resolved g3 resonances from N4 and N3 clusters; (g) high-spin catalase gx and gy lines; (h) low-spin catalase resonances; (i) heme a g1; and (k) Rieske [2Fe2S] cluster g1 and g3 resonances.
Visual inspection of the spectra provides some limited information. Mn(II) is clearly elevated in DGUOK liver whereas the reduced Complex I FeS signals (e, f) are diminished. In DGUOK quadriceps muscle, the Complex I FeS signals and the Complex III Rieske signals are markedly diminished compared to wild-type. In both muscle and liver, the g = 2.01 signal (d) due to Complex II S3 and/or aconitase appears elevated in DGUOK compared to wild-type. To further investigate this phenomenon, spectra were recorded at 40 K (Figure 6) where the faster-relaxing S3 signal intensity is lowered relative to the more slowly relaxing aconitase signal. In liver, the difference in intensity of the g = 2.01 signal persists and we assign this as being due to a 25 % increase in the aconitase signal in DGUOK over wild-type. In quadriceps muscle at 40 K, the DGUOK signal is now smaller than the wild-type signal, indicating that the difference at 12 K is due to elevated amounts of oxidized Complex III S3 3Fe4S. Clear signals due to g1 (gx) of heme a of Complex IV were only observed in heart. The signals in liver and quadriceps were much broader and suggestive of a distribution of g-values; this resonance position of this signal was found to be very sensitive to mutations in bacterial cytochrome c oxidase (128) and the apparent distribution of g1 values may reflect multiple environments in liver mitochondria. In liver, the signal from transferrin was elevated and that from catalase was depressed. Interestingly, no significant differences at all were observed between the EPR spectra of heart from wild-type and DGUOK rats.
Figure 6. 40 K EPR spectra from wild-type and DGUOK rat tissue.

The spectra are from samples of A, wild-type rat liver (solid line) and DGUOK rat liver (dashed line); and B, wild-type rat quadriceps muscle (solid line) and DGUOK rat muscle (dashed line). Spectra were recorded at 40 K, 2.5 mW power.
For quantitative information we turned to computer simulation of the spectra. Figure 7 shows the g ~ 2 region of the experimental spectra for liver (A, B), quadriceps muscle (E, F) and heart (I, J) from DGUOK and wild-type rats. In each case, fits to the library of computed spectra were generated. As we are particularly interested in the differences between wild-type and DGUOK, difference spectra (DGUOK minus wild-type) of the experimental data (C, G and K for liver, muscle and heart, respectively) and the computed fits (D and H for liver and muscle; no significant difference was observed between the fits to wild-type and DGUOK heart) are presented. The experimental and computed difference spectra match very well and details of the fits are given in Table 2/Table S2. From the fit parameters, and using the dual temperature study to resolve the S3 and aconitase 3Fe4S contributions, we calculated the fractional difference between the intensities of each of the components in the DGUOK and wild-type tissues, and the significant results are summarized in Figure 8.
Figure 7. Quantitative analysis of the 12 K EPR signals from wild-type and DGUOK rat tissues.

Traces A, B, E, F, I and J show the g′ ~ 2 region of the EPR spectra of A, wild-type rat liver; B, DGUOK rat liver; E, wild-type rat quadriceps muscle; F, DGUOK rat quadriceps muscle; I, wild-type rat heart; and J, DGUOK rat heart. Trace C is the difference spectrum obtained by subtraction of A from B, and is shown multiplied by a factor of two; likewise, G = 2×(F − E) and K = 2×(J − I). Trace D is a theoretical simulation of C generated by the subtraction of fits of A and B to model spectra of the paramagnetic species likely to be observed in the mitochondrion. Fitting parameters are presented in Table 2 (or S2). Similarly, trace H is a simulation of J from fits to E and F. No attempt was made to simulate K, as no significant differences were observed between fits to I and J.
Table 2.
Fitting parameters for the EPR signals from spectra of liver and muscle tissue from wild-type and DGUOK rats. The absolute intensities of each species (or group of species) are shown for wild-type and DGUOK, along with the percentage differences between DGUOK and wild-type intensities in brackets
| EPR Signal | Liver W/T | Liver DGUOK [Δ (%)]a | Muscle W/T | Muscle DGUOK [Δ (%)] | Heartb |
|---|---|---|---|---|---|
| CuA | 47 ± 13 | 44 ± 15 [NS]c | 9 ± 1 | 13 ± 1 [+45] | NDd |
| Heme a | 200 ± 50 | 100 ± 60 [−50] | ND | ND | 200 ± 30 |
| High-spin heme | 116 ± 7 | 71 ± 9 [−39] | 44 ± 1 | 31 ± 1 [−30] | 183 ± 3 |
| N1b + N2 | 26 ± 5 | 16 ± 5 [−39] | 28.2 ± 0.2 | 7.4 ± 0.5 [−74] | 111 ± 1 |
| FeS N3 | 17 ± 8 | 8 ± 5 [−53] | 16 ± 1 | 5.5 ± 0.7 [−61] | 38 ± 4 |
| FeS N4 | 41 ± 8 | 20 ± 6 [−51] | 33 ± 1 | 14 ± 1 [−59] | 108 ± 4 |
| All Complex I FeS | 84 ± 12 | 44 ± 9 [−49] | 77 ± 1 | 26 ± 1 [−66] | 257 ± 6 |
| S3 + Acn | 10.8 ± 1.6 | 15 ± 2 [+37] | 1.3 ± 0.1 | 3.8 ± 0.1 [+192] | 17 ± 1 |
| FeS S1 | 27 ± 10 | 29 ± 13 [NS] | 15 ± 1 | 8 ± 1 | 16 ± 5 |
| FeS S2 | ND | ND | ND | ND | 60 ± 5 |
| S1 + S2 | 27 ± 10 | 29 ± 13 [NS] | 15 ± 1 | 8 ± 1 [−48] | 76 ± 7 |
| Rieske FeS | 99 ± 11 | 98 ± 12 [NS] | 37 ± 1 | 18 ± 1 [−51] | 238 ± 5 |
| Mn(II) | 295 ± 27 | 588 ± 32 [+99] | 32 ± 3 | 20 ± 2 [−35] | ND |
Calculated as {[(DGUOK signal) − (wild-type signal)] ÷ (wild-type signal)}×100.
Wild-type and DGUOK heart were indistinguishable.
Not significant.
None detected.
Figure 8. Summary of EPR of DGUOK rat liver and muscle.

A comparison of signal intensities is shown for some of the respiratory complex redox centers in liver and muscle from the DGUOK and wild-type rat. The standard errors were calculated from those of the fit parameters, presented in Table 2 (or S2).
Discussion
The aims of this work are to describe the DGUOK rat mitochondrial phenotype and evaluate it as a model for mitochondrial disease, and to apply EPR spectroscopy of tissue to enable an understanding of what happens at the electron level in tissue with mtDNA depletion. The DGUOK rat has a complex and tissue-dependent mitochondrial phenotype. The DGUOK liver exhibited markedly lower mtDNA copy number, ~ 10 % of wild-type. However, EPR showed that Complex I FeS clusters were present at least 50 % as much as in wild-type, and signals from S1, S2, S3 and the Rieske FeS clusters indicated that Complexes II and III are expressed at the same level as in wild-type. The observation that the four EPR-detectable FeS cluster signals are depleted by the same amounts, despite very different redox potentials, and that signal intensities from both the S1–S2 pair and the Rieske cluster are indistinguishable from wild-type suggests that (i) the lowered Complex I signals are due to depressed expression or Fe incorporation, rather than an elevated redox potential, and (ii) the depleted Complex I complement therefore provides sufficient electrons to load the electron transfer chain. The aconitase 3Fe4S signal, a characteristic marker for oxidative stress (82), was elevated in DGUOK liver. Also, Mn(II), which is present at high levels in wild-type liver and is proposed to be additionally generated in response to oxidative stress (127), was doubled compared to wild-type. The activities of Complexes I, III and IV in DGUOK liver were very depressed compared to wild-type, and by far more that can be accounted for by expression levels. It is tempting to speculate that the oxidative stress identified by the aconitase and Mn(II) EPR signals is either a cause or consequence of the additional Complex I, II and IV dysfunction in DGUOK liver. The very low levels of Complexes III and IV activities explain the EPR observation that the electron transfer chain remains electron-rich, and the redox potential maintained close to the NADH:NAD midpoint potential, even though Complex I activity is also significantly depressed. The elevation of the EPR signal from transferrin may indicate some hemorrhaging, and the depression of the catalase signal also suggests some disease or damage to the liver (129).
The mitochondrial phenotype in DGUOK quadriceps muscle is also complex. Consistent with muscle evaluated in humans with severe disease, protein expression levels for Complexes I and III were also ~ 50 % of wild-type, whereas Complexes II, IV and V were expressed at wild-type (108). However, in contrast to humans with severe disease, the mtDNA copy numbers for wild-type and M2 DGUOK were similar across all muscle groups [table S1]. This lack of difference in the muscle types may reflect variability in sampling, the milder phenotype in the rats or an underlying correction in muscle tissue for example by de novo purine synthesis or alternate salvage pathways. This data underscores the limited sensitivity of qPCR previously described in human muscle (112) and emphasizes the need to consider evaluation of liver specifically for depletion in this disease.
Consistent with protein expression levels, EPR of DGUOK quadriceps muscle indicated that Complex I is present at ≥ 35 % of the wild-type level and Complex III at about 50 %. The EPR data for Complex II are revealing. The S3 cluster signal was twice as intense as in wild-type, yet the S1 and S2 clusters were diminished by a factor of two. This could indicate a catastrophic inability to correctly assemble Complex II or incorporate S1 and S2 but this would be expected to essentially abolish activity, and the elevation of S3 would require a doubling of Complex II expression. Neither phenomenon was observed. More likely, the changes in S1, S2 and S3 reflect a Complex II that experiences a significantly more oxidizing redox potential than in wild-type mitochondria. This hypothesis is strongly supported by the very low Complex I electron transferring activity compared to the downstream activities of Complexes II, III and IV. Therefore, Complex II is drained of electrons and produces the EPR signature observed in DGUOK quadriceps muscle. This scenario also explains the lack of markers for oxidative stress in the EPR signature of DGUOK muscle. In the absence of Complex I activity, very few electrons enter the respiratory chain to begin with. Furthermore, the downstream components are in a more oxidized state and thus are primed to receive any electrons that do enter the respiratory chain, essentially acting as antioxidants. So, while Complex III dysfunction results in electron buildup and oxidative stress in DGUOK liver, the lack of activity of Complex I and downstream oxidation of Complexes II – IV in muscle does not result in oxidative stress even though Complex III activity is as depressed in muscle as it is in liver. The only EPR marker observed for Complex IV in this study, the heme a signal, was very weak and broad in muscle and was not significant in the fits. Nevertheless, visual examination suggests a comparable signal in wild-type and DGUOK, consistent with the significant Complex IV activity. What remains unclear is the reason(s) behind the low activities of Complexes I and III. Native PAGE provides no evidence for subunit depletion, and EPR does not indicate oxidative stress.
In contrast to liver and quadriceps muscle, the heart in the DGUOK rat appears entirely unaffected. The mtDNA copy numbers are normal and the EPR signals of wild-type and DGUOK heart are indistinguishable themselves and very similar to wild-type quadriceps muscle. Large EPR signals from Complex I N3 and N4, a large signal from Complex III Rieske 2Fe2S, a high ratio of the g = 1.94 and g = 2.01 signals, and a weak signal from Complex IV heme a all indicate a very reducing environment that is consistent with an active Complex I and a fully functioning respiratory chain that does not produce oxidative stress.
EPR is a unique tool in that it can interrogate the status of the mitochondrion at the time of freezing, in unprocessed viable biological samples. First, it is clear that in both liver and quadriceps muscle, EPR identified mitochondrial dysfunction in the DGUOK rat. Second, some mechanistic information on the DGUOK rat was obtained. In liver, the EPR results indicated that the reduced electron transfer chain activity of Complexes I is in part due to reduced expression but that the very low activity of Complex, III is not a consequence of reduced expression or Fe incorporation as FeS clusters. The retention of the Complex III Rieske 2Fe2S EPR signal in DGUOK liver indicates that Complex III is present at wild-type levels, incorporates the Rieske cluster, and electrons can progress through the respiratory chain at least as far as the Rieske cluster. The reason for Complex III inactivity remains unknown but appears to be downstream of the Rieske cluster. Oxidative stress may be important, and two independent markers for oxidative stress were identified, elevated aconitase 3Fe4S and Mn(II); two markers for liver damage were also identified, depressed catalase and elevated transferrin. In quadriceps muscle, EPR provides complementary information to the activity assays. The lack of Complex I activity and the EPR identification of oxidation of the three Complex II FeS clusters provides a rationale for the lack of any EPR markers for oxidative stress in muscle. A knowledge of whether oxidative stress is a consequence of mitochondrial disease, and in which tissues and why, is an important piece of information that may inform therapy choices.
Conclusions
The DGUOK rat capitulates major biochemical features observed in humans with DGUOK deficiency, specifically significantly reduced mtDNA content, reduced mitochondrial complex I, III and IV protein content and enzymatic activity in frozen liver. EPR assessment of flash-frozen tissues has demonstrated dramatic differences in the mitochondrial electron transport chain status in situ compared with wild-type animals. The reproducibility and magnitude of these differences is encouraging given the relatively mild pathologic differences seen in the animals. It suggests that EPR may be able to reliably distinguish individuals with mitochondrial disease from distinct etiologies of muscle or liver disease in humans.
Supplementary Material
Table S1. In contrast to liver (n=5), mtDNA content in muscle tissue from 4 Wild Type (Dahl/SS) rats compared with 4 DGUOK M2 rats demonstrates no significant difference.
Highlights.
A rat model of DGUOK deficiency approximates the human disease
EPR is sensitive for detecting mitochondrial functional abnormality in situ.
EPR shows how the respiratory chain is affected by mitochondrial disease.
EPR has a role in mechanistic pathophysiological studies of mitochondrial disease
There is strong potential for EPR as an additional diagnostic tool.
Abbreviations
- COX
cytochrome oxidase
- M2
deoxyguanosine kinase-deficient rat model
- DGUOK
deoxyguanosine kinase
- EPR (ESR)
electron paramagnetic (spin) resonance
- FeS
iron-sulfur (cluster)
- H&E
hematoxylin and eosin
- MD
mitochondrial disease
- MDS
mitochondrial DNA depletion syndrome
- MPV17
mitochondrial inner membrane protein
- mtDNA
mitochondrial DNA
- NADH
reduced nicotinamide adenine dinucleotide
- POLG
DNA polymerase γ
- SDH
succinate dehydrogenase
- TWINKLE
a mitochondrial DNA helicase encoded by chromosome 10, open reading frame 2 (also known as C10orf2)
Footnotes
Publisher's Disclaimer: This is a PDF file of an unedited manuscript that has been accepted for publication. As a service to our customers we are providing this early version of the manuscript. The manuscript will undergo copyediting, typesetting, and review of the resulting proof before it is published in its final citable form. Please note that during the production process errors may be discovered which could affect the content, and all legal disclaimers that apply to the journal pertain.
Contributor Information
Brian Bennett, Email: brian.bennett@mu.edu.
Daniel Helbling, Email: dhelbling@mcw.edu.
Hui Meng, Email: hmeng@mcw.edu.
Jason Jarzembowski, Email: jjarzemb@mcw.edu.
Aron M. Geurts, Email: ageurts@mcw.edu.
Marisa W. Friederich, Email: maris.freiderich@ucdenver.edu.
Johan L. K. Van Hove, Email: johan.vanhove@childrenscolorado.org.
Michael W. Lawlor, Email: mlawlor@mcw.edu.
David P. Dimmock, Email: ddimmock@mcw.edu.
References
- 1.Ricci E, Moraes CT, Servidei S, Tonali P, Bonilla E, DiMauro S. Disorders associated with depletion of mitochondrial DNA. Brain Pathol. 1992;2:141–147. doi: 10.1111/j.1750-3639.1992.tb00682.x. [DOI] [PubMed] [Google Scholar]
- 2.Vu TH, Hirano M, DiMauro S. Mitochondrial diseases. Neurol Clin. 2002;20:809–839. vii–viii. doi: 10.1016/s0733-8619(01)00017-2. [DOI] [PubMed] [Google Scholar]
- 3.Gropman AL. Diagnosis and treatment of childhood mitochondrial diseases. Curr Neurol Neurosci Rep. 2001;1:185–194. doi: 10.1007/s11910-001-0015-9. [DOI] [PubMed] [Google Scholar]
- 4.Thorburn DR, Sugiana C, Salemi R, Kirby DM, Worgan L, Ohtake A, Ryan MT. Biochemical and molecular diagnosis of mitochondrial respiratory chain disorders. Biochim Biophys Acta. 2004;1659:121–128. doi: 10.1016/j.bbabio.2004.08.006. [DOI] [PubMed] [Google Scholar]
- 5.Craig AK, de Menezes MS, Saneto RP. Dravet syndrome: patients with co-morbid SCN1A gene mutations and mitochondrial electron transport chain defects. Seizure. 2012;21:17–20. doi: 10.1016/j.seizure.2011.08.010. [DOI] [PubMed] [Google Scholar]
- 6.DiMauro S, Lombes A, Nakase H, Mita S, Fabrizi GM, Tritschler HJ, Bonilla E, et al. Cytochrome c oxidase deficiency. Pediatr Res. 1990;28:536–541. doi: 10.1203/00006450-199011000-00025. [DOI] [PubMed] [Google Scholar]
- 7.Figarella-Branger D, Pellissier JF, Scheiner C, Wernert F, Desnuelle C. Defects of the mitochondrial respiratory chain complexes in three pediatric cases with hypotonia and cardiac involvement. J Neurol Sci. 1992;108:105–113. doi: 10.1016/0022-510x(92)90195-q. [DOI] [PubMed] [Google Scholar]
- 8.Hadzsiev K, Maasz A, Kisfali P, Kalman E, Gomori E, Pal E, Berenyi E, et al. Mitochondrial DNA 11777C>A mutation associated Leigh syndrome: case report with a review of the previously described pedigrees. Neuromolecular Med. 2010;12:277–284. doi: 10.1007/s12017-010-8115-9. [DOI] [PubMed] [Google Scholar]
- 9.Khurana DS, Salganicoff L, Melvin JJ, Hobdell EF, Valencia I, Hardison HH, Marks HG, et al. Epilepsy and respiratory chain defects in children with mitochondrial encephalopathies. Neuropediatrics. 2008;39:8–13. doi: 10.1055/s-2008-1076737. [DOI] [PubMed] [Google Scholar]
- 10.Kirby DM, Crawford M, Cleary MA, Dahl HH, Dennett X, Thorburn DR. Respiratory chain complex I deficiency: an underdiagnosed energy generation disorder. Neurology. 1999;52:1255–1264. doi: 10.1212/wnl.52.6.1255. [DOI] [PubMed] [Google Scholar]
- 11.Procaccio V, Wallace DC. Late-onset Leigh syndrome in a patient with mitochondrial complex I NDUFS8 mutations. Neurology. 2004;62:1899–1901. doi: 10.1212/01.wnl.0000125251.56131.65. [DOI] [PMC free article] [PubMed] [Google Scholar]
- 12.Wojtovich AP, Smith CO, Haynes CM, Nehrke KW, Brookes PS. Physiological consequences of complex II inhibition for aging, disease, and the mK(ATP) channel. Biochim Biophys Acta. 2013 doi: 10.1016/j.bbabio.2012.12.007. [DOI] [PMC free article] [PubMed] [Google Scholar]
- 13.Bleier L, Drose S. Superoxide generation by complex III: From mechanistic rationales to functional consequences. Biochim Biophys Acta. 2012 doi: 10.1016/j.bbabio.2012.12.002. [DOI] [PubMed]
- 14.Mari M, Morales A, Colell A, Garcia-Ruiz C, Kaplowitz N, Fernandez-Checa JC. Mitochondrial glutathione: Features, regulation and role in disease. Biochim Biophys Acta. 2012 doi: 10.1016/j.bbagen.2012.10.018. [DOI] [PMC free article] [PubMed] [Google Scholar]
- 15.Carelli V, La Morgia C, Sadun AA. Mitochondrial dysfunction in optic neuropathies: animal models and therapeutic options. Curr Opin Neurol. 2013;26:52–58. doi: 10.1097/WCO.0b013e32835c5f0b. [DOI] [PubMed] [Google Scholar]
- 16.Bindoff LA, Desnuelle C, Birch-Machin MA, Pellissier JF, Serratrice G, Dravet C, Bureau M, et al. Multiple defects of the mitochondrial respiratory chain in a mitochondrial encephalopathy (MERRF): a clinical, biochemical and molecular study. J Neurol Sci. 1991;102:17–24. doi: 10.1016/0022-510x(91)90088-o. [DOI] [PubMed] [Google Scholar]
- 17.Borchert A, Wolf NI, Wilichowski E. Current concepts of mitochondrial disorders in childhood. Semin Pediatr Neurol. 2002;9:151–159. doi: 10.1053/spen.2002.33800. [DOI] [PubMed] [Google Scholar]
- 18.Chitkara DK, Nurko S, Shoffner JM, Buie T, Flores A. Abnormalities in gastrointestinal motility are associated with diseases of oxidative phosphorylation in children. Am J Gastroenterol. 2003;98:871–877. doi: 10.1111/j.1572-0241.2003.07385.x. [DOI] [PubMed] [Google Scholar]
- 19.Goodfellow JA, Dani K, Stewart W, Santosh C, McLean J, Mulhern S, Razvi S. Mitochondrial myopathy, encephalopathy, lactic acidosis and stroke-like episodes: an important cause of stroke in young people. Postgrad Med J. 2012;88:326–334. doi: 10.1136/postgradmedj-2011-130326. [DOI] [PubMed] [Google Scholar]
- 20.Gordon N. Alpers syndrome: progressive neuronal degeneration of children with liver disease. Dev Med Child Neurol. 2006;48:1001–1003. doi: 10.1017/S0012162206002209. [DOI] [PubMed] [Google Scholar]
- 21.Harding AE, Holt IJ. Mitochondrial myopathies. Br Med Bull. 1989;45:760–771. doi: 10.1093/oxfordjournals.bmb.a072356. [DOI] [PubMed] [Google Scholar]
- 22.Katzberg H, Karamchandani J, So YT, Vogel H, Wang CH. End-stage cardiac disease as an initial presentation of systemic myopathies: case series and literature review. J Child Neurol. 2010;25:1382–1388. doi: 10.1177/0883073810367683. [DOI] [PubMed] [Google Scholar]
- 23.Longo N. Mitochondrial encephalopathy. Neurol Clin. 2003;21:817–831. doi: 10.1016/s0733-8619(03)00015-x. [DOI] [PubMed] [Google Scholar]
- 24.McDonald DG, McMenamin JB, Farrell MA, Droogan O, Green AJ. Familial childhood onset neuropathy and cirrhosis with the 4977bp mitochondrial DNA deletion. Am J Med Genet. 2002;111:191–194. doi: 10.1002/ajmg.10522. [DOI] [PubMed] [Google Scholar]
- 25.Menezes MP, Ouvrier RA. Peripheral neuropathy associated with mitochondrial disease in children. Dev Med Child Neurol. 2012;54:407–414. doi: 10.1111/j.1469-8749.2012.04271.x. [DOI] [PubMed] [Google Scholar]
- 26.Morris AA. Mitochondrial respiratory chain disorders and the liver. Liver. 1999;19:357–368. doi: 10.1111/j.1478-3231.1999.tb00063.x. [DOI] [PubMed] [Google Scholar]
- 27.Oldfors A, Tulinius M. Mitochondrial encephalomyopathies. J Neuropathol Exp Neurol. 2003;62:217–227. doi: 10.1093/jnen/62.3.217. [DOI] [PubMed] [Google Scholar]
- 28.Sakushima K, Tsuji-Akimoto S, Niino M, Saitoh S, Yabe I, Sasaki H. Adult Leigh disease without failure to thrive. Neurologist. 2011;17:222–227. doi: 10.1097/NRL.0b013e318217357a. [DOI] [PubMed] [Google Scholar]
- 29.Scaglia F. The role of mitochondrial dysfunction in psychiatric disease. Dev Disabil Res Rev. 2010;16:136–143. doi: 10.1002/ddrr.115. [DOI] [PubMed] [Google Scholar]
- 30.Schrier SA, Falk MJ. Mitochondrial disorders and the eye. Curr Opin Ophthalmol. 2011;22:325–331. doi: 10.1097/ICU.0b013e328349419d. [DOI] [PMC free article] [PubMed] [Google Scholar]
- 31.van Ekeren GJ, Stadhouders AM, Smeitink JA, Sengers RC. A retrospective study of patients with the hereditary syndrome of congenital cataract, mitochondrial myopathy of heart and skeletal muscle and lactic acidosis. Eur J Pediatr. 1993;152:255–259. doi: 10.1007/BF01956157. [DOI] [PubMed] [Google Scholar]
- 32.Wallace DC, Shoffner JM, Trounce I, Brown MD, Ballinger SW, Corral-Debrinski M, Horton T, et al. Mitochondrial DNA mutations in human degenerative diseases and aging. Biochim Biophys Acta. 1995;1271:141–151. doi: 10.1016/0925-4439(95)00021-u. [DOI] [PubMed] [Google Scholar]
- 33.Wells GD, Noseworthy MD, Hamilton J, Tarnopolski M, Tein I. Skeletal muscle metabolic dysfunction in obesity and metabolic syndrome. Can J Neurol Sci. 2008;35:31–40. doi: 10.1017/s0317167100007538. [DOI] [PubMed] [Google Scholar]
- 34.Fodale V, La Monaca E. Propofol infusion syndrome: an overview of a perplexing disease. Drug Saf. 2008;31:293–303. doi: 10.2165/00002018-200831040-00003. [DOI] [PubMed] [Google Scholar]
- 35.Footitt EJ, Sinha MD, Raiman JA, Dhawan A, Moganasundram S, Champion MP. Mitochondrial disorders and general anaesthesia: a case series and review. Br J Anaesth. 2008;100:436–441. doi: 10.1093/bja/aen014. [DOI] [PubMed] [Google Scholar]
- 36.Gurrieri C, Kivela JE, Bojanic K, Gavrilova RH, Flick RP, Sprung J, Weingarten TN. Anesthetic considerations in mitochondrial encephalomyopathy, lactic acidosis, and stroke-like episodes syndrome: a case series. Can J Anaesth. 2011;58:751–763. doi: 10.1007/s12630-011-9528-0. [DOI] [PubMed] [Google Scholar]
- 37.Papaioannou V, Dragoumanis C, Theodorou V, Pneumatikos I. The propofol infusion ‘syndrome’ in intensive care unit: from pathophysiology to prophylaxis and treatment. Acta Anaesthesiol Belg. 2008;59:79–86. [PubMed] [Google Scholar]
- 38.Driessen J, Willems S, Dercksen S, Giele J, van der Staak F, Smeitink J. Anesthesia-related morbidity and mortality after surgery for muscle biopsy in children with mitochondrial defects. Paediatr Anaesth. 2007;17:16–21. doi: 10.1111/j.1460-9592.2006.02043.x. [DOI] [PubMed] [Google Scholar]
- 39.Parikh S, Goldstein A, Koenig MK, Scaglia F, Enns GM, Saneto R, Anselm I, et al. Practice patterns of mitochondrial disease physicians in North America. Part 1: diagnostic and clinical challenges. Mitochondrion. 2014;14:26–33. doi: 10.1016/j.mito.2013.07.116. [DOI] [PubMed] [Google Scholar]
- 40.Abramovich CM, Prayson RA, McMahon JT, Cohen BH. Ultrastructural examination of the axillary skin biopsy in the diagnosis of metabolic diseases. Hum Pathol. 2001;32:649–655. doi: 10.1053/hupa.2001.24995. [DOI] [PubMed] [Google Scholar]
- 41.Chow CW, Thorburn DR. Morphological correlates of mitochondrial dysfunction in children. Hum Reprod. 2000;15(Suppl 2):68–78. doi: 10.1093/humrep/15.suppl_2.68. [DOI] [PubMed] [Google Scholar]
- 42.Edwards RH, Round JM, Jones DA. Needle biopsy of skeletal muscle: a review of 10 years experience. Muscle Nerve. 1983;6:676–683. doi: 10.1002/mus.880060910. [DOI] [PubMed] [Google Scholar]
- 43.Friedman SD, Shaw DW, Ishak G, Gropman AL, Saneto RP. The use of neuroimaging in the diagnosis of mitochondrial disease. Dev Disabil Res Rev. 2010;16:129–135. doi: 10.1002/ddrr.103. [DOI] [PubMed] [Google Scholar]
- 44.Gropman AL. Neuroimaging in Mitochondrial Disorders. Neurotherapeutics. 2012 doi: 10.1007/s13311-012-0161-6. [DOI] [PMC free article] [PubMed] [Google Scholar]
- 45.Gulati S, Shah T, Menon S, Jayasundar R, Kalra V. Magnetic resonance spectroscopy in pediatric neurology. Indian J Pediatr. 2003;70:317–325. doi: 10.1007/BF02723588. [DOI] [PubMed] [Google Scholar]
- 46.Kyriacou K, Kyriakides T. Mitochondrial encephalomyopathies: a review of routine morphological diagnostic methods with emphasis on the role of electron microscopy. J Submicrosc Cytol Pathol. 2006;38:201–208. [PubMed] [Google Scholar]
- 47.McCormick E, Place E, Falk MJ. Molecular Genetic Testing for Mitochondrial Disease: From One Generation to the Next. Neurotherapeutics. 2012 doi: 10.1007/s13311-012-0174-1. [DOI] [PMC free article] [PubMed] [Google Scholar]
- 48.Micaglio G, Ceccato MB, Trevisan C, Angelini C. Quantitative histopathology in congenital myopathies. Riv Neurol. 1987;57:261–268. [PubMed] [Google Scholar]
- 49.Mohri I, Taniike M, Fujimura H, Matsuoka T, Inui K, Nagai T, Okada S. A case of Kearns-Sayre syndrome showing a constant proportion of deleted mitochondrial DNA in blood cells during 6 years of follow-up. J Neurol Sci. 1998;158:106–109. doi: 10.1016/s0022-510x(98)00082-3. [DOI] [PubMed] [Google Scholar]
- 50.Scaglia F, Towbin JA, Craigen WJ, Belmont JW, Smith EO, Neish SR, Ware SM, et al. Clinical spectrum, morbidity, and mortality in 113 pediatric patients with mitochondrial disease. Pediatrics. 2004;114:925–931. doi: 10.1542/peds.2004-0718. [DOI] [PubMed] [Google Scholar]
- 51.Suomalainen A. Biomarkers for mitochondrial respiratory chain disorders. J Inherit Metab Dis. 2011;34:277–282. doi: 10.1007/s10545-010-9222-3. [DOI] [PubMed] [Google Scholar]
- 52.Tatke M. Mitochondrial myopathies-clinicopathological features and diagnostic modalities. Indian J Pathol Microbiol. 2007;50:467–477. [PubMed] [Google Scholar]
- 53.Vallance H. Biochemical approach to the investigation of pediatric mitochondrial disease. Pediatr Dev Pathol. 2004;7:633–636. doi: 10.1007/s10024-004-5053-2. [DOI] [PubMed] [Google Scholar]
- 54.Rahman S, Poulton J. Diagnosis of mitochondrial DNA depletion syndromes. Arch Dis Child. 2009;94:3–5. doi: 10.1136/adc.2008.147983. [DOI] [PubMed] [Google Scholar]
- 55.Lutz RE, Dimmock D, Schmitt ES, Zhang Q, Tang LY, Reyes C, Truemper E, et al. De novo mutations in POLG presenting with acute liver failure or encephalopathy. J Pediatr Gastroenterol Nutr. 2009;49:126–129. doi: 10.1097/MPG.0b013e31817d9cad. [DOI] [PubMed] [Google Scholar]
- 56.Berardo A, DiMauro S, Hirano M. A diagnostic algorithm for metabolic myopathies. Curr Neurol Neurosci Rep. 2010;10:118–126. doi: 10.1007/s11910-010-0096-4. [DOI] [PMC free article] [PubMed] [Google Scholar]
- 57.Darras BT, Friedman NR. Metabolic myopathies: a clinical approach; part I. Pediatr Neurol. 2000;22:87–97. doi: 10.1016/s0887-8994(99)00133-2. [DOI] [PubMed] [Google Scholar]
- 58.Darin N, Oldfors A, Moslemi AR, Holme E, Tulinius M. The incidence of mitochondrial encephalomyopathies in childhood: clinical features and morphological, biochemical, and DNA anbormalities. Ann Neurol. 2001;49:377–383. [PubMed] [Google Scholar]
- 59.Skladal D, Sudmeier C, Konstantopoulou V, Stockler-Ipsiroglu S, Plecko-Startinig B, Bernert G, Zeman J, et al. The clinical spectrum of mitochondrial disease in 75 pediatric patients. Clin Pediatr (Phila) 2003;42:703–710. doi: 10.1177/000992280304200806. [DOI] [PubMed] [Google Scholar]
- 60.Chinnery PF. Mitochondrial Disorders Overview. In: Pagon RA, Bird TD, Dolan CR, Stephens K, Adam MP, editors. GeneReviews. Seattle (WA): University of Washington, Seattle; 1993. updated 2010. [Google Scholar]
- 61.Haas RH, Parikh S, Falk MJ, Saneto RP, Wolf NI, Darin N, Cohen BH. Mitochondrial disease: a practical approach for primary care physicians. Pediatrics. 2007;120:1326–1333. doi: 10.1542/peds.2007-0391. [DOI] [PubMed] [Google Scholar]
- 62.Rotig A, Lebon S, Zinovieva E, Mollet J, Sarzi E, Bonnefont JP, Munnich A. Molecular diagnostics of mitochondrial disorders. Biochim Biophys Acta. 2004;1659:129–135. doi: 10.1016/j.bbabio.2004.07.007. [DOI] [PubMed] [Google Scholar]
- 63.Schaefer AM, McFarland R, Blakely EL, He L, Whittaker RG, Taylor RW, Chinnery PF, et al. Prevalence of mitochondrial DNA disease in adults. Ann Neurol. 2008;63:35–39. doi: 10.1002/ana.21217. [DOI] [PubMed] [Google Scholar]
- 64.Thorburn DR. Mitochondrial disorders: prevalence, myths and advances. J Inherit Metab Dis. 2004;27:349–362. doi: 10.1023/B:BOLI.0000031098.41409.55. [DOI] [PubMed] [Google Scholar]
- 65.Spinazzi M, Casarin A, Pertegato V, Ermani M, Salviati L, Angelini C. Optimization of respiratory chain enzymatic assays in muscle for the diagnosis of mitochondrial disorders. Mitochondrion. 2011;11:893–904. doi: 10.1016/j.mito.2011.07.006. [DOI] [PubMed] [Google Scholar]
- 66.Gellerich FN, Mayr JA, Reuter S, Sperl W, Zierz S. The problem of interlab variation in methods for mitochondrial disease diagnosis: enzymatic measurement of respiratory chain complexes. Mitochondrion. 2004;4:427–439. doi: 10.1016/j.mito.2004.07.007. [DOI] [PubMed] [Google Scholar]
- 67.Brand MD, Nicholls DG. Assessing mitochondrial dysfunction in cells. Biochem J. 2011;435:297–312. doi: 10.1042/BJ20110162. [DOI] [PMC free article] [PubMed] [Google Scholar]
- 68.Weil JA, Bolton JR, Wertz JE. Electron paramagnetic resonance: Elementary theory and applications. New York: Wiley-Interscience; 1994. p. 568. [Google Scholar]
- 69.Beinert H. EPR Spectroscopy of Components of the Mitochondrial Electron-transfer System. Methods Enzymol. 1978;49:133–150. doi: 10.1016/s0076-6879(78)54014-7. [DOI] [PubMed] [Google Scholar]
- 70.Aasa R, Albracht PJ, Falk KE, Lanne B, Vanngard T. EPR signals from cytochrome c oxidase. Biochim Biophys Acta. 1976;422:260–272. doi: 10.1016/0005-2744(76)90137-6. [DOI] [PubMed] [Google Scholar]
- 71.Fecke W, Sled VD, Ohnishi T, Weiss H. Disruption of the gene encoding the NADH-binding subunit of NADH: ubiquinone oxidoreductase in Neurospora crassa. Formation of a partially assembled enzyme without FMN and the iron-sulphur cluster N-3. Eur J Biochem. 1994;220:551–558. doi: 10.1111/j.1432-1033.1994.tb18655.x. [DOI] [PubMed] [Google Scholar]
- 72.Finel M, Majander AS, Tyynela J, De Jong AM, Albracht SP, Wikstrom M. Isolation and characterisation of subcomplexes of the mitochondrial NADH:ubiquinone oxidoreductase (complex I) Eur J Biochem. 1994;226:237–242. doi: 10.1111/j.1432-1033.1994.tb20046.x. [DOI] [PubMed] [Google Scholar]
- 73.Haddy A, Smith G. Transition metal and organic radical components of carp liver tissue observed by electron paramagnetic resonance spectroscopy. Comparative Biochemistry and Physiology Part B: Biochemistry and Molecular Biology. 1999;123:407–415. [Google Scholar]
- 74.Nakamaru-Ogiso E, Matsuno-Yagi A, Yoshikawa S, Yagi T, Ohnishi T. Iron-sulfur cluster N5 is coordinated by an HXXXCXXCXXXXXC motif in the NuoG subunit of Escherichia coli NADH:quinone oxidoreductase (complex I) J Biol Chem. 2008;283:25979–25987. doi: 10.1074/jbc.M804015200. [DOI] [PMC free article] [PubMed] [Google Scholar]
- 75.Yakovlev G, Reda T, Hirst J. Reevaluating the relationship between EPR spectra and enzyme structure for the iron sulfur clusters in NADH:quinone oxidoreductase. Proc Natl Acad Sci U S A. 2007;104:12720–12725. doi: 10.1073/pnas.0705593104. [DOI] [PMC free article] [PubMed] [Google Scholar]
- 76.Beinert H, Ackrell BA, Kearney EB, Singer TP. Iron-sulfur components of succinate dehydrogenase: stoichiometry and kinetic behavior in activated preparations. Eur J Biochem. 1975;54:185–194. doi: 10.1111/j.1432-1033.1975.tb04128.x. [DOI] [PubMed] [Google Scholar]
- 77.Salerno JC, Leigh JS. Crystal Field of Atypical Low-Spin Ferriheme Complexes. J Am Chem Soc. 1984;106:2156–2159. [Google Scholar]
- 78.Salerno JC, Ohnishi T. Studies on the stabilized ubisemiquinone species in the succinate-cytochrome c reductase segment of the intact mitochondrial membrane system. Biochem J. 1980;192:769–781. doi: 10.1042/bj1920769. [DOI] [PMC free article] [PubMed] [Google Scholar]
- 79.Kennedy MC, Antholine WE, Beinert H. An EPR investigation of the products of the reaction of cytosolic and mitochondrial aconitases with nitric oxide. J Biol Chem. 1997;272:20340–20347. doi: 10.1074/jbc.272.33.20340. [DOI] [PubMed] [Google Scholar]
- 80.Chandran K, Aggarwal D, Migrino RQ, Joseph J, McAllister D, Konorev EA, Antholine WE, et al. Doxorubicin inactivates myocardial cytochrome c oxidase in rats: cardioprotection by Mito-Q. Biophys J. 2009;96:1388–1398. doi: 10.1016/j.bpj.2008.10.042. [DOI] [PMC free article] [PubMed] [Google Scholar]
- 81.Cooper CE, Moody AJ, Rich PR, Wrigglesworth JM, Ioannidis N. The cytochrome oxidase g′=12 EPR signal. Biochem Soc Trans. 1991;19:259S. doi: 10.1042/bst019259s. [DOI] [PubMed] [Google Scholar]
- 82.Ghosh A, Chandran K, Kalivendi SV, Joseph J, Antholine WE, Hillard CJ, Kanthasamy A, et al. Neuroprotection by a mitochondria-targeted drug in a Parkinson model. Free Radic Biol Med. 2010;49:1674–1684. doi: 10.1016/j.freeradbiomed.2010.08.028. [DOI] [PMC free article] [PubMed] [Google Scholar]
- 83.Maly T, Zwicker K, Cernescu A, Brandt U, Prisner TF. New pulsed EPR methods and their application to characterize mitochondrial complex I. Biochim Biophys Acta. 2009;1787:584–592. doi: 10.1016/j.bbabio.2009.02.003. [DOI] [PubMed] [Google Scholar]
- 84.Ohnishi T, Nakamaru-Ogiso E. Were there any “misassignments” among iron-sulfur clusters N4, N5 and N6b in NADH-quinone oxidoreductase (complex I)? Biochim Biophys Acta. 2008;1777:703–710. doi: 10.1016/j.bbabio.2008.04.032. [DOI] [PMC free article] [PubMed] [Google Scholar]
- 85.Shergill JK, Weiner JH, Cammack R. Applications of pulsed EPR spectroscopy to the study of mitochondrial iron-sulphur clusters and Escherichia coli fumarate reductase. Biochem Soc Trans. 1991;19:256S. doi: 10.1042/bst019256s. [DOI] [PubMed] [Google Scholar]
- 86.Svistunenko DA, Davies N, Brealey D, Singer M, Cooper CE. Mitochondrial dysfunction in patients with severe sepsis: an EPR interrogation of individual respiratory chain components. Biochim Biophys Acta. 2006;1757:262–272. doi: 10.1016/j.bbabio.2006.03.007. [DOI] [PubMed] [Google Scholar]
- 87.Mailer C, Taylor CP. Rapid adiabatic passage EPR of ferricytochrome c: signal enhancement and determination of the spin-lattice relaxation time. Biochim Biophys Acta. 1973;322:195–203. doi: 10.1016/0005-2795(73)90293-6. [DOI] [PubMed] [Google Scholar]
- 88.Torii K, Iizuka T, Ogura Y. Magnetic susceptibility and EPR measurements of catalase and its derivatives. A thermal equilibrium between the high- and low-spin states in the catalase-azide compound. J Biochem. 1970;68:837–841. doi: 10.1093/oxfordjournals.jbchem.a129421. [DOI] [PubMed] [Google Scholar]
- 89.Yang AS, Gaffney BJ. Determination of relative spin concentration in some high-spin ferric proteins using E/D-distribution in electron paramagnetic resonance simulations. Biophys J. 1987;51:55–67. doi: 10.1016/S0006-3495(87)83311-8. [DOI] [PMC free article] [PubMed] [Google Scholar]
- 90.Rylkov VV, Tarasiev M, Moshkov KA. Labile conformation of type 2 Cu2+ centres in human ceruloplasmin. Eur J Biochem. 1991;197:185–189. doi: 10.1111/j.1432-1033.1991.tb15897.x. [DOI] [PubMed] [Google Scholar]
- 91.Ohira Y, Hegenauer J, Strause L, Chen CS, Saltman P, Beinert H. Mitochondrial NADH dehydrogenase in iron-deficient and iron-repleted rat muscle: an EPR and work performance study. Br J Haematol. 1982;52:623–630. doi: 10.1111/j.1365-2141.1982.tb03938.x. [DOI] [PubMed] [Google Scholar]
- 92.Shergill JK, Cammack R, Cooper CE, Cooper JM, Mann VM, Schapira AH. Detection of nitrosyl complexes in human substantia nigra, in relation to Parkinson’s disease. Biochem Biophys Res Commun. 1996;228:298–305. doi: 10.1006/bbrc.1996.1656. [DOI] [PubMed] [Google Scholar]
- 93.Myers CR, Antholine WE, Myers JM. The pro-oxidant chromium(VI) inhibits mitochondrial complex I, complex II, and aconitase in the bronchial epithelium: EPR markers for Fe-S proteins. Free Radic Biol Med. 2010;49:1903–1915. doi: 10.1016/j.freeradbiomed.2010.09.020. [DOI] [PMC free article] [PubMed] [Google Scholar]
- 94.Pearce LL, Martinez-Bosch S, Manzano EL, Winnica DE, Epperly MW, Peterson J. The resistance of electron-transport chain Fe-S clusters to oxidative damage during the reaction of peroxynitrite with mitochondrial complex II and rat-heart pericardium. Nitric Oxide. 2009;20:135–142. doi: 10.1016/j.niox.2008.12.001. [DOI] [PMC free article] [PubMed] [Google Scholar]
- 95.Lesnefsky EJ, Gudz TI, Migita CT, Ikeda-Saito M, Hassan MO, Turkaly PJ, Hoppel CL. Ischemic injury to mitochondrial electron transport in the aging heart: damage to the iron-sulfur protein subunit of electron transport complex III. Arch Biochem Biophys. 2001;385:117–128. doi: 10.1006/abbi.2000.2066. [DOI] [PubMed] [Google Scholar]
- 96.Brealey D, Brand M, Hargreaves I, Heales S, Land J, Smolenski R, Davies NA, et al. Association between mitochondrial dysfunction and severity and outcome of septic shock. Lancet. 2002;360:219–223. doi: 10.1016/S0140-6736(02)09459-X. [DOI] [PubMed] [Google Scholar]
- 97.Dimmock DP, Dunn JK, Feigenbaum A, Rupar A, Horvath R, Freisinger P, Mousson de Camaret B, et al. Abnormal neurological features predict poor survival and should preclude liver transplantation in patients with deoxyguanosine kinase deficiency. Liver Transpl. 2008;14:1480–1485. doi: 10.1002/lt.21556. [DOI] [PubMed] [Google Scholar]
- 98.Moraes CT, Shanske S, Tritschler HJ, Aprille JR, Andreetta F, Bonilla E, Schon EA, et al. mtDNA depletion with variable tissue expression: a novel genetic abnormality in mitochondrial diseases. American Journal of Human Genetics. 1991;48:492–501. [PMC free article] [PubMed] [Google Scholar]
- 99.Spinazzola A, Zeviani M. Disorders of nuclear-mitochondrial intergenomic signaling. Gene. 2005;354:162–168. doi: 10.1016/j.gene.2005.03.025. [DOI] [PubMed] [Google Scholar]
- 100.Sarzi E, Bourdon A, Chretien D, Zarhrate M, Corcos J, Slama A, Cormier-Daire V, et al. Mitochondrial DNA depletion is a prevalent cause of multiple respiratory chain deficiency in childhood. J Pediatr. 2007;150:531–534. 534e531–536. doi: 10.1016/j.jpeds.2007.01.044. [DOI] [PubMed] [Google Scholar]
- 101.Mazziotta MR, Ricci E, Bertini E, Vici CD, Servidei S, Burlina AB, Sabetta G, et al. Fatal infantile liver failure associated with mitochondrial DNA depletion. J Pediatr. 1992;121:896–901. doi: 10.1016/s0022-3476(05)80335-x. [DOI] [PubMed] [Google Scholar]
- 102.Morris AA, Taanman JW, Blake J, Cooper JM, Lake BD, Malone M, Love S, et al. Liver failure associated with mitochondrial DNA depletion. Journal of Hepatology. 1998;28:556–563. doi: 10.1016/s0168-8278(98)80278-x. [DOI] [PubMed] [Google Scholar]
- 103.Horvath R, Hudson G, Ferrari G, Futterer N, Ahola S, Lamantea E, Prokisch H, et al. Phenotypic spectrum associated with mutations of the mitochondrial polymerase gamma gene. Brain. 2006;129:1674–1684. doi: 10.1093/brain/awl088. [DOI] [PubMed] [Google Scholar]
- 104.McFarland R, Hudson G, Taylor RW, Green SH, Hodges S, McKiernan PJ, Chinnery PF, et al. Reversible valproate hepatotoxicity due to mutations in mitochondrial DNA polymerase gamma (POLG1) Arch Dis Child. 2008;93:151–153. doi: 10.1136/adc.2007.122911. [DOI] [PubMed] [Google Scholar]
- 105.Tzoulis C, Engelsen BA, Telstad W, Aasly J, Zeviani M, Winterthun S, Ferrari G, et al. The spectrum of clinical disease caused by the A467T and W748S POLG mutations: a study of 26 cases. Brain. 2006;129:1685–1692. doi: 10.1093/brain/awl097. [DOI] [PubMed] [Google Scholar]
- 106.Whitworth JR, Mack CL, O’Connor JA, Narkewicz MR, Mengshol S, Sokol RJ. Acute hepatitis and liver failure associated with influenza A infection in children. J Pediatr Gastroenterol Nutr. 2006;43:536–538. doi: 10.1097/01.mpg.0000232332.00677.3d. [DOI] [PubMed] [Google Scholar]
- 107.Mousson de Camaret B, Taanman JW, Padet S, Chassagne M, Mayencon M, Clerc-Renaud P, Mandon G, et al. Kinetic properties of mutant deoxyguanosine kinase in a case of reversible hepatic mtDNA depletion. Biochem J. 2007;402:377–385. doi: 10.1042/BJ20060705. [DOI] [PMC free article] [PubMed] [Google Scholar]
- 108.Dimmock DP, Zhang Q, Dionisi-Vici C, Carrozzo R, Shieh J, Tang LY, Truong C, et al. Clinical and molecular features of mitochondrial DNA depletion due to mutations in deoxyguanosine kinase. Hum Mutat. 2008;29:330–331. doi: 10.1002/humu.9519. [DOI] [PubMed] [Google Scholar]
- 109.Buchaklian AH, Helbling D, Ware SM, Dimmock DP. Recessive deoxyguanosine kinase deficiency causes juvenile onset mitochondrial myopathy. Mol Genet Metab. 2012;107:92–94. doi: 10.1016/j.ymgme.2012.04.019. [DOI] [PubMed] [Google Scholar]
- 110.Wong LJ, Dimmock D, Geraghty MT, Quan R, Lichter-Konecki U, Wang J, Brundage EK, et al. Utility of oligonucleotide array-based comparative genomic hybridization for detection of target gene deletions. Clin Chem. 2008;54:1141–1148. doi: 10.1373/clinchem.2008.103721. [DOI] [PubMed] [Google Scholar]
- 111.Lee NC, Dimmock D, Hwu WL, Tang LY, Huang WC, Chinault AC, Wong LJ. Simultaneous detection of mitochondrial DNA depletion and single-exon deletion in the deoxyguanosine gene using array-based comparative genomic hybridisation. Arch Dis Child. 2009;94:55–58. doi: 10.1136/adc.2008.139584. [DOI] [PubMed] [Google Scholar]
- 112.Dimmock D, Tang LY, Schmitt ES, Wong LJ. Quantitative evaluation of the mitochondrial DNA depletion syndrome. Clin Chem. 2010;56:1119–1127. doi: 10.1373/clinchem.2009.141549. [DOI] [PubMed] [Google Scholar]
- 113.Goh V, Helbling D, Biank V, Jarzembowski J, Dimmock D. Next-generation sequencing facilitates the diagnosis in a child with twinkle mutations causing cholestatic liver failure. J Pediatr Gastroenterol Nutr. 2012;54:291–294. doi: 10.1097/MPG.0b013e318227e53c. [DOI] [PubMed] [Google Scholar]
- 114.Venegas V, Wang J, Dimmock D, Wong LJ. Real-time quantitative PCR analysis of mitochondrial DNA content. Curr Protoc Hum Genet. 2011;Chapter 19(Unit 19):17. doi: 10.1002/0471142905.hg1907s68. [DOI] [PubMed] [Google Scholar]
- 115.Ji JQ, Dimmock D, Tang LY, Descartes M, Gomez R, Rutledge SL, Schmitt ES, et al. A novel c.592-4_c. 592-3delTT mutation in DGUOK gene causes exon skipping. Mitochondrion. 2010;10:188–191. doi: 10.1016/j.mito.2009.11.002. [DOI] [PubMed] [Google Scholar]
- 116.Collins J, Bove KE, Dimmock D, Morehart P, Wong LJ, Wong B. Progressive myofiber loss with extensive fibro-fatty replacement in a child with mitochondrial DNA depletion syndrome and novel thymidine kinase 2 gene mutations. Neuromuscul Disord. 2009;19:784–787. doi: 10.1016/j.nmd.2009.08.002. [DOI] [PubMed] [Google Scholar]
- 117.Geurts AM, Cost GJ, Freyvert Y, Zeitler B, Miller JC, Choi VM, Jenkins SS, et al. Knockout rats via embryo microinjection of zinc-finger nucleases. Science. 2009;325:433. doi: 10.1126/science.1172447. [DOI] [PMC free article] [PubMed] [Google Scholar]
- 118.Jacob HJ, Lazar J, Dwinell MR, Moreno C, Geurts AM. Gene targeting in the rat: advances and opportunities. Trends in Genetics. 2010;26:510–518. doi: 10.1016/j.tig.2010.08.006. [DOI] [PMC free article] [PubMed] [Google Scholar]
- 119.Lawlor MW, Read BP, Edelstein R, Yang N, Pierson CR, Stein MJ, Wermer-Colan A, et al. Inhibition of activin receptor type IIB increases strength and lifespan in myotubularin-deficient mice. Am J Pathol. 2011;178:784–793. doi: 10.1016/j.ajpath.2010.10.035. [DOI] [PMC free article] [PubMed] [Google Scholar]
- 120.Kendrick AA, Choudhury M, Rahman SM, McCurdy CE, Friederich M, Van Hove JL, Watson PA, et al. Fatty liver is associated with reduced SIRT3 activity and mitochondrial protein hyperacetylation. Biochem J. 2011;433:505–514. doi: 10.1042/BJ20100791. [DOI] [PMC free article] [PubMed] [Google Scholar]
- 121.Wray CD, Friederich MW, du Sart D, Pantaleo S, Smet J, Kucera C, Fenton L, et al. A new mutation in MT-ND1 m.3928G>C p.V208L causes Leigh disease with infantile spasms. Mitochondrion. 2013;13:656–661. doi: 10.1016/j.mito.2013.09.004. [DOI] [PubMed] [Google Scholar]
- 122.Smet J, De Paepe B, Seneca S, Lissens W, Kotarsky H, De Meirleir L, Fellman V, et al. Complex III staining in blue native polyacrylamide gels. J Inherit Metab Dis. 2011;34:741–747. doi: 10.1007/s10545-011-9315-7. [DOI] [PubMed] [Google Scholar]
- 123.Van Coster R, Smet J, George E, De Meirleir L, Seneca S, Van Hove J, Sebire G, et al. Blue native polyacrylamide gel electrophoresis: a powerful tool in diagnosis of oxidative phosphorylation defects. Pediatr Res. 2001;50:658–665. doi: 10.1203/00006450-200111000-00020. [DOI] [PubMed] [Google Scholar]
- 124.Smet J, Seneca S, De Paepe B, Meulemans A, Verhelst H, Leroy J, De Meirleir L, et al. Subcomplexes of mitochondrial complex V reveal mutations in mitochondrial DNA. Electrophoresis. 2009;30:3565–3572. doi: 10.1002/elps.200900213. [DOI] [PubMed] [Google Scholar]
- 125.Hanson GR, Gates KE, Noble CJ, Griffin M, Mitchell A, Benson S. XSophe-Sophe-XeprView: A Computer Simulation Suite (v.1.1.3) for the Analysis of Continuous Wave EPR Spectra. J Inorg Biochem. 2004;98:903–916. doi: 10.1016/j.jinorgbio.2004.02.003. [DOI] [PubMed] [Google Scholar]
- 126.Hanson GR, Gates KE, Noble CJ, Mitchell A, Benson S, Griffin M, Burrage K. XSophe-Sophe-XeprView: A computer simulation software suite for the analysis of continuous wave EPR spectra. In: Shiotani M, Lund A, editors. EPR of Free Radicals in Solids: Trends in Methods and Applications. Dordrecht: Kluwer Press; 2003. pp. 197–237. [Google Scholar]
- 127.Sharma A, Gaidamakova EK, Matrosova VY, Bennett B, Daly MJ, Hoffman BM. Responses of Mn2+ speciation in Deinococcus radiodurans and Escherichia coli to gamma-radiation by advanced paramagnetic resonance methods. Proc Natl Acad Sci U S A. 2013;110:5945–5950. doi: 10.1073/pnas.1303376110. [DOI] [PMC free article] [PubMed] [Google Scholar]
- 128.Mills DA, Xu S, Geren L, Hiser C, Qin L, Sharpe MA, McCracken J, et al. Proton-Dependent Electron Transfer from CuA to Heme a and Altered EPR Spectra in Mutants Close to Heme a of Cytochrome Oxidase. Biochemistry. 2008;47:11499–11509. doi: 10.1021/bi801156s. [DOI] [PMC free article] [PubMed] [Google Scholar]
- 129.Williams-Smith DL, Payne LN, Wyard SJ. Catalase depression in malignant liver from chickens with myeloblastosis and Marek’s disease. British Journal of Cancer. 1984;50:399–405. doi: 10.1038/bjc.1984.189. [DOI] [PMC free article] [PubMed] [Google Scholar]
Associated Data
This section collects any data citations, data availability statements, or supplementary materials included in this article.
Supplementary Materials
Table S1. In contrast to liver (n=5), mtDNA content in muscle tissue from 4 Wild Type (Dahl/SS) rats compared with 4 DGUOK M2 rats demonstrates no significant difference.