Abstract
Aims
To compare the gait of unicompartmental knee arthroplasty (UKA) and total knee arthroplasty (TKA) patients with healthy controls, using a machine-learning approach.
Patients and Methods
145 participants (121 healthy controls, 12 patients with cruciate-retaining TKA, and 12 with mobile-bearing medial UKA) were recruited. The TKA and UKA patients were a minimum of 12 months post-operative, and matched for pattern and severity of arthrosis, age, and body mass index.
Participants walked on an instrumented treadmill until their maximum walking speed was reached. Temporospatial gait parameters, and vertical ground reaction force data, were captured at each speed. Oxford knee scores (OKS) were also collected. An ensemble of trees algorithm was used to analyse the data: 27 gait variables were used to train classification trees for each speed, with a binary output prediction of whether these variables were derived from a UKA or TKA patient. Healthy control gait data was then tested by the decision trees at each speed and a final classification (UKA or TKA) reached for each subject in a majority voting manner over all gait cycles and speeds. Top walking speed was also recorded.
Results
92% of the healthy controls were classified by the decision tree as a UKA, 5% as a TKA, and 3% were unclassified. There was no significant difference in OKS between the UKA and TKA patients (p = 0.077). Top walking speed in TKA patients (1.6 m/s; 1.3 to 2.1) was significantly lower than that of both the UKA group (2.2 m/s; 1.8 to 2.7) and healthy controls (2.2 m/s; 1.5 to 2.7; p < 0.001).
Conclusion
UKA results in a more physiological gait compared with TKA, and a higher top walking speed. This difference in function was not detected by the OKS.
Cite this article: Bone Joint J 2016;98-B(10 Suppl B):16–21.
Keywords: Unicompartmental knee arthroplasty, Total knee arthroplasty, Gait, Patient-reported outcome measures
Total knee arthroplasty (TKA) provides substantial improvements in quality of life for people with end-stage gonarthrosis.1 However, only 75% of patients report satisfaction with the outcome,2 a figure not improved by the use of newer implant designs.3 The underlying premise of unicompartmental knee arthroplasty (UKA) is that the preservation of both cruciate ligaments, and of the remaining intact compartments of the knee, should result in more physiological knee kinematics, and hence better outcomes. However, large scale national joint registry (NJR) studies using patient reported outcome measures (PROMs) report only small differences between UKA and TKA.4-6 Given that TKA continues to account for 90% of primary knee arthroplasties performed in the United Kingdom,7 it is clear that the majority of surgeons are not persuaded by these small functional gains in the context of a higher reported rate of revision associated with UKA.8
PROMs may be unable to detect potential differences between UKA and TKA due to their inherent subjectivity and ceiling effect.9 Gait analysis is an alternative, objective metric of arthroplasty performance, and previous studies have concluded that UKA patients exhibit a more normal gait pattern than TKA patients.10-14 With the exception of one paper from our group,15 these studies are limited by a reliance on self-selected walking speeds which make comparisons between participants unreliable.16-18 Additionally, in common with most gait studies, they rely on the extraction of specific gait parameters from the large volume of data collected, thereby excluding potentially valuable information.19
Decision trees are a method of machine-learning for approximating discrete-valued functions – they are well suited to gait analysis in that they are useful for identifying regularities in large databases, they are robust to ‘noisy’ data, and have the added advantage that the resulting trees can be represented as sets of rules which are easily understood.20 We set out to train a decision tree to discriminate between the gait of matched UKA and TKA patients, using all recorded gait parameters, at multiple velocities up to their maximum walking speed. By testing this decision tree with gait data from healthy controls, we wished to test the hypothesis that due to the joint preserving nature of UKA, normal healthy controls would be more likely to be classified as UKAs than TKAs.
Patients and Methods
A total of 145 participants were included in the study, which consisted of 121 healthy controls with no history of any disorder affecting their gait, 12 patients who had undergone TKA, and 12 who had undergone medial UKA. All arthroplasty patients had undergone their procedures for isolated radiographic medial tibiofemoral compartment arthrosis, and had completed at least 12 months of post-operative follow-up. TKA patients were matched to UKA patients for age, height, body mass index (BMI), and disease severity (assessed by two authors using Ahlbäck’s classification,1 Table I).21 The UKAs were performed by one consultant surgeon (JPC), and the TKAs by another (RKS) – both surgeons perform more than 70 of these respective procedures each year. The implants used were the Oxford Phase III UKA (Zimmer Biomet, Bridgend, United Kingdom), performed using a minimally-invasive approach, and the Genesis II cruciate-retaining TKA (Smith & Nephew, London, United Kingdom). Post-operative component alignment was measured according to established methods, using digital short-knee radiographs.22 A standardised post-operative rehabilitation regime was followed for all arthroplasty patients. All participants gave written informed consent, and ethical approval for the project was granted by the National Research Ethics Service (London-Camberwell St. Giles, REC Reference: 10/H0807/101) and Imperial College Healthcare NHS Trust (R&D Reference: 11/NE/0383).
Table I.
Subject demographics. Data are displayed as means (range)
| UKA | TKA | Healthy controls | |
|---|---|---|---|
| Age (yrs) | 65 (52 to 79) | 68 (56 to 83) | 32 (18 to 81)* |
| BMI (kg/m2) | 29 (24 to 34) | 30 (24 to 39) | 24 (17 to 35)* |
| Height (cm) | 175 (167 to 184) | 167 (151 to 186) | 174 (153 to 198) |
| Ahlbäck Grade1 | 2 (1 to 3) | 2 (1 to 3) | NA |
| Oxford Knee Score | 44 (40 to 48) | 43 (40 to 48) | NA |
* Significant difference between the groups (p < 0.05) BMI, body mass index; UKA, unicompartmental knee arthroplasty; TKA, total knee arthroplasty
Gait analysis was performed according to an established protocol, using a treadmill instrumented with force plates (Kistler Gaitway, Kistler Instrument Coporation, Amherst, New York).15 After the patients familiarised themselves with the treadmill by walking at a comfortable speed for six minutes, this was increased in increments of 0.5 km/h until a maximum walking speed was reached (defined as the point at which the patient feels unsafe or would need to run if the speed was further increased).23 Temporospatial gait parameters and vertical ground reaction force data were captured for 10s at each speed, with a sampling frequency of 100 Hz. All data were adjusted for body size using the methodology described by Hof.24 Assessors were blinded to the type of operation performed. Oxford Knee Scores (OKS) were collected at the same time as gait analysis.25
A programme written in Matlab (Mathworks, Natick, Massachusetts) was used to implement an ensemble of trees (also known as a committee of trees) algorithm.26 The gait data from UKA and TKA patients were used to train classification trees for each speed (4 km/h to 7.5 km/h); a total of eight trees comprised the ensemble. The following variables were considered: speed (m/s), incline (°), maximum force time (s), maximum force (N), first and second peak time (s), first and second peak force (N), mid-support time (s), mid-support force (N), peak ratio, active force time (s), active force (N), impulse (N*s), weight acceptance rate (N/s), push-off rate (N/s), contact time (s), gait cycle time (s), cadence (1/s), step time (s), double-support time (s), single limb stance time (s), base of support (cm), mean anteroposterior centre of pressure (cm), average mediolateral centre of pressure (cm), step length (cm), and stride length (cm).
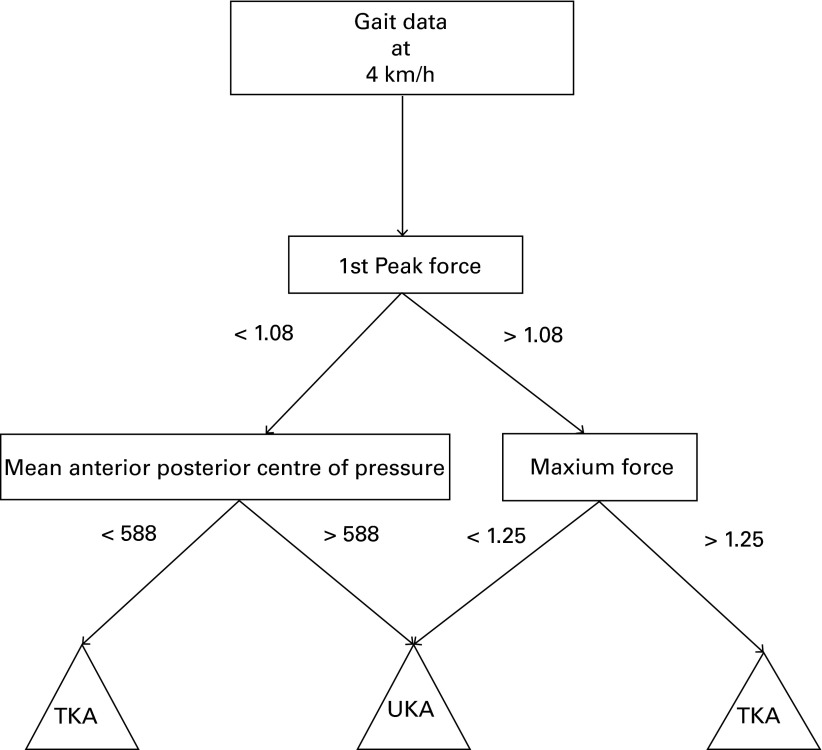
The output of the decision tree was a binary prediction of whether these variables were derived from a patient that has undergone UKA or TKA (a representative tree can be seen in Figure 1). Gait data from healthy controls were then tested by the decision tree at each speed to predict whether they were most similar to a patient with a UKA or a TKA. The final decision was reached in a majority voting manner over all gait cycles and speeds.
Fig. 1.
Decision tree at 4 km/h trained with unicompartmental and total knee arthroplasty (UKA and TKA) data to classify gait in a binary fashion. First peak force and maximum force (normalised, therefore dimensionless), and mean anteroposterior centre of pressure (cm) values were selected by the algorithm. Gait data from each healthy control at 4 km/h was then processed by this decision tree, and classified as either a UKA or TKA. This was repeated at all eight walking speeds.
Statistical analysis
This was performed with SPSS v.22 (IBM Inc., Armonk, New York). A paired t-test or one-way analysis of variance with Tukey post hoc analysis was used as appropriate. Kendall’s W was used to determine reliability of Ahlbäck grading. Statistical significance was set at a p < 0.05. Results are reported as means (range).
Results
There was no significant difference between the TKA and UKA groups for age (p = 0.509), weight (p = 0.507), height (p = 0.08), BMI (p = 0.749), OKS (p = 0.077) or Ahlbäck grade (p = 0.474). There was significant intra- (W < 0.001, p = 1.0) and inter-observer (W = 0.125, p = 0.083) agreement on Ahlbäck grading. The healthy control group was significantly younger (p < 0.001), and had a significantly lower BMI than both the arthroplasty groups (p < 0.001).
All components were well aligned radiographically:22,27 mean femoral component alignment in the TKA group was 5° (2° to 7°) in the coronal plane, and 2° (0° to 5°) in the sagittal plane, with mean tibial component alignment 89° (87° to 90°) in thecoronal plane, and 6° (3° to 8°) in the sagittal plane. In the UKA group, mean femoral component alignment was 3° (1° to 6°) in the coronal plane, and 2° (-2° to 5°) in the sagittal plane, with mean tibial component alignment 88° (86° to 90°) and 5° (3° to 7°) in thecoronal and sagittal planes, respectively.
Of the 121 healthy controls, 111 (92%) were classified by the decision tree as a UKA, six (5%) as a TKA, and four (3%) were inconclusive.
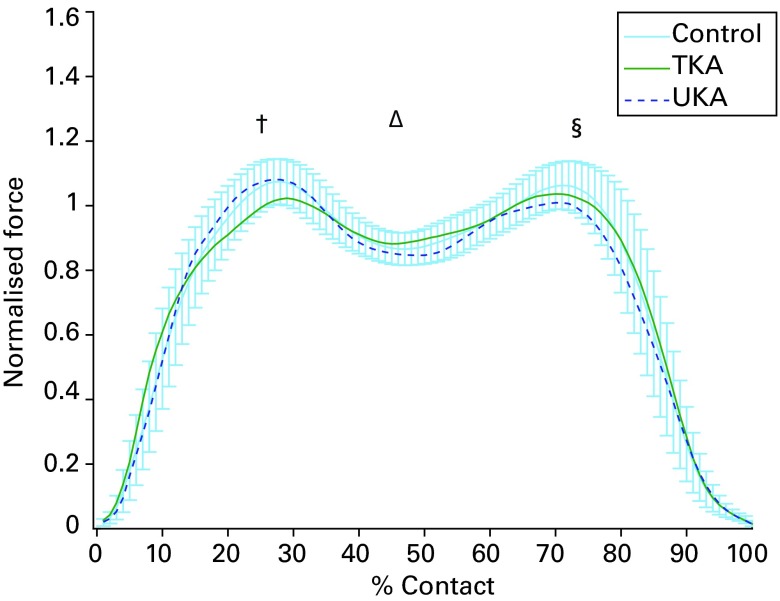
First peak force (the maximum force measured during heel strike), weight acceptance rate (the slope of the force time curve during the loading phase, measured between a point at 10% of first peak force and a point at 90% of first peak force), and maximum force time (time from initial heel contact to the time of the absolute maximum force for an individual foot strike) were commonly selected by the decision tree to discern between the two arthroplasty groups. The force time curve in Figure 2 illustrates these differences.
Fig. 2.
Graph showing mean force time curve for unicompartmental and total knee arthroplasty (UKA and TKA) and healthy controls at 4 km/h. Healthy control data are displayed with 95% confidence intervals. † represents heel strike, ∆ represents mid-stance, and § represents toe-off.
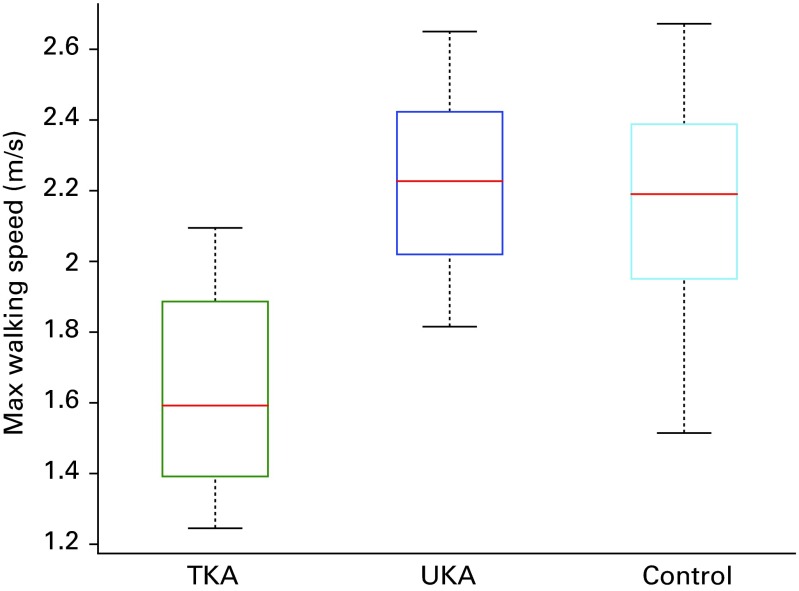
Top walking speed was 1.6 m/s (1.3 to 2.1) in patients who had received TKA, which was significantly lower than the 2.2 m/s (1.8 to 2.7) achieved by patients with UKA (p < 0.001), and the 2.2 m/s (1.5 to 2.7) achieved by the healthy controls (p < 0.001, Fig. 3).
Fig. 3.
Box-plots of top walking speeds showing median (red line), upper and lower quartiles (box), minimum and maximum values (whiskers). *Total knee arthroplasty (TKA) patients were significantly slower than unicompartmental knee arthroplasty (UKA) patients, and healthy controls (p < 0.001)
Discussion
In total, 92% of healthy controls were classified by the decision tree as a medial UKA, supporting the theory that preservation of both cruciate ligaments and the unaffected lateral tibiofemoral and patellofemoral compartments of the knee results in a more physiological gait compared with TKA. Inspection of the decision trees revealed that factors relating to initial heel strike were often used to discriminate between the two groups, with UKA patients having a faster weight acceptance rate and higher first peak force, similar to healthy controls. OKS in the UKA group were, on average, one point higher than those in the TKA group, but this difference was not statistically significant.
The strengths of this study include the use of an objective machine-learning algorithm to analyse the large volume of gait data acquired, avoiding the reporting bias normally introduced by extraction of specific gait variables for statistical testing. In reality, walking speed varies depending on the task at hand, and the use of a treadmill with integrated force-plates permits reproducible and comparable analysis of patients’ gait at different speeds,16 with gait data comparable with over-ground walking.23 The UKA and TKA patients used to train the decision trees were well matched for pattern of arthrosis, radiological disease severity, age, height and BMI, thus reducing potential selection bias.
Limitations include the lack of randomisation, although the absence of clinical equipoise in the opinion of both surgeons made this impossible. Pre-operative gait data were not collected, and would have been useful to confirm that the UKA and TKA groups walked with a similar gait prior to operative intervention. The healthy controls were significantly younger, and had a lower BMI, than the arthroplasty patients, which may have affected their categorisation by the decision tree. The results of this study only apply to the two designs of prosthesis tested. In particular, the use of a cruciate-retaining TKA may affect the gait data obtained; fluoroscopic studies have demonstrated that cruciate-retaining TKAs have a paradoxical anterior movement of the femur on the tibia during flexion, which is improved in cruciate-substituting and medial pivot designs.28-30 It is also uncertain whether an improved gait equates to higher patient satisfaction.
We used a novel machine-learning approach to analyse all recorded gait parameters, with a binary classification outcome that is easy to understand. Similar to data from NJR studies, there was only a small, one point, mean difference in OKS between the UKA and TKA groups.4-6 This is in marked contrast to the gait analysis outcome, which was overwhelmingly (93%) in favour of UKA, and which reinforces the concern that current PROMs are unable to capture the true benefits of joint preserving procedures; objective gait data may be a superior measure.
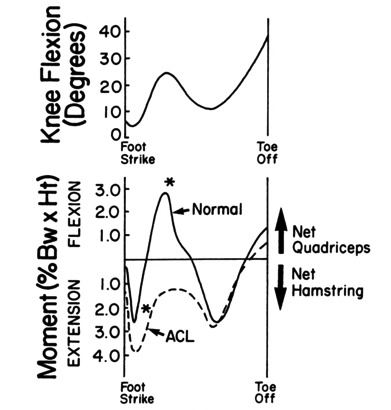
Previous gait studies comparing TKA with healthy controls11,31 consistently report loss of the normal biphasic flexion/extension moments around the knee, with an associated quadriceps avoidance gait – this is observed much less frequently in UKA.10,14 These abnormal gait features have been attributed to the anteroposterior (AP) instability induced by anterior cruciate ligament (ACL) removal.10 We found that altered loading during heel strike was often used as a discriminator between TKA and UKA, with a lower weight acceptance rate and a delayed, smaller first peak force, which mirrors the change in flexion/extension moments seen in both TKA and ACL-deficient patients (Fig. 4).31,32
Fig. 4.

During level walking by patients who had anterior cruciate (ACL) deficiency, an external extension moment about the knee persisted throughout most of the stance phase. In the presence of this moment, there is no need for activity of the quadriceps while the knee is near full extension. Normally, the necessary extension moment is produced by the quadriceps and is resisted by the anterior cruciate ligament. The asterisks identify the time during stance phase when the moments about knee of the control subjects and the patients were significantly different. Please see the original for the definitions of net quadriceps and net hamstring moments used in this study (reproduced from Berchuck et al32 with permission).
We have previously found that UKA patients walk faster than TKA patients,15 which is important because life expectancy significantly improves with every 0.1 m/s increase in top walking speed.33 The decision tree approach used in the present study did not consider top speed as a variable when discriminating between implants (spatiotemporal and kinetic gait parameters were considered at each speed separately). However, analysis of the present data set confirms that the UKA patients walked significantly faster than their TKA counterparts (Fig. 3). The paradoxical AP movement seen during flexion following TKA28,29 may account for this observation by limitation of mid-swing flexion, which impacts on stride length, and hence, walking speed.34
Compared with traditional 3D motion capture, an instrumented treadmill is a low-cost, quick and easy method of gait analysis. The results offer an objective assessment of function which is not captured using the PROMs collected by NJRs. A machine-learning approach to analysis of gait data is objective and simplifies data interpretation for clinicians. Of patients presenting with symptomatic knee arthrosis, 50% are suitable candidates for UKA.35 The current study objectively demonstrates that for the two implants tested, UKA enables patients to have more normal gait compared with TKA, and patients should be aware of this when discussing their treatment options. Future studies will use the same approach to compare functional results between different implant designs.
Take home message: Objective gait data is a valuable metric of function post-arthroplasty. When discussing UKA versus TKA, patients should be aware that UKA results in a more normal gait.
References
- 1.Carr AJ, Robertsson O, Graves S, et al. Knee replacement. Lancet 2012;379:1331–1340. [DOI] [PubMed] [Google Scholar]
- 2.Noble PC, Conditt MA, Cook KF, Mathis KB. The John Insall Award: patient expectations affect satisfaction with total knee arthroplasty. Clin Orthop Relat Res 2006;452:35–43. [DOI] [PubMed] [Google Scholar]
- 3.Nunley RM, Nam D, Berend KR, et al. New total knee arthroplasty designs: do young patients notice? Clin Orthop Relat Res 2015;473:101–108. [DOI] [PMC free article] [PubMed] [Google Scholar]
- 4.Lygre SH, Espehaug B, Havelin LI, Furnes O, Vollset SE. Pain and function in patients after primary unicompartmental and total knee arthroplasty. J Bone Joint Surg [Am] 2010;92-A:2890–2897. [DOI] [PubMed] [Google Scholar]
- 5.Liddle AD, Pandit H, Judge A, Murray DW. Patient-reported outcomes after total and unicompartmental knee arthroplasty: a study of 14,076 matched patients from the National Joint Registry for England and Wales. Bone Joint J 2015;97-B:793–801. [DOI] [PubMed] [Google Scholar]
- 6.Rothwell AG, Hooper GJ, Hobbs A, Frampton CM. An analysis of the Oxford hip and knee scores and their relationship to early joint revision in the New Zealand Joint Registry. J Bone Joint Surg [Br] 2010;92-B:413–418. [DOI] [PubMed] [Google Scholar]
- 7.No authors listed. The NJR Editorial Board. National Joint Registry. 12th Annual Report. (date last accessed 1 July 2016).
- 8.Liddle AD, Judge A, Pandit H, Murray DW. Adverse outcomes after total and unicompartmental knee replacement in 101,330 matched patients: a study of data from the National Joint Registry for England and Wales. Lancet 2014;384:1437–1445. [DOI] [PubMed] [Google Scholar]
- 9.Jenny JY, Louis P, Diesinger Y. High Activity Arthroplasty Score has a lower ceiling effect than standard scores after knee arthroplasty. J Arthroplasty 2014;29:719–721. [DOI] [PubMed] [Google Scholar]
- 10.Chassin EP, Mikosz RP, Andriacchi TP, Rosenberg AG. Functional analysis of cemented medial unicompartmental knee arthroplasty. J Arthroplasty 1996;11:553–559. [DOI] [PubMed] [Google Scholar]
- 11.McClelland JA, Webster KE, Feller JA, Menz HB. Knee kinematics during walking at different speeds in people who have undergone total knee replacement. Knee 2011;18:151–155. [DOI] [PubMed] [Google Scholar]
- 12.Banks SA, Fregly BJ, Boniforti F, Reinschmidt C, Romagnoli S. Comparing in vivo kinematics of unicondylar and bi-unicondylar knee replacements. Knee Surg Sports Traumatol Arthrosc .2005;13:551–556. [DOI] [PubMed] [Google Scholar]
- 13.Webster KE, Wittwer JE, Feller JA. Quantitative gait analysis after medial unicompartmental knee arthroplasty for osteoarthritis. J Arthroplasty 2003;18:751–759. [DOI] [PubMed] [Google Scholar]
- 14.Catani F, Benedetti MG, Bianchi L, et al. Muscle activity around the knee and gait performance in unicompartmental knee arthroplasty patients: a comparative study on fixed- and mobile-bearing designs. Knee Surg Sports Traumatol Arthrosc 2012;20:1042–1048. [DOI] [PubMed] [Google Scholar]
- 15.Wiik AV, Manning V, Strachan RK, Amis AA, Cobb JP. Unicompartmental knee arthroplasty enables near normal gait at higher speeds, unlike total knee arthroplasty. J Arthroplasty 2013;28:176–178. [DOI] [PMC free article] [PubMed] [Google Scholar]
- 16.Möckel G, Perka C, Labs K, Duda G. The influence of walking speed on kinetic and kinematic parameters in patients with osteoarthritis of the hip using a force-instrumented treadmill and standardised gait speeds. Arch Orthop Trauma Surg 2003;123:278–282. [DOI] [PubMed] [Google Scholar]
- 17.Bejek Z, Paróczai R, Illyés A, Kiss RM. The influence of walking speed on gait parameters in healthy people and in patients with osteoarthritis. Knee Surg Sports Traumatol Arthrosc 2006;14:612–622. [DOI] [PubMed] [Google Scholar]
- 18.Lee TH, Tsuchida T, Kitahara H, Moriya H. Gait analysis before and after unilateral total knee arthroplasty. Study using a linear regression model of normal controls -- women without arthropathy. J Orthop Sci 1999;4:13–21. [DOI] [PubMed] [Google Scholar]
- 19.Deluzio KJ, Wyss UP, Costigan PA, Sorbie C, Zee B. Gait assessment in unicompartmental knee arthroplasty patients: principal component modelling of gait waveforms and clinical status. Hum Mov Sci 1999;18:701–711. [Google Scholar]
- 20.Mitchell TMMachine Learning. New York: McGraw-Hill Science, 1997.
- 21.Ahlbäck S, Rydberg J. X-ray classification and examination technics in gonarthrosis. Lakartidningen 1980;77:2091–2093, 2096. (In Swedish) [PubMed] [Google Scholar]
- 22.Sarmah SS, Patel S, Hossain FS, Haddad FS. The radiological assessment of total and unicompartmental knee replacements. J Bone Joint Surg [Br] 2012;94-B:1321–1329. [DOI] [PubMed] [Google Scholar]
- 23.Matsas A, Taylor N, McBurney H. Knee joint kinematics from familiarised treadmill walking can be generalised to overground walking in young unimpaired subjects. Gait Posture 2000;11:46–53. [DOI] [PubMed] [Google Scholar]
- 24.Hof AL. Scaling gait data to body size. Gait Posture 1996;4:222–223. [Google Scholar]
- 25.Murray DW, Fitzpatrick R, Rogers K, et al. The use of the Oxford hip and knee scores. J Bone Joint Surg [Br] 2007;89-B:1010–1014. [DOI] [PubMed] [Google Scholar]
- 26.Loh WY. Classification and Regression Trees. WIREs Data Mining Knowl Discov 2011; 1:14–23. [Google Scholar]
- 27.Gromov K, Korchi M, Thomsen MG, Husted H, Troelsen A. What is the optimal alignment of the tibial and femoral components in knee arthroplasty? Acta Orthop 2014;85:480–487. [DOI] [PMC free article] [PubMed] [Google Scholar]
- 28.Stiehl JB, Komistek RD, Dennis DA, Paxson RD, Hoff WA. Fluoroscopic analysis of kinematics after posterior-cruciate-retaining knee arthroplasty. J Bone Joint Surg [Br] 1995;77-B:884–889. [PubMed] [Google Scholar]
- 29.Dennis DA, Komistek RD, Hoff WA, Gabriel SM. In Vivo Knee Kinematics Derived Using an Inverse Perspective Technique. Clin Orthop Relat Res 1996;331:107–117. [DOI] [PubMed] [Google Scholar]
- 30.Moonot P, Mu S, Railton GT, Field RE, Banks SA. Tibiofemoral kinematic analysis of knee flexion for a medial pivot knee. Knee Surg Sports Traumatol Arthrosc 2009;17:927–934. [DOI] [PubMed] [Google Scholar]
- 31.Saari T, Tranberg R, Zügner R, Uvehammer J, Kärrholm J. Changed gait pattern in patients with total knee arthroplasty but minimal influence of tibial insert design: gait analysis during level walking in 39 TKR patients and 18 healthy controls. Acta Orthop 2005;76:253–260. [DOI] [PubMed] [Google Scholar]
- 32.Berchuck M, Andriacchi TP, Bach BR, Reider B. Gait adaptations by patients who have a deficient anterior cruciate ligament. J Bone Joint Surg [Am] 1990;72-A:871–877. [PubMed] [Google Scholar]
- 33.Studenski S, Perera S, Patel K, et al. Gait speed and survival in older adults. JAMA 2011;305:50–58. [DOI] [PMC free article] [PubMed] [Google Scholar]
- 34.Kirtley C, Whittle MW, Jefferson RJ. Influence of walking speed on gait parameters. J Biomed Eng 1985;7:282–288. [DOI] [PubMed] [Google Scholar]
- 35.Willis-Owen CA, Brust K, Alsop H, Miraldo M, Cobb JP. Unicondylar knee arthroplasty in the UK National Health Service: an analysis of candidacy, outcome and cost efficacy. Knee 2009;16:473–478. [DOI] [PubMed] [Google Scholar]


