In knee MR imaging, the incidence of morphologic cartilage defects was significantly higher in cartilage with preexisting signal intensity abnormalities at baseline than that in cartilage without signal intensity abnormalities, suggesting that these signal intensity abnormalities represent early osteoarthritic cartilage changes.
Abstract
Purpose
To determine the incidence with which morphologic articular cartilage defects develop over 48 months in cartilage with signal abnormalities at baseline magnetic resonance (MR) imaging in comparison with the incidence in articular cartilage without signal abnormalities at baseline.
Materials and Methods
The institutional review boards of all participating centers approved this HIPAA-compliant study. Right knees of 90 subjects from the Osteoarthritis Initiative (mean age, 55 years ± 8 [standard deviation]; 51% women) with cartilage signal abnormalities but without morphologic cartilage defects at 3.0-T MR imaging and without radiographic osteoarthritis (Kellgren-Lawrence score, 0–1) were frequency matched for age, sex, Kellgren-Lawrence score, and body mass index with right knees in 90 subjects without any signal abnormalities or morphologic defects in the articular cartilage (mean age, 54 years ± 5; 51% women). Individual signal abnormalities (n = 126) on intermediate-weighted fast spin-echo MR images were categorized into four subgrades: subgrade A, hypointense; subgrade B, inhomogeneous; subgrade C, hyperintense; and subgrade D, hyperintense with swelling. The development of morphologic articular cartilage defects (Whole-Organ MR Imaging Score ≥2) at 48 months was analyzed on a compartment level and was compared between groups by using generalized estimating equation logistic regression models.
Results
Cartilage signal abnormalities were more frequent in the patellofemoral joint than in the tibiofemoral joint (59.5% vs 39.5%). Subgrade A was seen more frequently than were subgrades C and D (36% vs 22%). Incidence of morphologic cartilage defects at 48 months was 57% in cartilage with baseline signal abnormalities, while only 4% of compartments without baseline signal abnormalities developed morphologic defects at 48 months (all compartments combined and each compartment separately, P < .01). The development of morphologic defects was not significantly more likely in any of the subgrades (P = .98) and was significantly associated with progression of bone marrow abnormalities (P = .002).
Conclusion
Knee cartilage signal abnormalities detected with MR imaging are precursors of morphologic defects with osteoarthritis and may serve as imaging biomarkers with which to assess risk for cartilage degeneration.
© RSNA, 2016
Introduction
Osteoarthritis (OA) is the most prevalent chronic joint disease in the United States, with an increasing incidence due to the aging population and the growing number of obese individuals (1). Therapeutic options for advanced knee OA other than total joint arthroplasty remain limited; however, prevention and earlier intervention, including weight loss, improve clinical performance and may slow cartilage degeneration (2–4). Thus, early diagnosis may play an important role in patient care. Magnetic resonance (MR) imaging has gained importance in clinical routine and research settings (5), and semiquantitative scoring systems, such as Whole-Organ Magnetic Resonance Imaging Score (WORMS) (6) and MRI Osteoarthritis Knee Score (or MOAKS) (7), have been developed to grade degenerative changes. Since articular cartilage plays a central role in the development of OA (8), these scoring systems contain subscales specifically for cartilage. However, only WORMS has a specific grade for signal abnormalities in morphologically intact cartilage. WORMS grade 1 cartilage abnormalities were originally defined as “normal thickness but increased signal on T2-weighted images” (6). In more recent publications, these abnormalities have been described as “abnormal signal on fluid sensitive sequences” (9,10). This also includes hypointense signal abnormalities.
Previous studies have reported cartilage signal abnormalities inconsistently. While some studies categorized signal abnormalities without morphologic defects into the same subgroup as cartilage with normal signal (11,12), others distinctly differentiated cartilage with signal abnormalities (9,13). Analogously, uncertainty remains in the reporting of signal abnormalities in clinical routine. To our knowledge, the evolution of signal abnormalities has never been analyzed longitudinally, and the progression rate and effect of signal abnormalities on joint degeneration is unclear.
The purpose of our study was (a) to assess characteristics and regional distribution of signal intensity abnormalities in articular knee cartilage, as shown by fluid-sensitive MR imaging sequences; (b) to assess imaging characteristics that indicate the development of morphologic cartilage defects in patients with preexisting signal intensity abnormalities; (c) to analyze the association of signal intensity abnormalities with other joint abnormalities; and (d) to determine the incidence with which morphologic articular cartilage defects develop over 48 months in cartilage with signal abnormalities at baseline MR imaging in comparison with the incidence in articular cartilage without signal abnormalities at baseline.
Materials and Methods
Database and Subjects
We used data from the Osteoarthritis Initiative (OAI, oai.ucsf.edu), an ongoing longitudinal prospective multicenter cohort study. The OAI is sponsored by the U.S. National Institutes of Health, with the goal being to investigate the diagnosis, treatment, and prevention of OA. Subjects with (OAI incidence cohort) and those without (OAI control cohort) risk factors for knee OA were included in our study. Informed consent was obtained from all subjects. The study was compliant with the Health Insurance Portability and Accountability Act and was approved by the local institutional review boards of all participating centers.
Baseline and 48-month follow-up WORMS readings were available for the right knees in a sample of 744 subjects in the OAI that were preread for previous National Institutes of Health–funded studies (4,9,10,14–17). Subjects with a baseline Kellgren-Lawrence score of more than 1 in the right knee (n = 362) were excluded to focus on a population with no changes or with early degenerative changes. Further exclusion criteria were chondrocalcinosis detected with T1-weighted three-dimensional fast low-angle shot gradient-echo or three-dimensional double-echo steady-state gradient-echo MR imaging sequences (n = 6), central osteophytes at baseline (n = 9), and poor MR image quality at any time point (caused by pulsation artifacts in the popliteal artery in all cases, n = 3). Finally, 139 subjects with a morphologic cartilage defect anywhere in the knee were excluded (WORMS ≥ 2; 65 subjects with defects in only the patellofemoral joint, 29 with defects in only the tibiofemoral joint, and 45 with defects in both regions). The remaining 225 subjects were screened for the presence of one or more cartilage signal abnormalities but without morphologic articular cartilage defects anywhere in the knee (only subjects with a maximum cartilage WORMS score of 1 per compartment), and 90 subjects (mean age, 55 years ± 8 [standard deviation]; 51% women; Table 1) were identified who fulfilled these criteria. This selection was applied to minimize any possible influence of preexistent morphologic cartilage defects on previously healthy cartilage in the same or the opposing compartment. From the same sample, 90 subjects (mean age, 54 years ± 5; 51% women; Table 1) without any cartilage signal abnormality or morphologic defect at baseline (total cartilage WORMS score, 0) were frequency-matched to subjects with cartilage signal abnormalities on the basis of age, sex, baseline body mass index, baseline Kellgren-Lawrence score, OAI cohort assignment (incidence vs control), and race or ethnicity and were used as a comparison cohort (Fig 1).
Table 1.
Demographic Characteristics of Subjects with One or More Cartilage Signal Abnormality and Subjects without Any Cartilage Abnormality at Baseline

Note.—Unless otherwise indicated, data are number of subjects, and data in parentheses are percentages of subgroup.
*Data are mean ± standard deviation. Data in parentheses (if any) are the range.
†Tested for three races (white or Caucasian, black or African-American, and Asian).
Figure 1:
Flowchart shows patient selection from OAI database and basic characteristics. At baseline, subjects without cartilage signal abnormalities were frequency-matched for age, sex, body mass index, and Kellgren-Lawrence score to subjects with cartilage signal abnormalities (a).
MR Imaging and Analysis
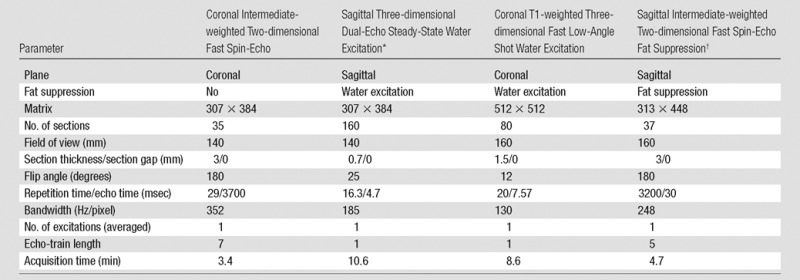
MR images were acquired by using four identical 3.0-T imagers (Siemens Trio; Siemens Healthcare, Erlangen, Germany) and quadrature transmit-receive coils (USA Instruments, Aurora, Ohio) at four sites (University of Maryland, School of Medicine, Baltimore, Md; University of Pittsburgh, Pittsburgh, Pa; Memorial Hospital of Rhode Island, Pawtucket, RI; and The Ohio State University, Columbus, Ohio). Presence and signal characteristics of cartilage signal abnormalities were assessed primarily with a sagittal intermediate-weighted fat-saturated two-dimensional fast spin-echo sequence (Table 2). A coronal intermediate-weighted two-dimensional fast spin-echo sequence and a sagittal T2-weighted three-dimensional dual-echo steady-state sequence and its axial reformations were used to assess morphologic cartilage changes and other knee joint structures. Further details about image acquisition are available in the OAI MR protocol (18).
Table 2.
Knee MR Acquisition Parameters of Sequences Assessed in Our Study according to the OAI Study Protocol
Note.—Adapted from reference 18.
*Also used for axial and coronal multiplanar reformations. Section thickness, 1.5 mm each.
†Used for assessment of articular cartilage signal abnormalities.
MR examinations were evaluated according to the modified WORMS. This semiquantitative score has been developed to assess knee joint degeneration primarily in subjects with OA and consists of eight subscales for menisci, tendons and ligaments, articular cartilage, bone marrow edema pattern, subchondral cysts, joint effusion, loose bodies, and popliteal cysts (9,15). Cartilage was graded in six regions (patella, trochlea, medial and lateral femur, and tibia) on an incremental scale from 0 to 6 (0, normal cartilage thickness and signal; 1, signal abnormalities within the cartilage; 2 or higher, morphologic defect of the cartilage ranging from partial-thickness focal defect <1 cm to diffuse [≥75% of the region] full-thickness loss). Cartilage signal abnormalities, described in WORMS as grade 1 abnormalities, were defined as signal inhomogeneities within the cartilage with a clear margin separating them from the surrounding cartilage showing otherwise homogeneous signal, unequivocally not caused by artifacts, such as chemical shift, magic angle, or pulsation caused by the popliteal artery. Areas with abnormal signal but gradual signal transition to surrounding tissue were not included because they were possibly caused by artifacts. Subjects with additional surface damage or cartilage thickness loss anywhere in the compartment (WORMS score ≥2) were excluded from analysis. Cartilage signal abnormalities were further divided according to their signal characteristics into the following four subgrades (Fig 2): subgrade A, hypointense, one or more focal signal abnormalities hypointense to the surrounding mean cartilage signal; subgrade B, inhomogeneous, cartilage area encompassing several distinct hypo- and hyperintense abnormalities next to each other; subgrade C, hyperintense, one or more focal signal abnormalities hyperintense to the surrounding mean cartilage signal; and subgrade D, hyperintense with swelling, hyperintense signal abnormality with a focal increase in cartilage thickness. The size of signal abnormalities (in cubic millimeters) was measured and calculated as follows: the largest diameter parallel to the joint surface and the diameter perpendicular to the joint surface in the same section were measured, and the product of both was multiplied, with the thickness and number of sections showing the abnormality. No compartment showed more than one signal abnormality at baseline.
Figure 2a:

Sagittal intermediate-weighted fat-saturated two-dimensional fast spin-echo MR images of the right knees in four different subjects with signal abnormalities. (a) Hypointense lesion in the medial femur (arrow). (b) Inhomogeneous lesion in the lateral trochlea consisting of both hypointense (white arrows) and hyperintense (black arrow) components next to each other. (c) Hyperintense lesion in the medial femur condyle (arrows). (d) Hyperintense lesion with swelling in the trochlea (white arrow) accompanied by bone marrow edema pattern signal in the underlying bone consisting of a small subchondral component and a more remote larger part (black arrows).
Figure 2b:
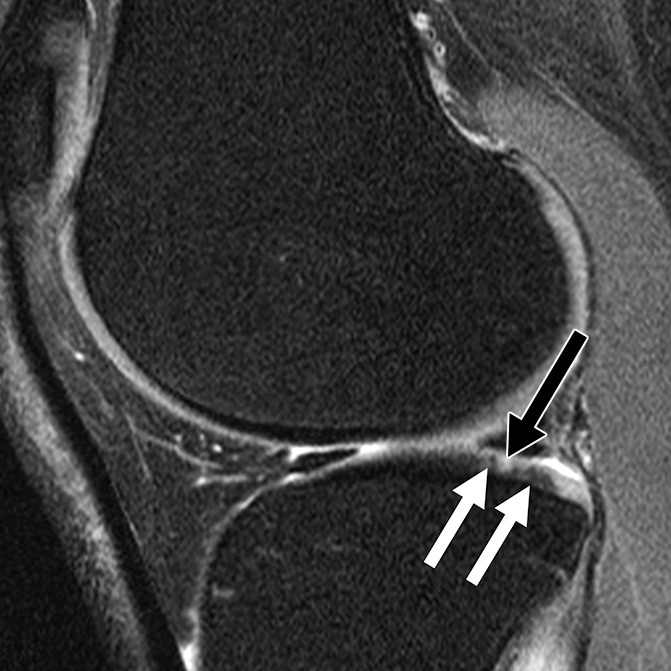
Sagittal intermediate-weighted fat-saturated two-dimensional fast spin-echo MR images of the right knees in four different subjects with signal abnormalities. (a) Hypointense lesion in the medial femur (arrow). (b) Inhomogeneous lesion in the lateral trochlea consisting of both hypointense (white arrows) and hyperintense (black arrow) components next to each other. (c) Hyperintense lesion in the medial femur condyle (arrows). (d) Hyperintense lesion with swelling in the trochlea (white arrow) accompanied by bone marrow edema pattern signal in the underlying bone consisting of a small subchondral component and a more remote larger part (black arrows).
Figure 2c:
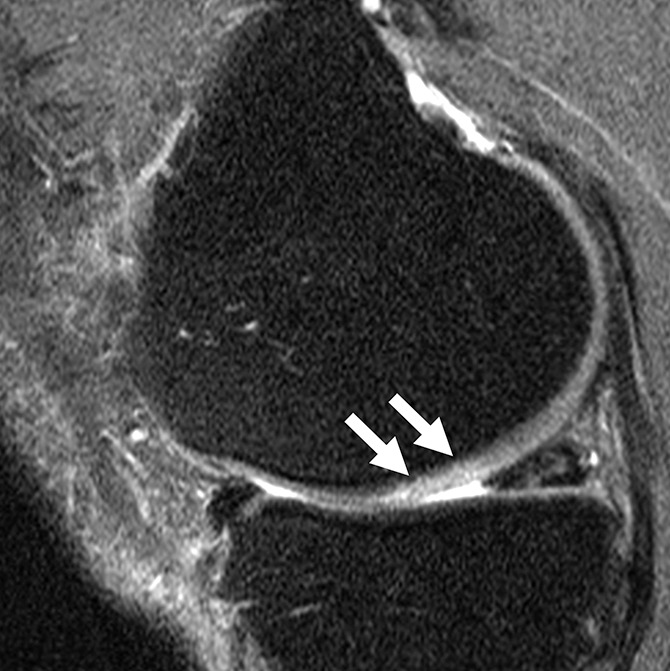
Sagittal intermediate-weighted fat-saturated two-dimensional fast spin-echo MR images of the right knees in four different subjects with signal abnormalities. (a) Hypointense lesion in the medial femur (arrow). (b) Inhomogeneous lesion in the lateral trochlea consisting of both hypointense (white arrows) and hyperintense (black arrow) components next to each other. (c) Hyperintense lesion in the medial femur condyle (arrows). (d) Hyperintense lesion with swelling in the trochlea (white arrow) accompanied by bone marrow edema pattern signal in the underlying bone consisting of a small subchondral component and a more remote larger part (black arrows).
Figure 2d:
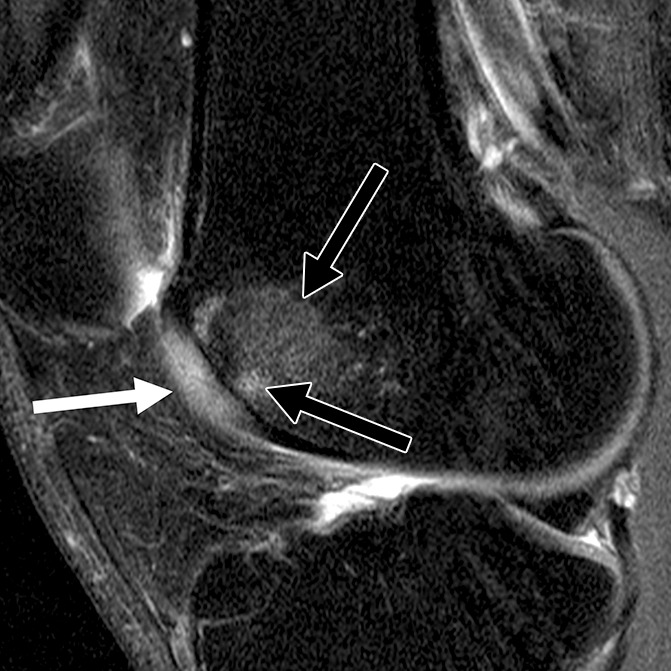
Sagittal intermediate-weighted fat-saturated two-dimensional fast spin-echo MR images of the right knees in four different subjects with signal abnormalities. (a) Hypointense lesion in the medial femur (arrow). (b) Inhomogeneous lesion in the lateral trochlea consisting of both hypointense (white arrows) and hyperintense (black arrow) components next to each other. (c) Hyperintense lesion in the medial femur condyle (arrows). (d) Hyperintense lesion with swelling in the trochlea (white arrow) accompanied by bone marrow edema pattern signal in the underlying bone consisting of a small subchondral component and a more remote larger part (black arrows).
All preread studies were individually and independently reviewed by two radiologists (A.S.G., B.J.S.; each with 4 years of experience) who also assessed signal abnormality subtypes and sizes. In case of disagreement, a consensus reading was performed with a third board-certified musculoskeletal radiologist (T.M.L., 23 years of experience). The radiologists were blinded to demographic parameters and follow-up imaging results before they evaluated baseline studies. After at least 2 weeks, readers evaluated the 48-month follow-up studies, this time with blinding to demographic parameters and baseline studies. After findings at baseline and at 48 months were recorded, radiologists were allowed to see images at the two points side by side to evaluate whether locations of morphologic cartilage defects (cartilage WORMS ≥2) and preexisting cartilage signal abnormalities were congruent.
Meniscus lesions were graded according to the WORMS subscale (0, no lesion; 1, intrasubstance abnormality; 2, nondisplaced tear; 3, displaced or complex tear; 4, maceration) in each of six regions (medial or lateral and anterior, body, or posterior). Bone marrow edema pattern (BMEP) was defined as an area of poorly marginated increase in T2 signal intensity seen on images obtained with fat-saturated sequences and graded according to the WORMS subscale (0, no BMEP; 1, BMEP diameter <5 mm; 2, BMEP diameter 5–20 mm; 3, BMEP diameter >20 mm) for each compartment. WORMS subscales for BMEP and subchondral cysts were summarized as bone marrow abnormalities.
Statistical Analysis
To compare subject characteristics, the Fisher exact test was used for categorical data, The Student t test was used for numerical data and approximately normally distributed data, and the exact Mann-Whitney U test was used for nonparametric testing. Signal abnormality characteristics and incidences of morphologic cartilage defects in patients with preexisting signal abnormalities were analyzed overall and separately by compartment. In addition to descriptive statistics for location and subtype frequencies and analysis of variance with posthoc Bonferroni testing to compare sizes of subtypes, generalized estimating equation logistic regression models adjusted for age, sex, and body mass index at baseline were used. For regional comparison, the patella and trochlea cartilage compartments were summarized as patellofemoral compartments, while all other compartments were summarized as tibiofemoral compartments.
To assess the influence of several joint abnormalities on the development of morphologic cartilage defects in patients with preexisting signal abnormalities, generalized estimating equation logistic regression was calculated, with the presence of cartilage signal abnormalities, bone marrow abnormalities, meniscus lesions (for the tibiofemoral compartments), and joint effusion and age, sex, and body mass index at baseline as predictors. For this, baseline WORMS subscales for bone marrow abnormalities, meniscal lesions, and joint effusion were dichotomized in a group with no abnormalities (WORMS = 0) and in a group with abnormalities (WORMS > 0). Analogously, changes in WORMS subscales over 48 months were dichotomized into a group with no progression (ΔWORMS = 0) and a group with progression (ΔWORMS > 0).
Intraclass correlation coefficients were calculated to assess intra- and interreader reproducibility for WORMS subscales and the subgrading of cartilage signal abnormalities.
Statistical analyses were performed with SPSS software (version 23; IBM, Armonk, NY), with two-sided P < .05 indicating a significant difference.
Results
Subjects
There were no significant differences between subjects with cartilage signal abnormalities at baseline and those without abnormalities in regard to baseline parameters (Table 1). Follow-up periods for the 48-month time point did not differ significantly between the two groups (47.7 months ± 1.1 for subjects with signal abnormalities vs 47.6 months ± 1.1 for subjects without, P = .493).
Characteristics and Localization of Cartilage Signal Abnormalities and Association with Other Abnormalities
Cartilage signal abnormalities were detected in 126 individual compartments, with no compartment showing more than one signal abnormality. Of the 90 subjects, 22 showed signal abnormalities in two compartments, four showed signal abnormalities in three compartments, and two showed signal abnormalities in four compartments. Subgrade A (hypointense, 46 of 126 [36.5%]) occurred more frequently than did subgrades C (hyperintense, n = 22 [17.5%]) and D (hyperintense with swelling, n = 6 [4.8%]) combined, whereas subgrade B (inhomogeneous) was seen in 52 (41.3%) subjects.
Cartilage signal abnormalities were seen most frequently in the cartilage of the patella (n = 44 [34.9%]), trochlea (n = 31 [24.6%]), and lateral tibia (n = 33 [26.2%]), followed by the medial femur condyle (n = 10 [7.9%]), lateral femur condyle (n = 7 [5.6%]), and medial tibia (n = 1 [0.8%]). Thus, signal abnormalities were more frequent in the patellofemoral joint than in the tibiofemoral joint (59.5% vs 40.5%).
The distribution of subgrades did not differ significantly between the patellofemoral compartment and the tibiofemoral compartment (subgrades A and B combined in the patellofemoral compartment, 61 of 75 [81%]; subgrades A and B combined in the tibiofemoral compartment, 37 of 51 [73%]; P = .320 from logistic regression models).
Subgrade A (mean, 67.0 mm3 ± 56.3) was significantly smaller than subgrades B (111.1 mm3 ± 71.0, P = .004) and D (148.0 mm3 ± 71.5, P = .020). No other significant differences in size were found between the remaining subgrades (mean size of subgrade C, 89.2 mm3 ± 47.4; P > .05).
In 37 (29.3%) of 126 compartments, cartilage signal abnormalities were accompanied by bone marrow abnormalities; in contrast, bone marrow abnormalities were found in only eight (1.5%) of 540 compartments without signal abnormalities at baseline. In a logistic regression model, adjusted odds for the presence of a bone marrow abnormality were therefore significantly higher in compartments with signal abnormalities (odds ratio, 4.8; 95% confidence interval [CI]: 2.0, 11.4; P < .001).
In 14 (27%) of the 51 tibiofemoral compartments, tears in the adjacent menisci were detected (meniscus WORMS >1). Joint effusion was found in one (1%) of the cases with signal abnormalities at baseline. Neither prevalence nor effusion of meniscus abnormalities differed significantly between compartments with signal abnormalities and those without (P > .05 for each).
Development of Morphologic Cartilage Defects in Subjects with Preexisting Signal Abnormalities
Of 126 individual cartilage signal abnormalities, 72 developed a morphologic cartilage defect at 48 months (overall, 57.1%; cartilage WORMS distribution at 48 months: 2.0, 28.6%; 2.5, 18.3%; 3, 6.3%; 4, 0%; 5, 4.0%; 6, 0%) (Figs 3, 4). The incidence in the different compartments was significantly different, with the highest rates in the femur condyles (n = 14 [82%]) and trochlea (n = 22 [71%]) and lower rates in the patella (n = 23 [52%]) and lateral tibia (n = 12 [36%]) (P = .043 for overall differences by compartment from logistic regression). Only one lesion was found in the medial tibia, and it developed into a morphologic cartilage defect. None of the signal abnormality subgrades showed a significantly higher incidence of morphologic defects compared with the other subgrades (subgrade A, 57%; subgrade B, 58%; subgrade C, 55%; subgrade D, 67%; P = .740 for overall differences by subgrade from logistic regression). In the same model, signal abnormality size was not significantly associated with the development of a morphologic defect (P = .713).
Figure 3a:

Sagittal intermediate-weighted fat-saturated two-dimensional fast spin-echo MR images of the right knee in two subjects with signal abnormalities at baseline and with focal defects after 48 months. (a) Hyperintense signal abnormality in the trochlea at baseline (arrows). (b) Development of a focal partial thickness defect in the same location as in a (white arrow) (WORMS grade 2) at 48 months. Note the adjacent hypointense area in the cartilage (black arrow), indicating further cartilage degeneration. (c) Hypointense signal abnormality of the patella at baseline (arrow). (d) Development of a fissure (arrow) (WORMS grade 2) in the same patient as in c at 48 months.
Figure 4a:
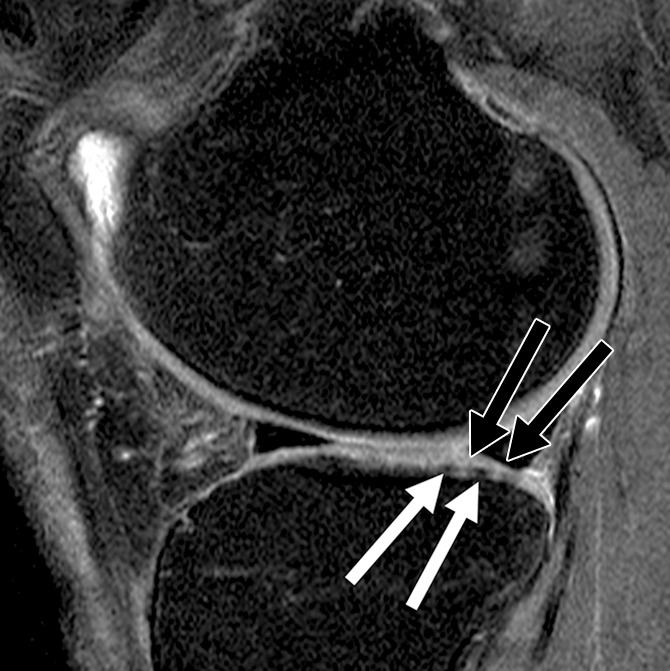
Sagittal intermediate-weighted fat-saturated two-dimensional fast spin-echo MR images of the right knee in two subjects with signal abnormalities at baseline and with focal defects after 48 months. (a) Inhomogeneous signal abnormality in the lateral tibia at baseline. Hypointense (white arrows) and hyperintense (black arrows) areas can be seen. (b) Development of a full-thickness defect in the same location as in a (arrow) (WORMS grade, 2.5) at 48 months with adjacent BMEP (arrowhead). (c) Hyperintense signal abnormality with swelling in the trochlea at baseline (arrows). (d) Development of a full-thickness defect (arrow) (WORMS grade 5) at 48 months with adjacent BMEP (arrowheads) in the same patient as in c.
Figure 3b:
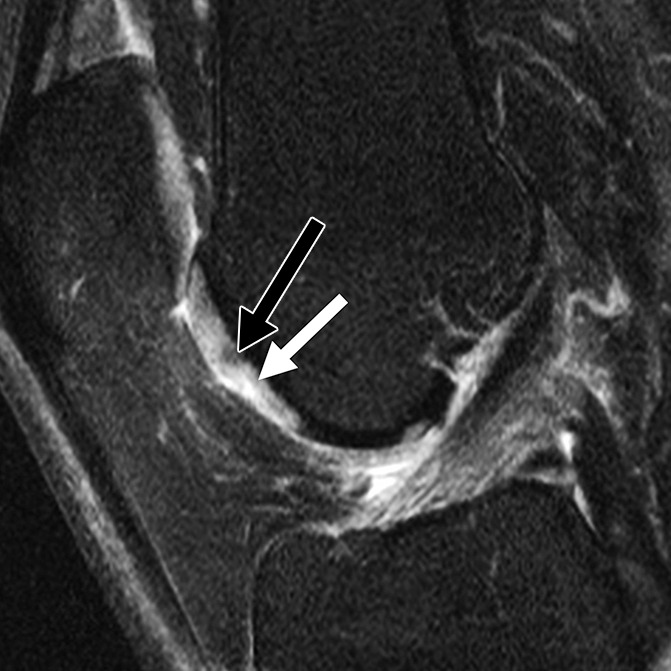
Sagittal intermediate-weighted fat-saturated two-dimensional fast spin-echo MR images of the right knee in two subjects with signal abnormalities at baseline and with focal defects after 48 months. (a) Hyperintense signal abnormality in the trochlea at baseline (arrows). (b) Development of a focal partial thickness defect in the same location as in a (white arrow) (WORMS grade 2) at 48 months. Note the adjacent hypointense area in the cartilage (black arrow), indicating further cartilage degeneration. (c) Hypointense signal abnormality of the patella at baseline (arrow). (d) Development of a fissure (arrow) (WORMS grade 2) in the same patient as in c at 48 months.
Figure 3c:
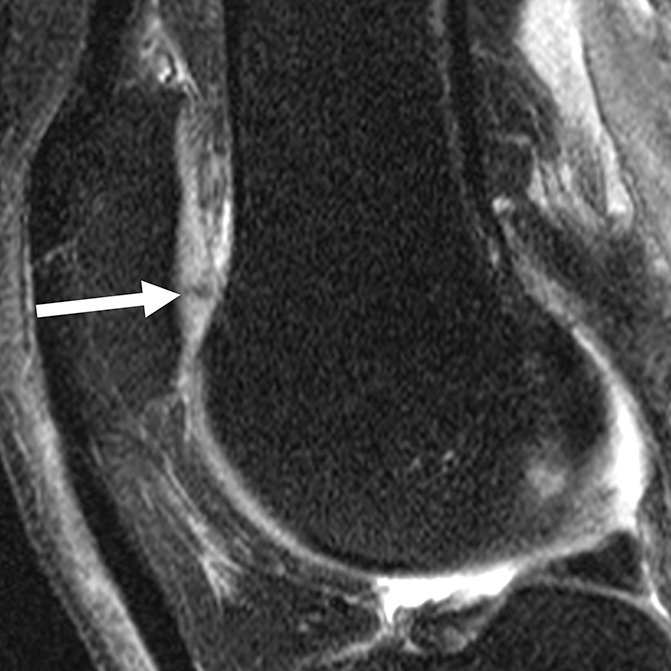
Sagittal intermediate-weighted fat-saturated two-dimensional fast spin-echo MR images of the right knee in two subjects with signal abnormalities at baseline and with focal defects after 48 months. (a) Hyperintense signal abnormality in the trochlea at baseline (arrows). (b) Development of a focal partial thickness defect in the same location as in a (white arrow) (WORMS grade 2) at 48 months. Note the adjacent hypointense area in the cartilage (black arrow), indicating further cartilage degeneration. (c) Hypointense signal abnormality of the patella at baseline (arrow). (d) Development of a fissure (arrow) (WORMS grade 2) in the same patient as in c at 48 months.
Figure 3d:
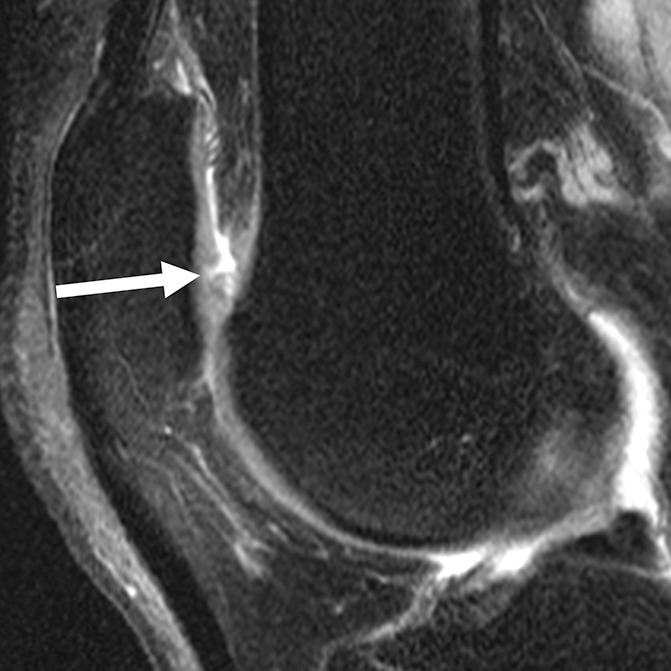
Sagittal intermediate-weighted fat-saturated two-dimensional fast spin-echo MR images of the right knee in two subjects with signal abnormalities at baseline and with focal defects after 48 months. (a) Hyperintense signal abnormality in the trochlea at baseline (arrows). (b) Development of a focal partial thickness defect in the same location as in a (white arrow) (WORMS grade 2) at 48 months. Note the adjacent hypointense area in the cartilage (black arrow), indicating further cartilage degeneration. (c) Hypointense signal abnormality of the patella at baseline (arrow). (d) Development of a fissure (arrow) (WORMS grade 2) in the same patient as in c at 48 months.
Figure 4b:
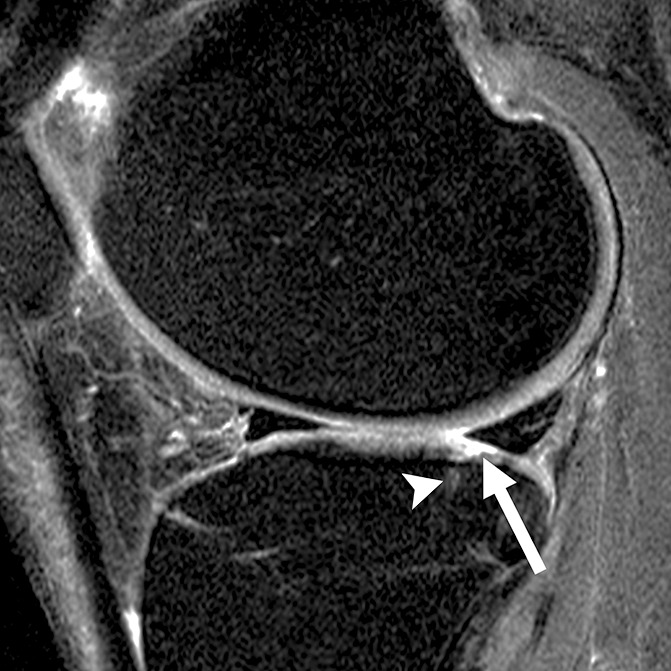
Sagittal intermediate-weighted fat-saturated two-dimensional fast spin-echo MR images of the right knee in two subjects with signal abnormalities at baseline and with focal defects after 48 months. (a) Inhomogeneous signal abnormality in the lateral tibia at baseline. Hypointense (white arrows) and hyperintense (black arrows) areas can be seen. (b) Development of a full-thickness defect in the same location as in a (arrow) (WORMS grade, 2.5) at 48 months with adjacent BMEP (arrowhead). (c) Hyperintense signal abnormality with swelling in the trochlea at baseline (arrows). (d) Development of a full-thickness defect (arrow) (WORMS grade 5) at 48 months with adjacent BMEP (arrowheads) in the same patient as in c.
Figure 4c:
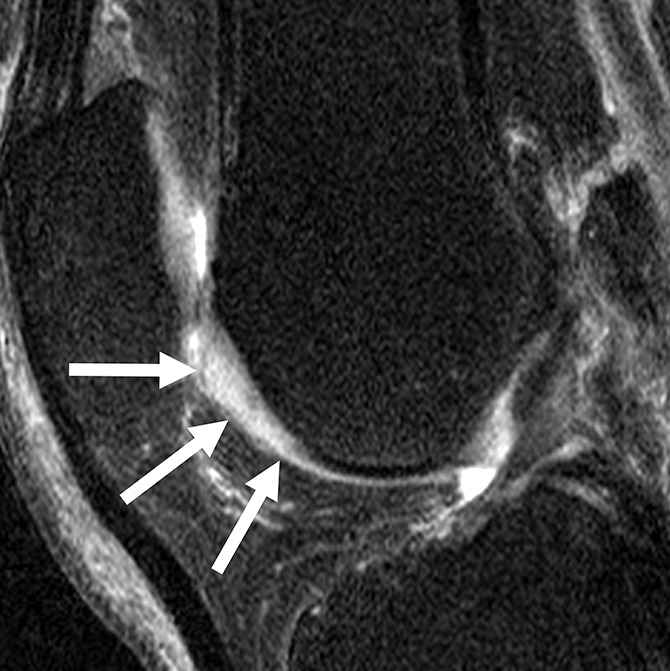
Sagittal intermediate-weighted fat-saturated two-dimensional fast spin-echo MR images of the right knee in two subjects with signal abnormalities at baseline and with focal defects after 48 months. (a) Inhomogeneous signal abnormality in the lateral tibia at baseline. Hypointense (white arrows) and hyperintense (black arrows) areas can be seen. (b) Development of a full-thickness defect in the same location as in a (arrow) (WORMS grade, 2.5) at 48 months with adjacent BMEP (arrowhead). (c) Hyperintense signal abnormality with swelling in the trochlea at baseline (arrows). (d) Development of a full-thickness defect (arrow) (WORMS grade 5) at 48 months with adjacent BMEP (arrowheads) in the same patient as in c.
Figure 4d:
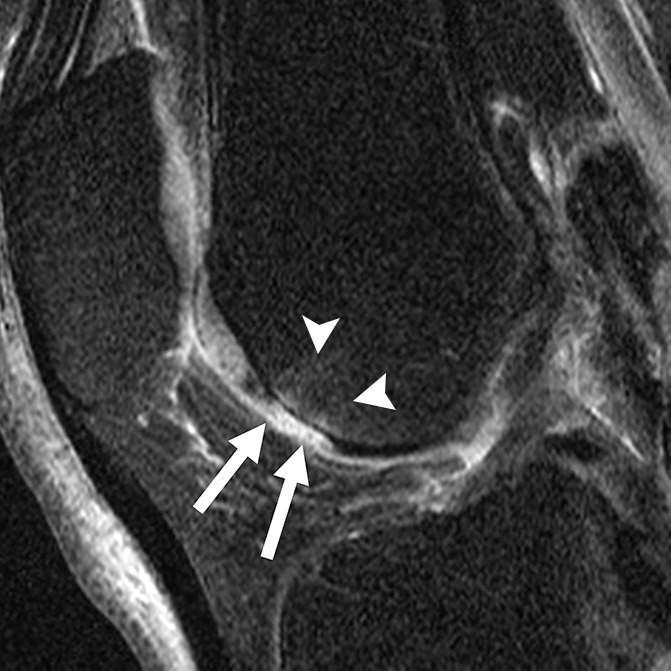
Sagittal intermediate-weighted fat-saturated two-dimensional fast spin-echo MR images of the right knee in two subjects with signal abnormalities at baseline and with focal defects after 48 months. (a) Inhomogeneous signal abnormality in the lateral tibia at baseline. Hypointense (white arrows) and hyperintense (black arrows) areas can be seen. (b) Development of a full-thickness defect in the same location as in a (arrow) (WORMS grade, 2.5) at 48 months with adjacent BMEP (arrowhead). (c) Hyperintense signal abnormality with swelling in the trochlea at baseline (arrows). (d) Development of a full-thickness defect (arrow) (WORMS grade 5) at 48 months with adjacent BMEP (arrowheads) in the same patient as in c.
In compartments with cartilage signal abnormalities that developed morphologic defects, progression of bone marrow abnormalities was significantly more frequent than in compartments with cartilage signal abnormalities that did not develop morphologic defects at 48 months (49% vs 22%, P = .002 from logistic regression). Progression rates of meniscal lesions or joint effusion did not differ significantly between compartments with signal abnormalities with subsequent development of morphologic defects versus compartments with signal abnormalities without subsequent development of morphologic defects (meniscal lesions, 8% vs 15%; P = .541 from logistic regression; joint effusion, 0% vs 6%; P = .061 with logistic regression).
Development of Morphologic Cartilage Defects in Signal Abnormalities Compared with Compartments without Preexisting Signal Abnormalities
In compartments without any cartilage signal abnormalities at baseline, incident higher grade cartilage defects (cartilage WORMS >1) were found in 23 of 540 individual cartilage compartments at 48 months (overall, 4.3%; cartilage WORMS distribution: 2.0, 2.2%; 2.5, 0.9%; 3, 0.6%; 4, 0%; 5, 0.6%; 6, 0%). In two subjects, two compartments were found with newly developed cartilage defects; however, none of the individual compartments without signal abnormalities at baseline showed multiple cartilage defects at 48 months.
The development of morphologic articular cartilage defects in subjects with signal abnormalities was therefore significantly more likely to occur in compartments without preexisting signal abnormalities than in all compartments (overall, 57.1% vs 4.3%; P < .001; odds ratio, 21.3; 95% CI: 11.1, 40.6) and in separate analysis of each compartment (P < .05 for all) (Table 3).
Table 3.
Incidence of Morphologic Articular Cartilage Defects in Preexisting Cartilage Signal Abnormalities (WORMS >1) and in Compartments without Any Preexisting Cartilage Signal Abnormalities at 48 Months

Note.—Unless otherwise indicated, data are number of compartments, and data in parentheses are percentages.
In a generalized estimating equation including all compartments both with and without cartilage signal abnormalities at baseline, the development of a morphologic cartilage defect was significantly associated with the presence of cartilage signal abnormalities (P < .001; odds ratio, 21.3; 95% CI: 11.1, 40.6)) and bone marrow abnormalities at baseline (P = .019; odds ratio, 3.7; 95% CI: 1.2, 10.9) and age (P = .018; odds ratio, 0.95; 95% CI: 0.91, 0.99). Neither meniscus abnormalities nor joint effusion showed significant association with the development of morphologic cartilage defects (P > .05 for each).
Reproducibility
Intrareader intraclass correlation coefficients (calculated by B.J.S.) were 0.83 (95% CI: 0.65, 0.92) for cartilage, 0.91 (95% CI: 0.80, 0.96) for menisci, 0.97 (95% CI: 0.94, 0.99) for BMEP, and 0.95 (95% CI: 0.90, 0.97) for subchondral cysts based on 30 randomly selected subjects. Interreader intraclass correlation coefficients (calculated by A.S.G. and B.J.S.) were 0.80 (95% CI: 0.68, 0.88) for cartilage, 0.96 (95% CI: 0.91, 0.99) for menisci, 0.90 (95% CI: 0.83, 0.94) for BMEP, and 0.91 (95% CI: 0.85, 0.95) for subchondral cysts based on all subjects used in this analysis. Intra- and interreader reproducibility of WORMS grading by our group has been validated in prior studies (10,14). For cartilage signal abnormality subgrades, intraclass correlation coefficients (calculated by B.J.S.) were 0.96 (95% CI: 0.91, 0.98) for intrareader reproducibility and 0.90 (95% CI: 0.82, 0.94) for interreader reproducibility.
Discussion
Our study showed that morphologic articular cartilage defects developed in more than half of preexisting cartilage signal abnormalities, while the incidence of morphologic defects in previously normal cartilage was less than 5%.
Signal abnormalities were more often found in the patellofemoral joint than in the tibiofemoral joint (59.5% vs 40.5%). In the tibiofemoral joint, most abnormalities were found in the lateral tibia (26.2%). Hypointense abnormalities (36.5%) were found more frequently than were hyperintense abnormalities without (17.5%) or with swelling (4.8%).
Although several longitudinal studies have been performed to assess the natural history of more severe cartilage defects in patients with OA (19,20), to our knowledge, this is the first longitudinal assessment of the evolution of cartilage signal abnormalities and their relevance for progression of joint degeneration.
While hyperintense abnormalities have been correlated with arthroscopic findings of grade 1 chondromalacia (21), to our knowledge, the precise causes of hypointense and inhomogeneous (with hypo- and hyperintense components next to each other) abnormalities have not yet been determined. Several possible mechanisms, including disruption in anisotropy, magnetization transfer effects, and deposition of fibrocartilage (22), have been suggested. Another entity within the hypointense abnormalities may represent actual fissures in deeper cartilage layers without connection to the synovial fluid and therefore without increased water content (23). Recently, those hypointense abnormalities were shown to be prevalent in all knee compartments and to correlate with arthroscopic findings in 50.0%–90.9% of cases (24). Essentially, hypointense and inhomogeneous signal abnormalities seem to represent very early morphologic cartilage abnormalities.
Bone marrow abnormalities at baseline were found in compartments with signal abnormalities significantly more often, and they were associated with the development of morphologic cartilage defects both in subjects with preexisting signal abnormalities and in compartments without signal abnormalities at baseline. This is consistent with the findings of a previous study, which showed that bone marrow abnormalities are predictors of cartilage loss (25). In a study correlating MR imaging findings with histology findings, signal changes in the subchondral bone were shown to mainly represent abnormal trabecular structure and fibrosis (26), which was later supplemented by another study identifying ingrowth of fibrovascular tissue in areas with abnormal signal (27). These histopathologic and microarchitectural changes are likely to play an important role in the pathogenesis of OA (28) and in the close interaction of the subchondral bone and articular cartilage (28,29). Our results suggest that these interrelations are relevant in a stage preceding focal cartilage defects, and they support the concept of the functional “osteochondral unit” (28,29).
Signal abnormalities were more frequent in the patellofemoral compartment than in the tibiofemoral compartment. Since it has been suggested that knee OA begins in the patellofemoral joint (30), our finding may represent an actual predominance of signal abnormalities representing early cartilage damage in the patellofemoral joint. However, this may have been due to selection bias, since the Kellgren-Lawrence score, as one of the inclusion criteria, is based on anteroposterior radiographs and may be limited in depicting changes in the patellofemoral joint (31).
Our study had other limitations. We focused on relatively healthy subjects to ensure minimal bias from other abnormalities, and this has not been part of the OAI study protocol; therefore, no histologic or arthroscopic data were available to serve as a reference standard. Since signal abnormalities have been previously shown to correspond with arthroscopy findings (ranging from softening to partial thickness defects) (21,24), the exact origin of different subtypes clearly should be investigated further in a study population in which arthroscopy or histology findings are available. Still, the good to excellent reproducibility and high incidence of morphologic cartilage defects in subjects with cartilage signal abnormalities identified at baseline indicate the validity of our readings. Moreover, the sagittal intermediate-weighted fast spin-echo sequence with an echo time of 30 msec was selected for the OAI imaging protocol since it yielded higher intrinsic contrast in the cartilage than did T2-weighted sequences (echo times of more than 60 msec) while being sufficiently fluid sensitive (18,32). Nevertheless, sequences with longer echo times (30–60 msec) and three-dimensional fast spin-echo sequences previously have been described as being best suited for the specific assessment of cartilage abnormalities (32,33). Finally, the time between baseline and follow-up readings was relatively short, which might have introduced a recall bias.
We found no further parameters besides the association with bone marrow abnormalities that would enable us to predict the development of a morphologic defect in a patient with a preexisting signal abnormality; moreover, abnormality subgrade and size were not predictive. A promising next step might be to assess compositional imaging parameters, such as T1ρ and T2, in signal abnormalities. T1ρ and T2 have been identified as valid biomarkers for early cartilage degeneration (34,35); therefore, they may enable us to predict the development of a morphologic defect in cartilage in patients with a preexisting signal abnormality.
In summary, we found that the incidence of morphologic articular cartilage defects was significantly higher in cartilage with preexisting signal abnormalities detected with MR imaging at baseline than in cartilage compartments without preexisting signal abnormalities. These results suggest that cartilage signal abnormalities represent early abnormal changes in the cartilage, which eventually may develop into morphologic defects. More signal abnormalities were found in the patellofemoral joint than in the tibiofemoral joint, and hypointense signal abnormalities were more frequent than hyperintense signal abnormalities. The development of a morphologic defect in a subject with preexisting signal abnormality was significantly associated with bone marrow abnormalities. Our findings show the importance of cartilage signal abnormalities in articular cartilage degeneration.
Advances in Knowledge
■ The development of morphologic defects in the articular cartilage of the knee over 48 months is significantly more likely if a preexisting signal intensity abnormality is detected with MR imaging in the same location at baseline compared with compartments without preexisting signal abnormalities (57% vs 4%, P < .001).
■ Cartilage signal intensity abnormalities are more common in the patellofemoral joint than in the tibiofemoral joint (59.5% vs 39.5%), and hypointense abnormalities are more common than hyperintense abnormalities (36% vs 22%).
■ The development of morphologic defects in preexisting cartilage signal intensity abnormalities is significantly associated with progression of bone marrow abnormalities (P = .002).
Implication for Patient Care
■ Since cartilage signal intensity abnormalities can be used to predict the subsequent development of morphologic articular cartilage defects that represent early degenerative changes in knee osteoarthritis, reporting them is a relevant part of the evaluation of knee joint MR imaging.
Acknowledgments
Acknowledgments
We thank the participants and staff of the Coordinating Center of the Osteoarthritis Initiative, as well as the UCSF QUIP-C group, for their invaluable assistance with patient selection, statistical analysis, and technical support.
Received October 20, 2015; revision requested December 9; revision received February 3, 2016; accepted February 24; final version accepted February 26.
The Osteoarthritis Initiative is supported by the National Institutes of Health (N01-AR-2-2258, N01-AR-2-2259, N01-AR-2-2260, N01-AR-2-2261, N01-AR-2-2262). Private funding partners include Pfizer, Novartis Pharmaceuticals, Merck Research Laboratories, and GlaxoSmithKline. Analysis was funded through the the National Institutes of Health National Institute of Arthritis and Musculoskeletal and Skin Diseases (P50-AR060752, R01-AR064771).
Disclosures of Conflicts of Interest: B.J.S. disclosed no relevant relationships. A.S.G. disclosed no relevant relationships. J.M.W. disclosed no relevant relationships. M.C.N. disclosed no relevant relationships. C.E.M. disclosed no relevant relationships. T.M.L. disclosed no relevant relationships.
Abbreviations:
- BMEP
- bone marrow edema pattern
- CI
- confidence interval
- OA
- osteoarthritis
- OAI
- Osteoarthritis Initiative
- WORMS
- Whole-Organ Magnetic Resonance Imaging Score
References
- 1.Lawrence RC, Felson DT, Helmick CG, et al. Estimates of the prevalence of arthritis and other rheumatic conditions in the United States. II. Arthritis Rheum 2008;58(1):26–35. [DOI] [PMC free article] [PubMed] [Google Scholar]
- 2.Vincent HK, Heywood K, Connelly J, Hurley RW. Obesity and weight loss in the treatment and prevention of osteoarthritis. PM R 2012;4(5 Suppl):S59–S67. [DOI] [PMC free article] [PubMed] [Google Scholar]
- 3.Wluka AE, Lombard CB, Cicuttini FM. Tackling obesity in knee osteoarthritis. Nat Rev Rheumatol 2013;9(4):225–235. [DOI] [PubMed] [Google Scholar]
- 4.Serebrakian AT, Poulos T, Liebl H, et al. Weight loss over 48 months is associated with reduced progression of cartilage T2 relaxation time values: data from the osteoarthritis initiative. J Magn Reson Imaging 2015;41(5):1272–1280. [DOI] [PMC free article] [PubMed] [Google Scholar]
- 5.Guermazi A, Roemer FW, Haugen IK, Crema MD, Hayashi D. MRI-based semiquantitative scoring of joint pathology in osteoarthritis. Nat Rev Rheumatol 2013;9(4):236–251. [DOI] [PubMed] [Google Scholar]
- 6.Peterfy CG, Guermazi A, Zaim S, et al. Whole-Organ Magnetic Resonance Imaging Score (WORMS) of the knee in osteoarthritis. Osteoarthritis Cartilage 2004;12(3):177–190. [DOI] [PubMed] [Google Scholar]
- 7.Hunter DJ, Guermazi A, Lo GH, et al. Evolution of semi-quantitative whole joint assessment of knee OA: MOAKS (MRI Osteoarthritis Knee Score). Osteoarthritis Cartilage 2011;19(8):990–1002. [DOI] [PMC free article] [PubMed] [Google Scholar]
- 8.Felson DT, Lawrence RC, Dieppe PA, et al. Osteoarthritis: new insights. 1. The disease and its risk factors. Ann Intern Med 2000;133(8):635–646. [DOI] [PubMed] [Google Scholar]
- 9.Stehling C, Lane NE, Nevitt MC, Lynch J, McCulloch CE, Link TM. Subjects with higher physical activity levels have more severe focal knee lesions diagnosed with 3T MRI: analysis of a non-symptomatic cohort of the osteoarthritis initiative. Osteoarthritis Cartilage 2010;18(6):776–786. [DOI] [PMC free article] [PubMed] [Google Scholar]
- 10.Baum T, Stehling C, Joseph GB, et al. Changes in knee cartilage T2 values over 24 months in subjects with and without risk factors for knee osteoarthritis and their association with focal knee lesions at baseline: data from the osteoarthritis initiative. J Magn Reson Imaging 2012;35(2):370–378. [DOI] [PMC free article] [PubMed] [Google Scholar]
- 11.Guermazi A, Hayashi D, Roemer FW, et al. Synovitis in knee osteoarthritis assessed by contrast-enhanced magnetic resonance imaging (MRI) is associated with radiographic tibiofemoral osteoarthritis and MRI-detected widespread cartilage damage: the MOST study. J Rheumatol 2014;41(3):501–508. [DOI] [PMC free article] [PubMed] [Google Scholar]
- 12.Roemer FW, Kwoh CK, Hannon MJ, et al. Semiquantitative assessment of focal cartilage damage at 3T MRI: a comparative study of dual echo at steady state (DESS) and intermediate-weighted (IW) fat suppressed fast spin echo sequences. Eur J Radiol 2011;80(2):e126–e131. [DOI] [PubMed] [Google Scholar]
- 13.Crema MD, Nevitt MC, Guermazi A, et al. Progression of cartilage damage and meniscal pathology over 30 months is associated with an increase in radiographic tibiofemoral joint space narrowing in persons with knee OA: the MOST study. Osteoarthritis Cartilage 2014;22(10):1743–1747. [DOI] [PMC free article] [PubMed] [Google Scholar]
- 14.Pan J, Stehling C, Muller-Hocker C, et al. Vastus lateralis/vastus medialis cross-sectional area ratio impacts presence and degree of knee joint abnormalities and cartilage T2 determined with 3T MRI: an analysis from the incidence cohort of the Osteoarthritis Initiative. Osteoarthritis Cartilage 2011;19(1):65–73. [DOI] [PMC free article] [PubMed] [Google Scholar]
- 15.Stehling C, Liebl H, Krug R, et al. Patellar cartilage: T2 values and morphologic abnormalities at 3.0-T MR imaging in relation to physical activity in asymptomatic subjects from the osteoarthritis initiative. Radiology 2010;254(2):509–520. [DOI] [PMC free article] [PubMed] [Google Scholar]
- 16.Joseph GB, McCulloch CE, Nevitt MC, et al. A reference database of cartilage 3 T MRI T2 values in knees without diagnostic evidence of cartilage degeneration: data from the osteoarthritis initiative. Osteoarthritis Cartilage 2015;23(6):897–905. [DOI] [PMC free article] [PubMed] [Google Scholar]
- 17.Jungmann PM, Kraus MS, Alizai H, et al. Association of metabolic risk factors with cartilage degradation assessed by T2 relaxation time at the knee: data from the osteoarthritis initiative. Arthritis Care Res (Hoboken) 2013;65(12):1942–1950. [DOI] [PMC free article] [PubMed] [Google Scholar]
- 18.Peterfy CG, Schneider E, Nevitt M. The osteoarthritis initiative: report on the design rationale for the magnetic resonance imaging protocol for the knee. Osteoarthritis Cartilage 2008;16(12):1433–1441. [DOI] [PMC free article] [PubMed] [Google Scholar]
- 19.Carnes J, Stannus O, Cicuttini F, Ding C, Jones G. Knee cartilage defects in a sample of older adults: natural history, clinical significance and factors influencing change over 2.9 years. Osteoarthritis Cartilage 2012;20(12):1541–1547. [DOI] [PubMed] [Google Scholar]
- 20.Cibere J, Sayre EC, Guermazi A, et al. Natural history of cartilage damage and osteoarthritis progression on magnetic resonance imaging in a population-based cohort with knee pain. Osteoarthritis Cartilage 2011;19(6):683–688. [DOI] [PubMed] [Google Scholar]
- 21.Bredella MA, Tirman PF, Peterfy CG, et al. Accuracy of T2-weighted fast spin-echo MR imaging with fat saturation in detecting cartilage defects in the knee: comparison with arthroscopy in 130 patients. AJR Am J Roentgenol 1999;172(4):1073–1080. [DOI] [PubMed] [Google Scholar]
- 22.Markhardt BK, Chang EY. Hypointense signal lesions of the articular cartilage: a review of current concepts. Clin Imaging 2014;38(6):785–791. [DOI] [PubMed] [Google Scholar]
- 23.Wissman RD, Ingalls J, Nepute J, et al. The trochlear cleft: the “black line” of the trochlear trough. Skeletal Radiol 2012;41(9):1121–1126. [DOI] [PubMed] [Google Scholar]
- 24.Markhardt BK, Kijowski R. The clinical significance of dark cartilage lesions identified on MRI. AJR Am J Roentgenol 2015;205(6):1251–1259. [DOI] [PubMed] [Google Scholar]
- 25.Roemer FW, Guermazi A, Javaid MK, et al. Change in MRI-detected subchondral bone marrow lesions is associated with cartilage loss: the MOST Study. a longitudinal multicentre study of knee osteoarthritis. Ann Rheum Dis 2009;68(9):1461–1465. [DOI] [PMC free article] [PubMed] [Google Scholar]
- 26.Zanetti M, Bruder E, Romero J, Hodler J. Bone marrow edema pattern in osteoarthritic knees: correlation between MR imaging and histologic findings. Radiology 2000;215(3):835–840. [DOI] [PubMed] [Google Scholar]
- 27.Saadat E, Jobke B, Chu B, et al. Diagnostic performance of in vivo 3-T MRI for articular cartilage abnormalities in human osteoarthritic knees using histology as standard of reference. Eur Radiol 2008;18(10):2292–2302. [DOI] [PMC free article] [PubMed] [Google Scholar]
- 28.Li G, Yin J, Gao J, et al. Subchondral bone in osteoarthritis: insight into risk factors and microstructural changes. Arthritis Res Ther 2013;15(6):223. [DOI] [PMC free article] [PubMed] [Google Scholar]
- 29.Suri S, Walsh DA. Osteochondral alterations in osteoarthritis. Bone 2012;51(2):204–211. [DOI] [PubMed] [Google Scholar]
- 30.Duncan R, Peat G, Thomas E, Hay EM, Croft P. Incidence, progression and sequence of development of radiographic knee osteoarthritis in a symptomatic population. Ann Rheum Dis 2011;70(11):1944–1948. [DOI] [PubMed] [Google Scholar]
- 31.Duncan RC, Hay EM, Saklatvala J, Croft PR. Prevalence of radiographic osteoarthritis: it all depends on your point of view. Rheumatology (Oxford) 2006;45(6):757–760. [DOI] [PubMed] [Google Scholar]
- 32.Roemer FW, Crema MD, Trattnig S, Guermazi A. Advances in imaging of osteoarthritis and cartilage. Radiology 2011;260(2):332–354. [DOI] [PubMed] [Google Scholar]
- 33.Link TM. MR imaging in osteoarthritis: hardware, coils, and sequences. Radiol Clin North Am 2009;47(4):617–632. [DOI] [PubMed] [Google Scholar]
- 34.Mosher TJ, Walker EA, Petscavage-Thomas J, Guermazi A. Osteoarthritis year 2013 in review: imaging. Osteoarthritis Cartilage 2013;21(10):1425–1435. [DOI] [PubMed] [Google Scholar]
- 35.Link TM, Stahl R, Woertler K. Cartilage imaging: motivation, techniques, current and future significance. Eur Radiol 2007;17(5):1135–1146. [DOI] [PubMed] [Google Scholar]


