Significance
Understanding how hormones like auxin control plant growth and development has fascinated scientists since Darwin. The past two decades have seen breakthroughs in elucidating the molecular basis of auxin transport, perception, and response, but little is known about how auxin is metabolized or its homeostasis is controlled. We report that the DIOXYGENASE FOR AUXIN OXIDATION 1 (AtDAO1) enzyme represents the major pathway for auxin oxidation in Arabidopsis. Disrupting AtDAO1 function elevates levels of auxin conjugates between ∼50- and 280-fold, but auxin levels remain close to the WT, helping explain why mutant phenotypes are relatively weak. We conclude that AtDAO1 and auxin conjugation pathways play highly redundant roles and reveal a level of regulation of auxin abundance in plants.
Keywords: Arabidopsis thaliana, IAA degradation, oxidase, dioxygenase, root hair elongation
Abstract
Auxin represents a key signal in plants, regulating almost every aspect of their growth and development. Major breakthroughs have been made dissecting the molecular basis of auxin transport, perception, and response. In contrast, how plants control the metabolism and homeostasis of the major form of auxin in plants, indole-3-acetic acid (IAA), remains unclear. In this paper, we initially describe the function of the Arabidopsis thaliana gene DIOXYGENASE FOR AUXIN OXIDATION 1 (AtDAO1). Transcriptional and translational reporter lines revealed that AtDAO1 encodes a highly root-expressed, cytoplasmically localized IAA oxidase. Stable isotope-labeled IAA feeding studies of loss and gain of function AtDAO1 lines showed that this oxidase represents the major regulator of auxin degradation to 2-oxoindole-3-acetic acid (oxIAA) in Arabidopsis. Surprisingly, AtDAO1 loss and gain of function lines exhibited relatively subtle auxin-related phenotypes, such as altered root hair length. Metabolite profiling of mutant lines revealed that disrupting AtDAO1 regulation resulted in major changes in steady-state levels of oxIAA and IAA conjugates but not IAA. Hence, IAA conjugation and catabolism seem to regulate auxin levels in Arabidopsis in a highly redundant manner. We observed that transcripts of AtDOA1 IAA oxidase and GH3 IAA-conjugating enzymes are auxin-inducible, providing a molecular basis for their observed functional redundancy. We conclude that the AtDAO1 gene plays a key role regulating auxin homeostasis in Arabidopsis, acting in concert with GH3 genes, to maintain auxin concentration at optimal levels for plant growth and development.
Distinct indole-3-acetic acid (IAA) conjugation and degradation pathways operate to maintain optimal auxin concentrations for plant growth and developmental processes. There are three major forms of auxin conjugates identified in diverse plants: ester-linked IAA-sugar conjugates, amide-linked IAA-amino acid conjugates, and amide-linked IAA peptide and protein conjugates (reviewed in ref. 1). In Arabidopsis thaliana, Group II of the Gretchen Hagen3 (GH3) family of auxin-inducible acyl amido synthetases converts IAA to IAA-amino acids (2, 3). Most amino acid IAA conjugates are believed to be inactive; however, there are enzymes that can hydrolyze some of the IAA-amino acid conjugates to free IAA (reviewed in ref. 1). Some of the IAA-amino acid conjugates, such as indole-3-acetic acid aspartic acid (IAA-Asp) and indole-3-acetic acid glutamic acid (IAA-Glu), can also be further metabolized (4–6). The conversion of IAA to indole-3-acetic acid glucose (IAA-glc) is catalyzed by the UDP glucosyltransferase UGT84B1 (7).
The major IAA catabolite in Arabidopsis is 2-oxoindole-3-acetic acid (oxIAA), the oxidized form of IAA (4, 6, 8). oxIAA can be further metabolized by conjugation to glucose (4, 5), and it was recently shown that the UDP glucosyltransferase UGT74D1 is able to catalyze the glucosylation of oxIAA to 2-oxoindole-3-acetic acid glucose (oxIAA-glc) (9). IAA catabolism has been shown to be an irreversible step (4, 10), and the oxIAA product has very little biological activity and is not transported via the polar auxin transport system (6, 8).
Although many metabolites in the conjugation and catabolic pathways have been identified in Arabidopsis (4–7, 9–11), it has proved difficult to identify and characterize the genes and enzymes involved. We have now identified two closely related components of the IAA degradation machinery in Arabidopsis, DIOXYGENASE FOR AUXIN OXIDATION 1 (AtDAO1; At1g14130) and AtDAO2 (At1g14120), which are closely related to genes described in apple [Adventitious Rooting Related Oxygenase 1 (12)] and rice [DAO (13)]. The AtDAO1 and AtDAO2 genes belong to a distinct clade of the 2-oxoglutarate–dependent dioxygenase gene family and are related to enzymes involved in gibberellin biosynthesis and inactivation. We report that the AtDAO1 gene plays a key role regulating auxin homeostasis in Arabidopsis, acting in concert with GH3 genes to maintain auxin concentration at optimal levels for plant growth and development. As a result, plants lacking AtDAO1 activity led to major changes in conjugated forms of the hormone, but auxin level remains within a normal range, helping explain why the mutant exhibited subtle phenotypic changes. We conclude that IAA catabolism and conjugation regulate auxin homeostasis in Arabidopsis in a highly redundant manner.
Results
IAA Oxidation in Arabidopsis Is Controlled by the Dioxygenase Gene AtDAO1.
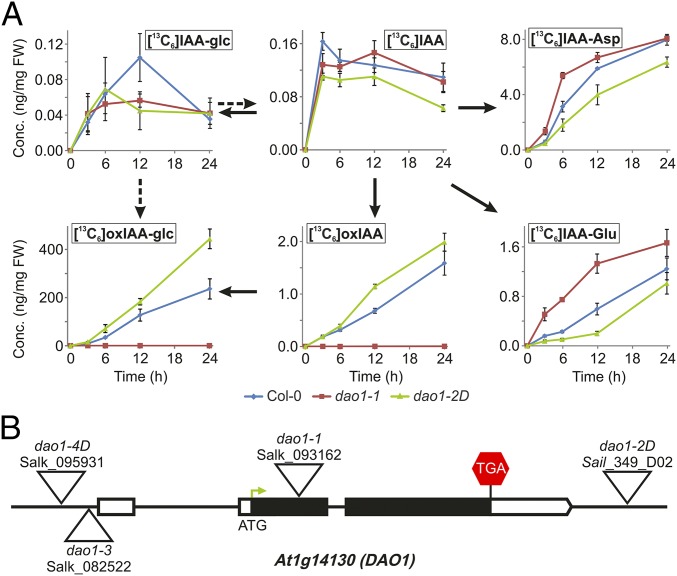
To study the in vivo formation of IAA metabolites, a feeding experiment was performed using [13C6]IAA with WT Arabidopsis seedlings. We observed rapid labeling of the pools of the major IAA conjugates IAA-Asp, IAA-Glu, and IAA-glc as well as the catabolites oxIAA and oxIAA-glc within 3 h after treatment began, revealing that IAA is rapidly turned over in Arabidopsis seedlings (Fig. 1A).
Fig. 1.
IAA oxidation in Arabidopsis is regulated by the dioxygenase gene family member At1g14130 (AtDAO1). (A) IAA feeding experiment. Formation of labeled IAA conjugates and catabolites after incubation of 7-d-old Arabidopsis Col-0, dao1-1, and dao1-2D seedlings with [13C6]IAA. Samples were analyzed in three independent biological replicates. Error bars represent SD. FW, fresh weight. (B) Structure of the Arabidopsis DAO1 gene with indication of the position of the T-DNA insertions (triangles) in the different dao1 alleles studied.
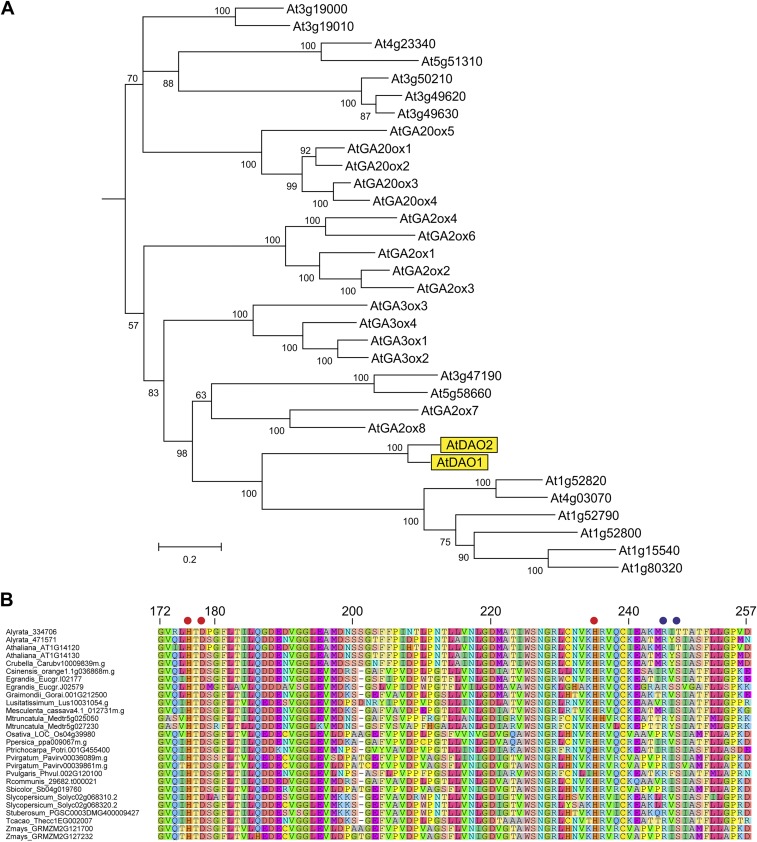
A rice DAO1 gene that encodes a 2-oxoglutarate–dependent Fe (II) dioxygenase-like enzyme has recently been reported to mediate IAA oxidation (13). Phylogenetic analyses revealed that the Arabidopsis genome contains two genes related to OsDAO1 termed At1g14130 (AtDAO1) and At1g14120 (AtDAO2). AtDAO1 and AtDAO2 belong to the 2-oxoglutarate–dependent Fe (II) dioxygenase gene family, and their sequences are related to enzymes involved in gibberellin biosynthesis and inactivation (Fig. S1A). A BLAST search of the sequenced plant genomes at Phytozome (https://phytozome.jgi.doe.gov/pz/portal.html) identified sequences closely related to AtDAO1 and AtDAO2 in a range of species, with amino acid identities ranging from 47 to 93% (Fig. S1B).
Fig. S1.
Phylogenetic relationships between AtDAOs and related proteins. (A) Phylogenetic tree of the AtDAO1 and AtDAO2 and related Arabidopsis proteins. Arabidopsis 2-ODD sequences were aligned using MUSCLE within Geneious and trimmed to remove unaligned residues. Phylogenetic analysis was carried out using PhyML and MrBayes within ToPALI (www.topali.org/). A section of the MrBayes tree was selected and displayed in MEGA6. Numbers show branch support values; the scale bar shows substitutions per site. (B) Sequence alignment of the active site region of AtDAOs and related proteins from various plant species identified at https://phytozome.jgi.doe.gov/pz/portal.html. Sequences were aligned using MUSCLE. The Fe binding residues are indicated with red dots, and the 2-oxoglutarate binding residues are indicated with blue dots. Residue numbering is from the AtDAO1 (At1g14130) sequence.
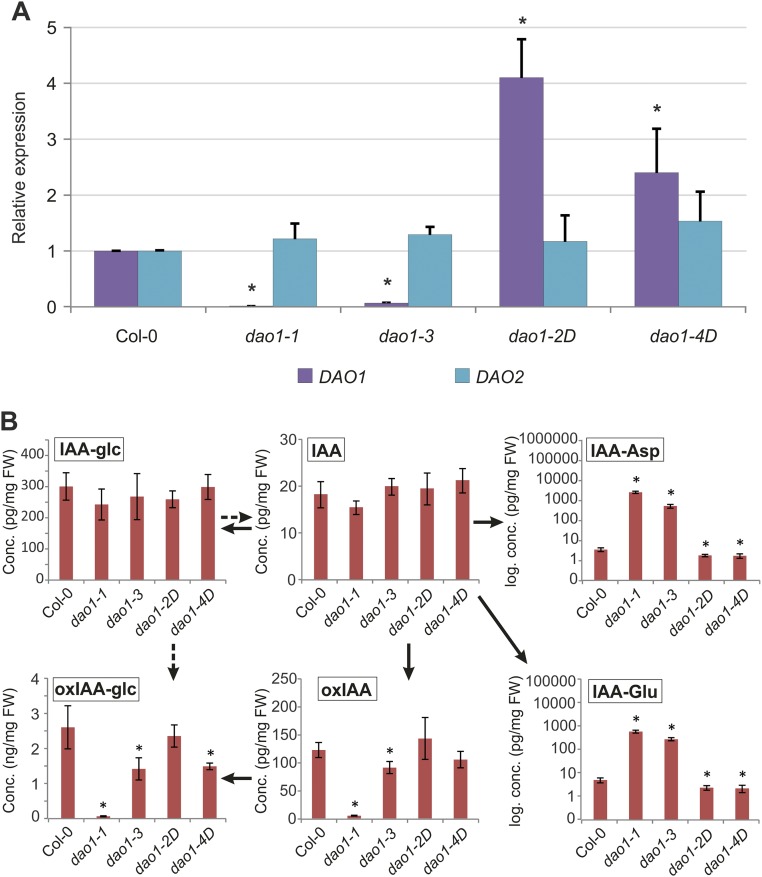
To address the putative IAA oxidative role of AtDAO1 in Arabidopsis, we identified several Transfer-DNA (T-DNA) insertion lines (Fig. 1B). The T-DNA for the Salk_093162 line (dao1-1) is inserted in the first exon of At1g14130 311 bp downstream of the start codon. Sail line 349_D02 (dao1-2D) has a T-DNA insertion in the intergenic region between the AtDAO1 and AtDAO2 genomic sequences 542 bp upstream of the AtDAO2 start codon. T-DNA insertions in Salk_082522 (dao1-3) and Salk_095931 (dao1-4D) lines are positioned upstream of the start codon of AtDAO1 (591 and 789 bp, respectively). Quantitative RT-PCR (qRT-PCR) was performed to measure transcript levels of DAO1 and DAO2 in the T-DNA lines (Fig. S2A). DAO1 mRNA was strongly reduced in dao1-1 and dao1-3 lines, suggesting that they represent loss of function lines. In contrast, for dao1-2D and dao1-4D lines, AtDAO1 mRNA abundances were 4- and 2.4-fold higher than the WT, respectively, suggesting that they represent AtDAO1 overexpressing lines. No significant changes were detected in the expression level of DAO2 in any of these lines compared with in the WT (Fig. S2A).
Fig. S2.
(A) AtDAO1 and AtDAO2 transcript abundance in the different dao1 alleles studied in this work relative to Col-0. qRT-PCR analysis was performed using cDNA from 7-d-old roots. Fold change was calculated by comparative Cycle threshold (Ct) method, and values were normalized with the expression of the ACT2 gene. Error bars indicate SDs from three biological replicates. *Expression values significantly different from those in Col-0 (Student’s t test; P < 0.05). (B) Levels of IAA metabolites in the different dao1 alleles. IAA and the metabolites oxIAA, oxIAA-glc, IAA-glc, IAA-Asp, and IAA-Glu were quantified in 7-d-old seedlings of Col-0, dao1-1, dao1-3, dao1-2D, and dao1-4D. The concentrations for all metabolites except oxIAA-glc [nanograms per milligram fresh weight (FW)] are given in picograms per milligram FW. Samples were analyzed in five independent biological replicates, and error bars represent the SDs. *Statistically significant differences from Col-0 (P < 0.05; Student’s t test).
The [13C6]IAA feeding experiments were also performed using seedlings from dao1-1 (AtDAO1 mutant) and dao1-2D (AtDAO1 overexpressing) lines, revealing that (unlike the WT and dao1-2D) dao1-1 seedlings failed to oxidize [13C6]IAA to [13C6]oxIAA (Fig. 1A). Formation of [13C6]oxIAA-glc was also abolished in the dao1-1 mutant line. Instead, 13C-labeled IAA was converted to IAA conjugates ([13C6]IAA-Asp and [13C6]IAA-Glu) at a higher rate than in WT seedlings. Conversely, the dao1-2D line oxidized [13C6]IAA to [13C6]oxIAA and [13C6]oxIAA-glc more rapidly than the WT, and the [13C6]IAA conjugate levels were diminished in this line. Labeling of IAA-glc is similar in all lines, suggesting that the formation of this conjugate is not altered in AtDAO1 mutant and overexpressing lines (Fig. 1A). Hence, our [13C6]IAA feeding experiments revealed that AtDAO1 plays an essential role regulating IAA oxidation in Arabidopsis seedlings.
Mutants Disrupting AtDAO1 Activity Exhibit Subtle Changes in Shoot and Root Phenotypes.
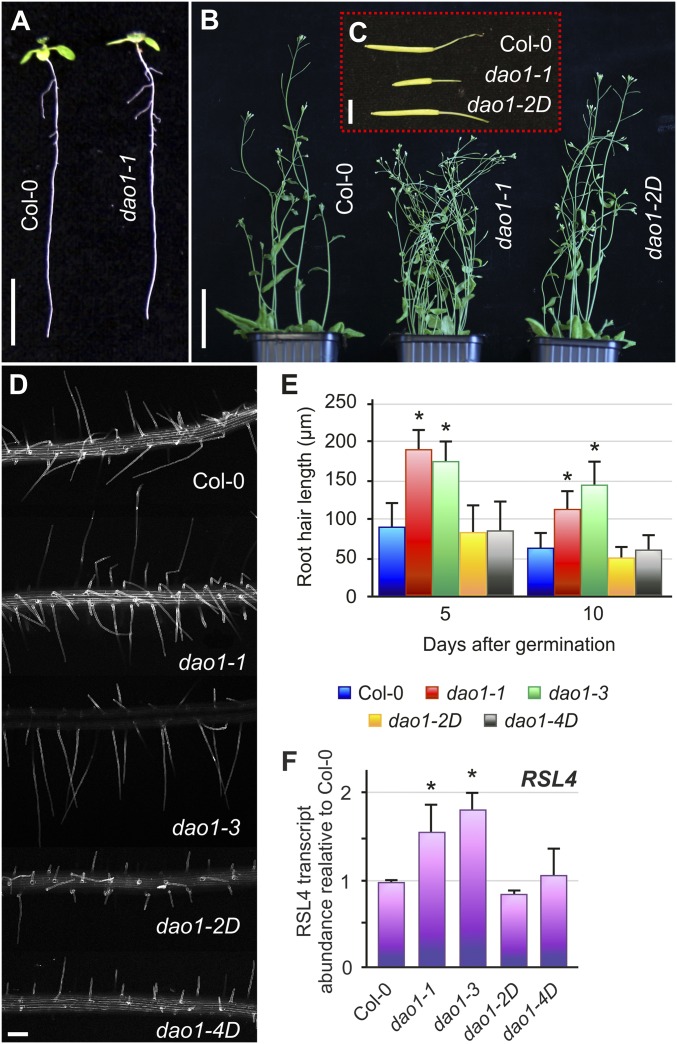
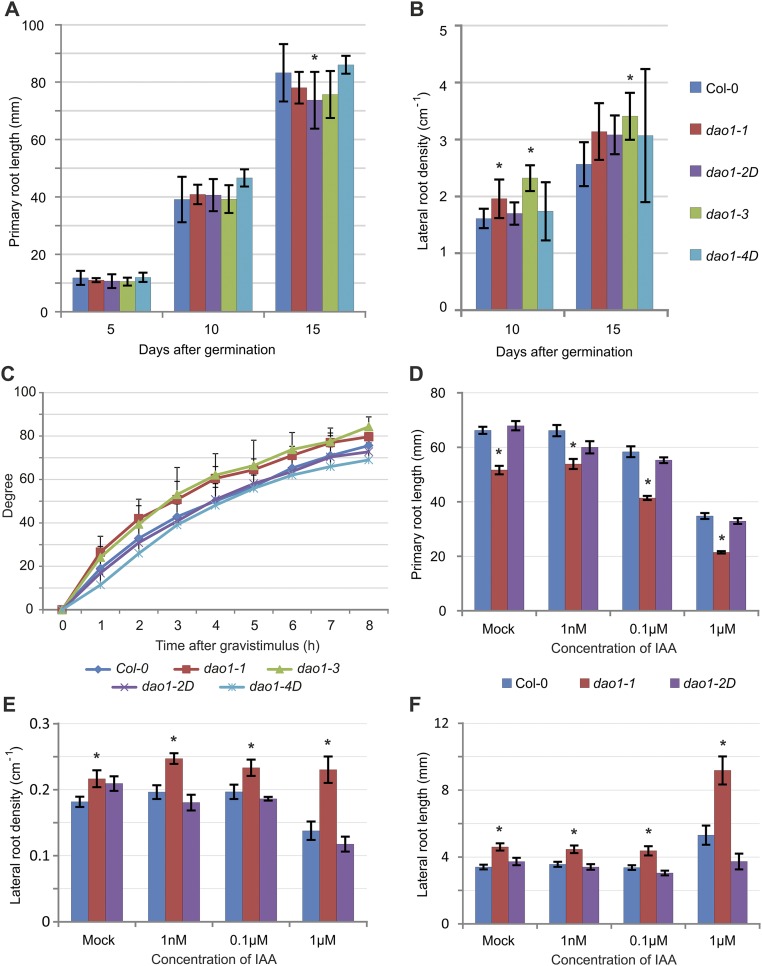
We next characterized the phenotypes of the dao1 mutants (Fig. 2). Given the apparent importance of AtDAO1 mediating IAA oxidation in Arabidopsis seedlings (Fig. 1A), we expected mutant and overexpressing plants to exhibit multiple IAA-related developmental defects. Surprisingly, AtDAO1 mutant and overexpressing lines exhibited only mild defects in plant growth and development (Fig. 2). Compared with WT seedlings, AtDAO1 mutant lines exhibit a slight reduction in primary root length and increase in lateral root density (Fig. 2A and Fig. S3 A and B). The root gravitropic response was faster in loss of function dao1-1 and dao1-3 mutants compared with in dao1-2D and dao1-4D, with response that was similar to that in the WT (Fig. S3C). In shoot tissues, increased branching and shorter siliques were observed in dao1-1, whereas dao1-2D adult plants exhibited a growth phenotype closer to the WT (Fig. 2 B and C).
Fig. 2.
Developmental phenotypes of dao1 mutants. (A) Seedlings from Col-0 and the dao1-1 mutant 10 d after germination. (B) Adult Col-0, dao1-1, and dao1-2D plants. (C) Mature siliques from plants in B. (D) Confocal images showing propidium iodide-stained mature RHs from the root tip of 10-d-old Col-0 and dao1 alleles. (E) RH length from 5- and 10-d-old Col-0 and dao1 alleles. *Values significantly different from those in Col-0 (Mann–Whitney U test; P < 0.001; n = 10). (F) qRT-PCR analysis of the expression of the RSL4 gene in roots from Col-0 and dao1 alleles harvested 7 d after germination. Error bars indicate SDs from three biological replicates. *Expression values significantly different from those in Col-0 (Student’s t test; P < 0.05). (Scale bars: A, 1 cm; B, 5 cm; C, 5 mm; D, 120 μm.)
Fig. S3.
Root phenotypes of the dao1 mutant alleles. (A) Primary root length and (B) lateral root density of dao1 mutants over the vegetative phase. *Values significantly different from those in Col-0 (Mann–Whitney U test; P < 0.05; n = 10). (C) Gravitropic response of the dao1 mutants measured from 6-d-old seedlings (n = 20). (D–F) Effect of IAA on (D) primary root length, (E) lateral root density, and (F) lateral root length in 10-d-old dao1-1 and dao1-2D mutants. Error bars indicate SD. *Values significantly different from those in Col-0 (Student’s t test; P < 0.05; n > 12).
Our root hair (RH) measurements revealed that their length increased ∼80% in dao1-1 and dao1-3 seedlings compared with the WT (Fig. 2 D and E). RH determination and elongation in Arabidopsis is controlled (in part) by a small family of basic Helix-Loop-Helix transcription factors that includes the auxin-inducible gene member RSL4 (14–16). Datta et al. (17) have recently shown that RH length is proportional to RSL4 mRNA abundance. Significantly, qRT-PCR analysis revealed that dao1-1 and dao1-3 seedlings contained an ∼80% increase in RSL4 transcript levels (Fig. 2F), which is directly proportional to their altered RH length. Interestingly, multicellular root modeling predicts an accumulation of IAA in epidermal tissues in the dao1-1 mutant (18), and the RH phenotype in dao1-1 and dao1-3 (Fig. 2 D and E) supports the model. We conclude that, despite the importance of AtDAO1 controlling auxin oxidation (Fig. 1A), loss and gain of function lines exhibit surprisingly weak auxin-related phenotypic alterations (Fig. 2). Nevertheless, dao1-1 primary root length, lateral root density, and lateral root length were all more sensitive to external IAA treatments than the WT or dao1-2D (Fig. S3 D–F), consistent with the dao1-1 mutant having a reduced ability to break down auxin.
AtDAO1 Encodes a Root-Expressed Cytoplasmically Localized IAA Oxidase.
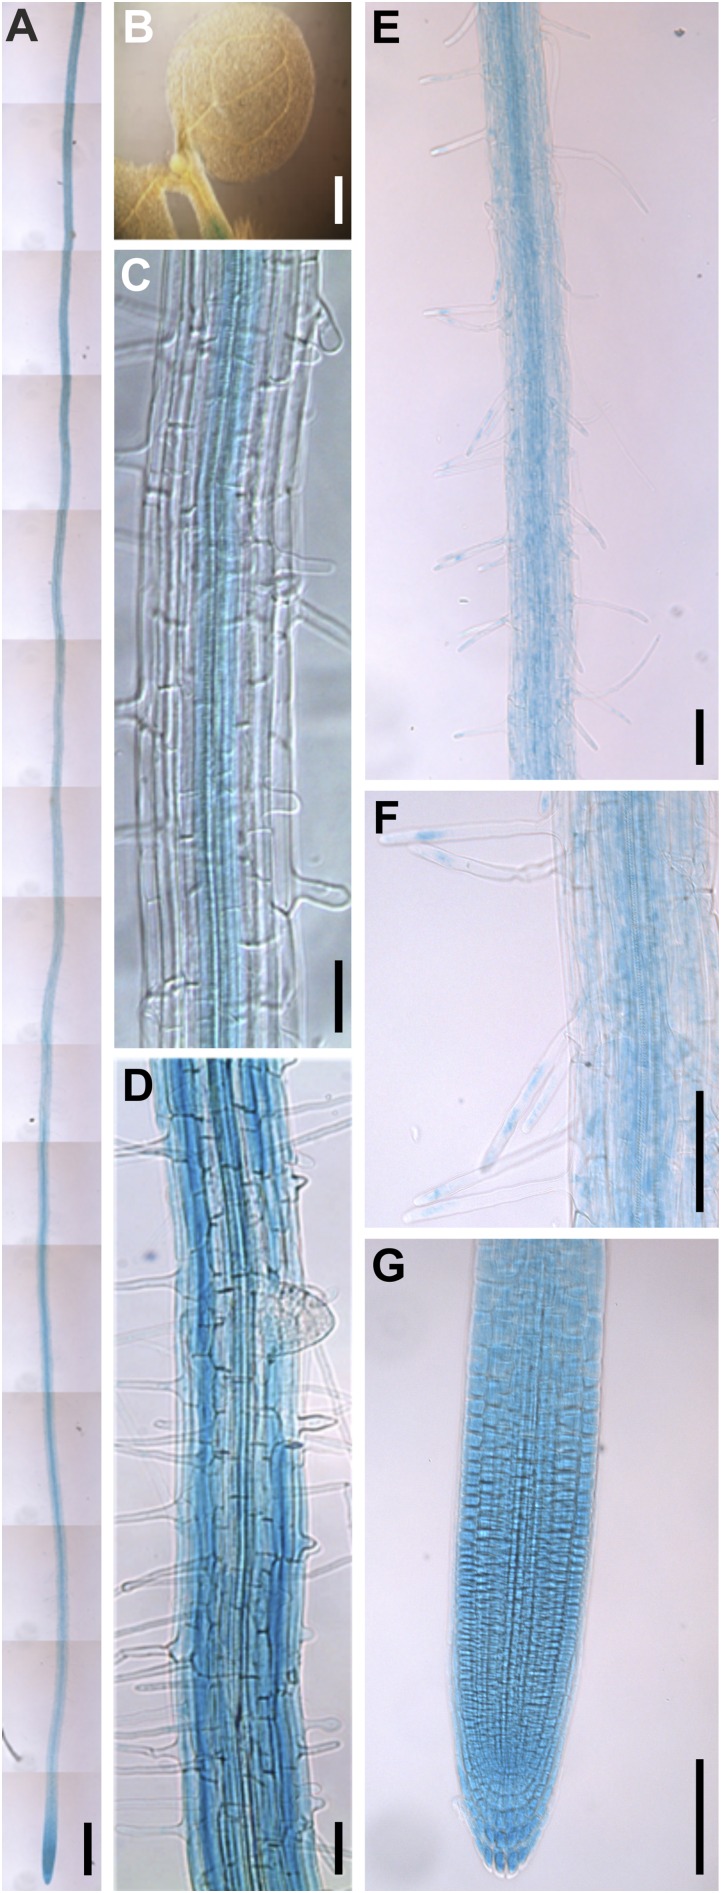
To determine whether the mild dao1 RH phenotype (Fig. 2 D–F) could be caused by an RH-specific expression pattern, we created a transcriptional fusion of At1g14130 (AtDAO1) with the β-glucuronidase (GUS) reporter (pDAO1:GUS) (Fig. S4). Histochemical staining of transgenic pDAO1:GUS seedlings revealed reporter activity in the root tip and vascular (stele) tissues (Fig. S4 A, C, and G). In addition, GUS was detected in epidermal cells in the mature part of the root differentiation zone (Fig. S4D), including RHs (Fig. S4 E and F). In contrast, no GUS expression was observed in lateral root (LR) primordia (Fig. S4D) or aerial tissues (Fig. S4B).
Fig. S4.
DAO1 promoter is mainly active in roots. Visualization of pDAO1:GUS activity in (A) the root, (B) the aerial portion, (C) the stele, (D) epidermal cells in the mature part of the root, (E and F) RHs, and (G) the root tip. Pictures were taken from (A and E–G) 7-, (B) 4-, and (C and D) 5-d-old seedlings. (Scale bars: A, 500 μm; B and E–G, 100 μm; C and D, 50 μm.)
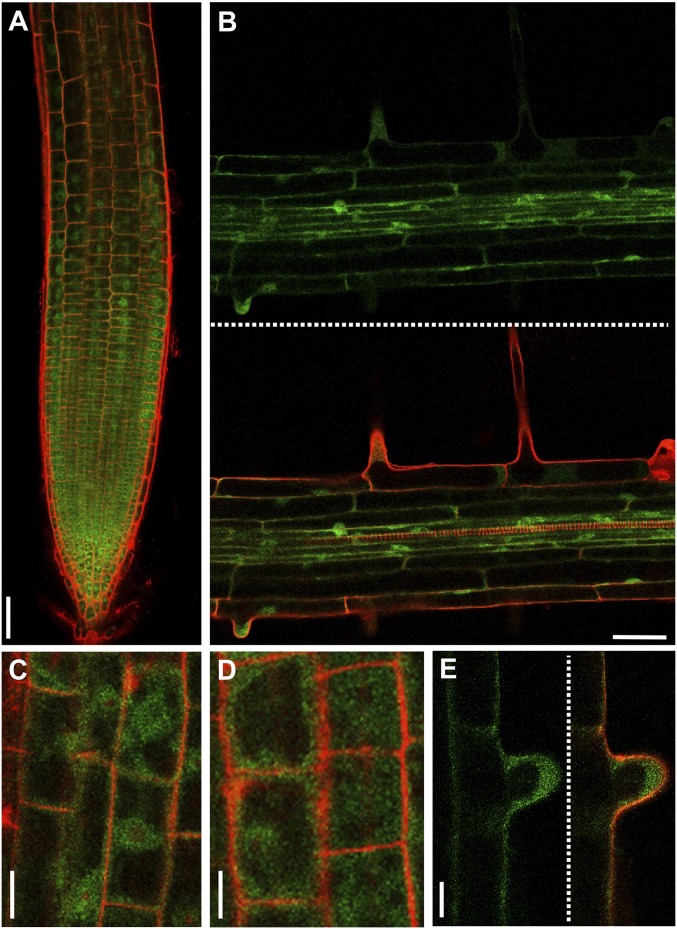
To investigate whether DAO1 stability is subject to posttranslational regulation, transgenic Arabidopsis plants expressing a GFP translational fusion to the At1g14130 genomic sequence (pDAO1::DAO1-GFP) were engineered. Confocal microscopy revealed that the DAO1-GFP fusion protein was detected throughout root apical (Fig. 3A) and mature tissues, including RHs (Fig. 3 B and E). The spatial expression pattern of DAO1 is similar in a transcriptional reporter (pDAO1:GUS) (Fig. S4) as it is in a translational fusion (pDAO1:DAO1-GFP) (Fig. 3), suggesting that the pattern is largely controlled at the transcriptional level. Higher-magnification confocal images of the pDAO1::DAO1-GFP expressing root cells revealed that the IAA oxidase is localized in the cytoplasm and probably excluded from nuclei and central vacuole compartments (Fig. 3 C–E).
Fig. 3.
Cellular localization of DAO1-GFP in roots. Confocal images of root cells from 5-d-old transgenic pDAO1::DAO1-GFP plants, showing (A) root tip epidermal cells, (B) section of the root vasculature in the mature root region, (C and D) magnification of cells from A, and (E) magnification of a trichoblast from B. Green and red signals correspond to GFP and propidium iodide, respectively. (Scale bars: A and B, 50 μm; C and D, 10 μm; E, 25 μm.)
IAA Metabolite Profiling Reveals That AtDAO1 Regulates oxIAA Levels in Arabidopsis.
To study the effect of the AtDAO1 gene on auxin homeostasis, we performed IAA metabolite profiling of dao1-1 mutant and dao1-2D overexpressing lines. Using liquid chromatography–tandem MS (LC-MS/MS) analysis (11), we quantified free IAA and the major IAA precursors, catabolites, and conjugates in 7-d-old seedlings of WT Columbia-0 (Col-0), dao1-1, and dao1-2D.
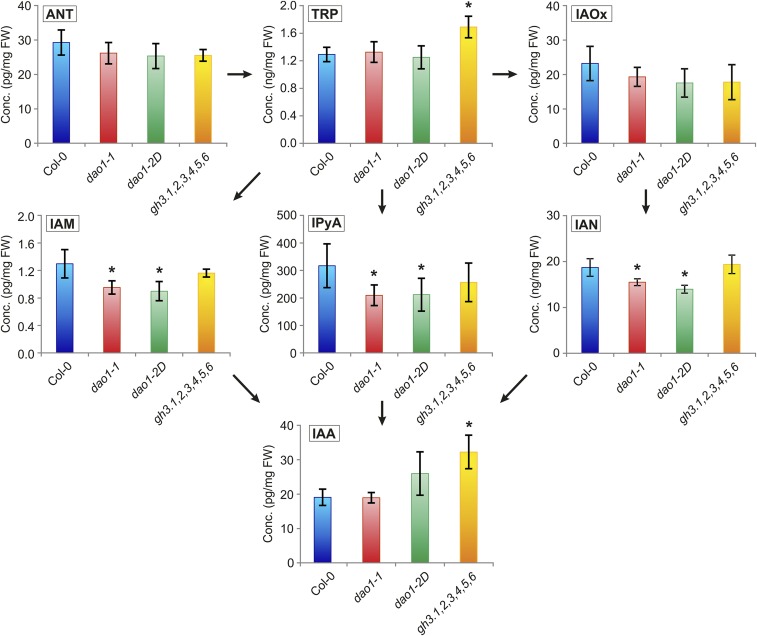
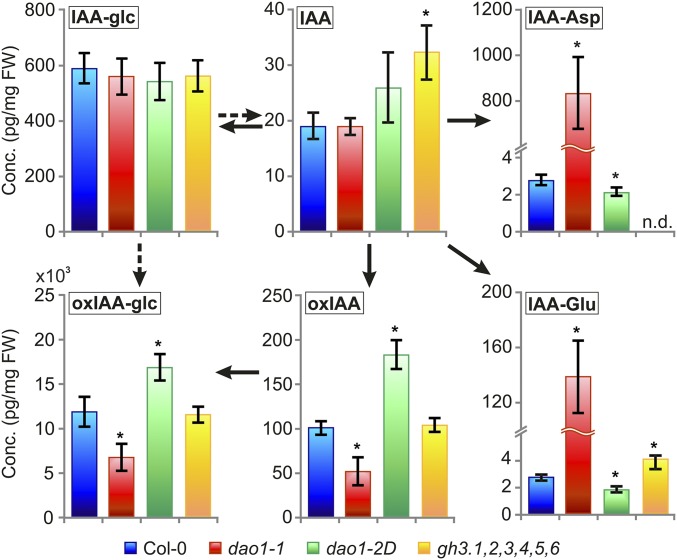
In dao1-1 and dao1-2D, the concentrations of IAA and the IAA precursors tryptophan (TRP), anthranilate, and indole-3-acetaldoxime were not significantly affected (Fig. S5). However, the IAA precursors indole-3-acetamide, indole-3-pyruvic acid, and indole-3-acetonitrile were significantly reduced in these lines compared with in the WT (Fig. S5). We also quantified IAA conjugates and catabolites in dao1-1 and dao1-2D seedlings and observed a significant reduction of oxIAA and oxIAA-glc levels in dao1-1 as well as a significant increase in oxIAA and oxIAA-glc levels in dao1-2D, confirming that dao1-1 and dao1-2D behave as KO and overexpressing lines, respectively (Fig. 4). In contrast, the levels of IAA-glc were not changed in these lines. In a second experiment, we performed IAA metabolite profiling of all DAO1 mutant and overexpressing lines compared with the Col-0 WT. The profiles were very similar between the two mutant (dao1-1 and dao1-3) as well as between the two overexpressing (dao1-2D and dao1-4D) lines (Fig. S2B).
Fig. S5.
Levels of IAA precursors in IAA oxidase and GH3 mutant backgrounds. IAA and the IAA precursors [anthranilate (ANT), indole-3-acetaldoxime (IAOx), indole-3-acetamide (IAM), indole-3-pyruvic acid (IPyA), and indole-3-acetonitrile (IAN)] were quantified in 7-d-old seedlings of Col-0, dao1-1, dao1-2D, and the gh3 sextuple mutant line gh3.1,2,3,4,5,6. The concentration is given in picograms per milligram fresh weight (FW), except for TRP and IAN (nanograms per milligram FW). Samples were analyzed in five independent biological replicates, and error bars represent SDs. *Statistically significant differences from Col-0 (P < 0.05; Student’s t test).
Fig. 4.
Levels of IAA metabolites in IAA oxidase and GH3 sextuple mutant lines. IAA and the metabolites oxIAA, oxIAA-glc, IAA-glc, IAA-Asp, and IAA-Glu were quantified in 7-d-old seedlings of Col-0, dao1-1, dao1-2D, and the gh3 sextuple mutant line gh3.1,2,3,4,5,6. The concentrations for all metabolites except oxIAA-glc [nanograms per milligram fresh weight (FW)] are given in picograms per milligram FW. Samples were analyzed in five independent biological replicates, and error bars represent the SD. *Statistically significant differences from Col-0 (P < 0.05; Student’s t test).
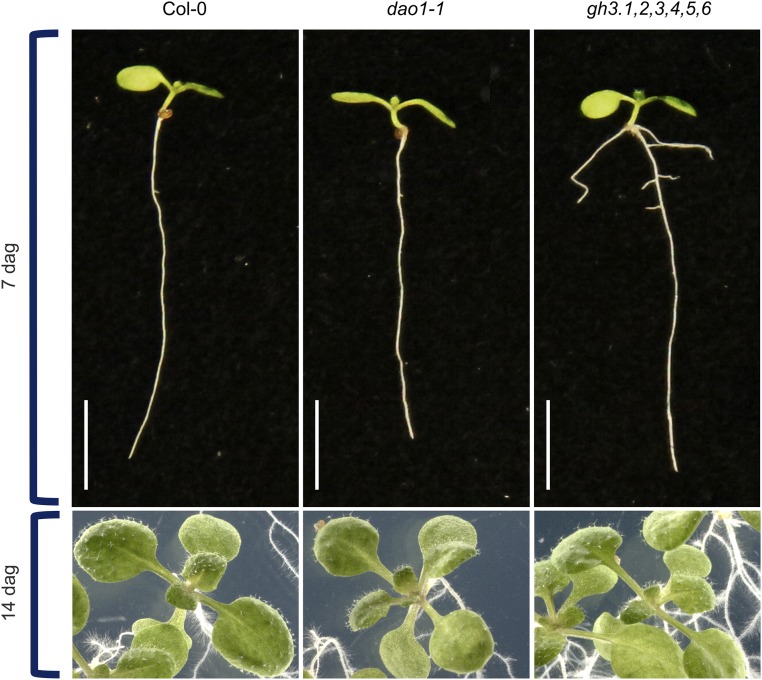
Strikingly, a major up-regulation of the IAA amino acid conjugates IAA-Asp and IAA-Glu was observed in dao1-1 compared with the WT (around ∼280- and 46-fold, respectively) (Fig. 4). In contrast, the oxidase overexpressing line dao1-2D exhibited significantly reduced levels of IAA-Glu and IAA-Asp (Fig. 4). This discovery prompted us to quantify IAA metabolites in a mutant line disrupting IAA amino acid conjugation. The GH3 sextuple mutant gh3.1,2,3,4,5,6, which comprises six of eight IAA-amino acid–conjugating enzyme genes, exhibited a significant increase in IAA and its precursor TRP (Fig. S5). However, levels of oxIAA, oxIAA-glc, and IAA-glc were not affected compared with Col-0, but the levels of IAA-Asp were below the detection limit, whereas the IAA-Glu levels were significantly elevated (Fig. 4). This increase is most likely caused by the IAA-conjugating activity of GH3.17, which prefers Glu over other amino acids, whereas GH3 1–6 exhibits activity with Asp (2, 3). The gh3.1,2,3,4,5,6 mutant line also has a stronger auxin overproduction phenotype compared with the mild auxin overproduction phenotype in dao1-1, with increased lateral root formation and elongated petioles (Fig. S6).
Fig. S6.
Seedlings from the Col-0 WT and the dao1-1 and gh3.1,2,3,4,5,6 mutant lines. Pictures were taken 7 and 14 d after germination (dag). (Scale bars: 5 mm.)
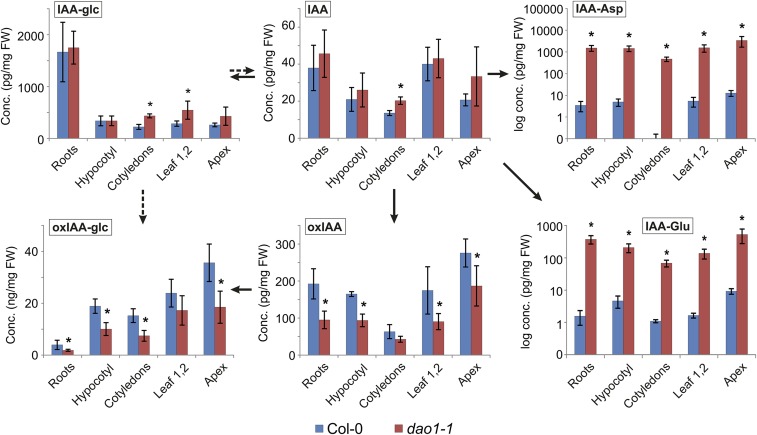
IAA metabolite profiling different tissues of 10-d-old seedlings revealed similar changes in metabolite distribution in every WT and dao1-1 tissue analyzed (Fig. S7). We conclude that disrupting AtDAO1 caused major changes in steady-state levels of oxIAA, oxIAA-Glc, and IAA conjugates but only minor changes in IAA levels (Fig. 4 and Figs. S2B and S7).
Fig. S7.
Levels of IAA metabolites in different tissues of WT Col-0 and dao1-1 seedlings. IAA and the IAA metabolites oxIAA, oxIAA-glc, IAA-glc, IAA-Asp, and IAA-Glu were quantified in root, hypocotyl, cotyledons, leaves 1 and 2, and shoot apex tissues from 10-d-old Col-0 (blue) and dao1-1 mutant (red) seedlings. The concentrations for all metabolites are given in picograms per milligram fresh weight (FW) or nanograms per milligram FW (IAA-Asp and IAA-Glu are given in log scale). Samples were analyzed in five independent biological replicates, and error bars represent SDs. *Statistically significant differences from Col-0 (P < 0.05; Student’s t test).
IAA Conjugation and Catabolism Redundantly Regulate IAA Homeostasis.
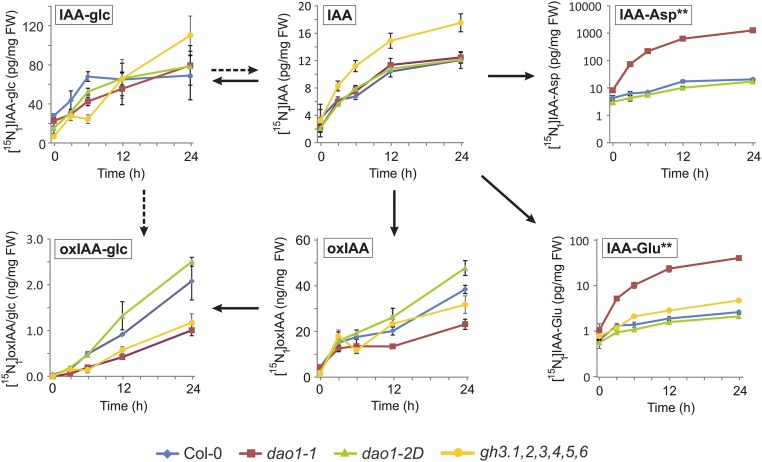
To monitor the rates of de novo synthesis of these metabolites, a feeding experiment was performed using [15N1]indole as IAA precursor. IAA as well as IAA conjugates and catabolites were rapidly labeled after incubation (Fig. S8). The gh3.1,2,3,4,5,6 line exhibited the most rapid labeling of IAA, consistent with a higher IAA synthesis rate and/or lower turnover via conjugation. Labeling of oxIAA and oxIAA-glc was highest in dao1-2D and lowest in dao1-1 as expected in IAA oxidase overexpressing and IAA oxidase mutant lines, respectively. In contrast, extremely rapid labeling of IAA-Asp and IAA-Glu was observed in dao1-1, indicating that the high endogenous IAA conjugate levels observed (Fig. 4 and Figs. S2B and S7) originate from de novo synthesis.
Fig. S8.
In vivo labeling of IAA and IAA metabolites after feeding with [15N1]indole. Seven-day-old Col-0, dao1-1, dao1-2D, and gh3.1,2,3,4,5,6 seedlings were incubated with [15N1]indole, and the levels of IAA and IAA metabolites were quantified after different times of incubation. The level of [15N1]IAA-Asp in the gh3.1,2,3,4,5,6 mutant line was under the detection limit of the used LC-MS/MS method. The levels of de novo synthesized metabolites are given in picograms per milligram fresh weight (FW) or nanograms per milligram FW; n = 3. Error bars indicate SD. **Concentrations are given in log scale.
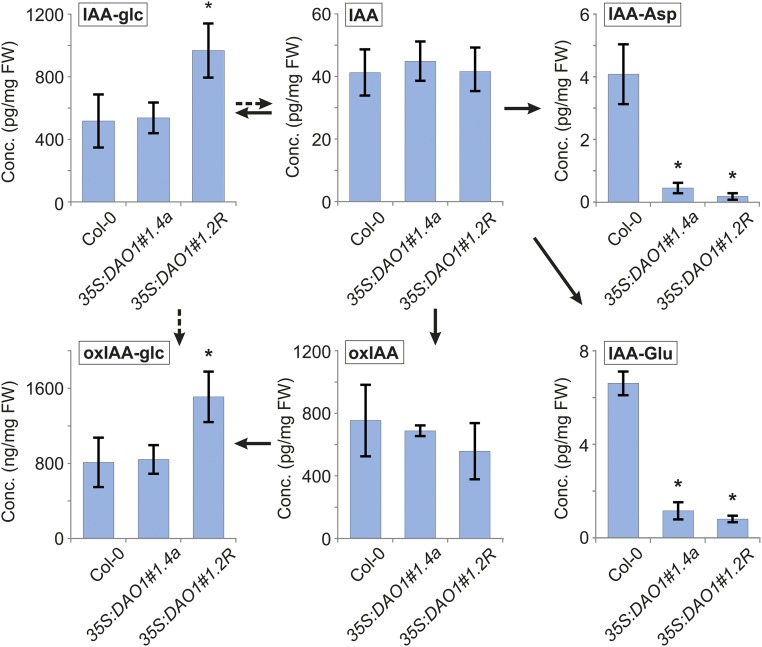
We also quantified IAA metabolites in two 35S:DAO1 lines (Fig. S9). In these constitutive IAA oxidase overexpressing lines, we could not observe any significant changes in IAA and oxIAA levels compared with in the WT. However, a significant up-regulation of both oxIAA-glc and IAA-glc was detected in one of the 35S:DAO1 lines, suggesting that glucosylation pathways were active, whereas the levels of IAA-Asp and IAA-Glu were strongly down-regulated in both 35S:DAO1 lines (Fig. S9). Hence, IAA metabolite profiling has revealed that IAA conjugation and catabolism regulate IAA homeostasis redundantly in Arabidopsis seedlings.
Fig. S9.
Levels of IAA metabolites in IAA oxidase overproducing lines. IAA and the metabolites oxIAA, oxIAA-glc, IAA-glc, IAA-Asp, and IAA-Glu were quantified in 7-d-old seedlings of Col-0 and two independent 35S:DAO1 lines (35S:DAO1#1.4a and 35S:DAO1#1.2R). The concentrations for all metabolites except oxIAA-glc [nanograms per milligram fresh weight (FW)] are given in picograms per milligram FW. Samples were analyzed in five independent biological replicates, and error bars represent the SDs. *Statistically significant differences from Col-0 (P < 0.05; Student’s t test).
Previously described components of the IAA homeostasis machinery, such as GH3 genes, have been described to be rapidly auxin inducible (1). Transcript profiling of auxin-treated root apical tissues revealed that, like GH3 genes, AtDAO1 was auxin inducible, albeit with a lower level of induction and on a longer timescale >4 h (18).
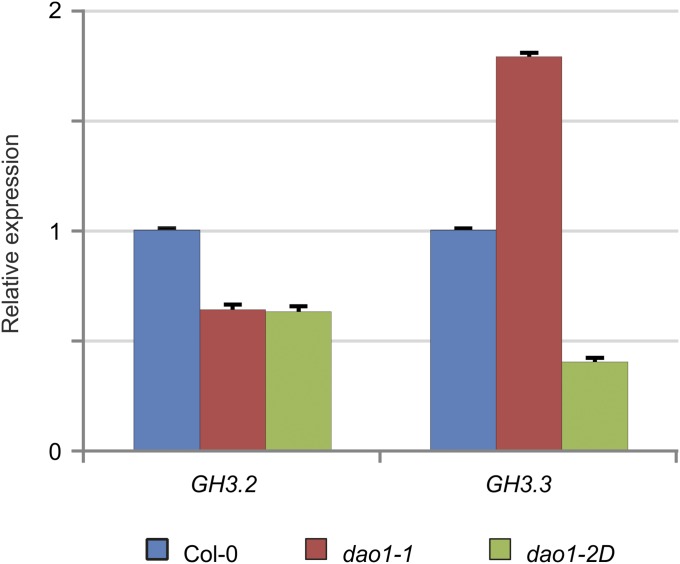
IAA metabolite profiling of AtDAO1 and GH3 mutant lines has revealed that IAA conjugation and catabolism regulate auxin homeostasis redundantly (Fig. 4). Given that IAA-Asp and IAA-Glu were present at high levels in the dao1-1 mutant, we measured the expression of GH3.2 and GH3.3 genes in the dao1-1 and dao1-2D mutant backgrounds (Fig. S10). A 1.8-fold increase in gene expression was detected for GH3.3 in the dao1-1 mutant compared with in the WT. In contrast, GH3.3 expression was down-regulated in the dao1-2D overexpressor line (Fig. S10). We conclude that auxin-inducible expression of both AtDOA1 and GH3 genes could provide a molecular mechanism to explain the observed functional redundancy in IAA catabolism and conjugation that regulates auxin homeostasis.
Fig. S10.
GH3 transcript abundance in the dao1-1 and dao1-2D mutants relative to Col-0. qRT-PCR analysis was performed using cDNA from 7-d-old roots. Fold change was calculated by comparative Ct method, and values were normalized with the expression of the ACT2 gene. Error bars indicate SDs.
Discussion
Maintaining auxin homeostasis is critical for growth and developmental processes in plants. Several mechanisms have been proposed to control auxin homeostasis, including IAA metabolism (biosynthesis, degradation, and conjugation), transport, and compartmentation (reviewed in ref. 19). In this paper, we initially describe the key gene regulating IAA oxidation in Arabidopsis, AtDAO1. In parallel, Zhang et al. (20) have shown that the recombinant AtDAO1 protein (and the closely related AtDAO2 sequence) has IAA oxidase activity in vitro. Confocal imaging of GFP-tagged AtDAO1-expressing transgenic plants suggests that the IAA oxidase is localized cytoplasmically (Fig. 3) and based on subcellular fractionation studies (20), behaves as a soluble protein.
In planta stable isotope-labeled auxin feeding studies have revealed the critical importance of AtDAO1 converting IAA to oxIAA in Arabidopsis seedlings (Fig. 1). In contrast, the in planta role of AtDAO2 is currently less clear given that oxidation of [13C6]IAA to [13C6]oxIAA and [13C6]oxIAA-glc was completely blocked in the dao1-1 loss of function mutant (Fig. 1A). A clue comes from transcript profiling results by Zhang et al. (20), which reported that AtDAO1 is widely expressed in root and shoot tissues at much higher levels than AtDAO2. In addition, transcriptomic profiling revealed that AtDAO1 and AtDAO2 exhibit auxin and circadian regulated patterns of expression, respectively (18,21). Hence, the Arabidopsis AtDAO sequences seem to have subfunctionalized since their tandem duplication event, with AtDAO1 functioning as the major IAA oxidase at the seedling stage of development.
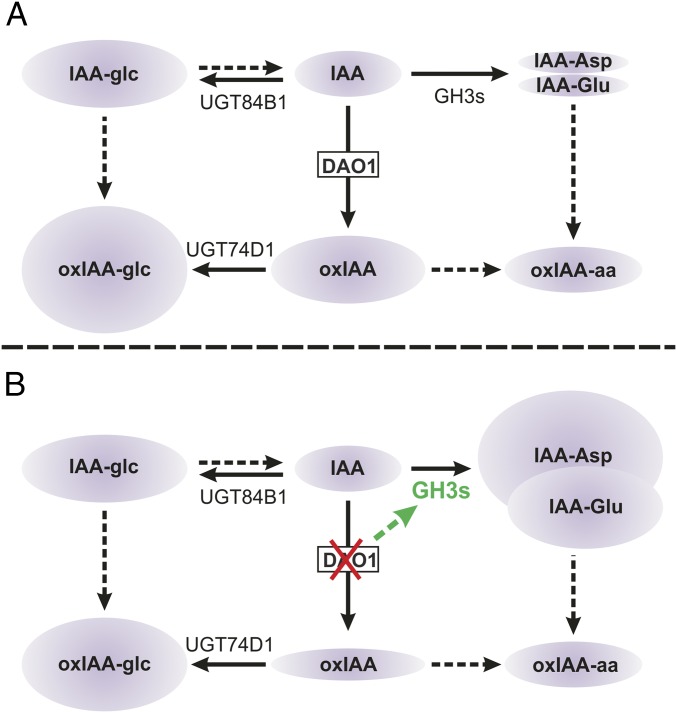
Given how widely the IAA oxidase AtDAO1 is expressed across root and shoot tissues, loss of function dao1 mutant alleles exhibit surprisingly subtle auxin-related developmental defects (Fig. 2 and Fig. S3) (20). This observation can be explained in part, following metabolite profiling and modeling studies (Fig. 4) (18), by IAA oxidation and conjugation pathways regulating auxin homeostasis in a redundant manner. For example, loss of AtDAO1 expression leads to up-regulation of GH3 genes (such as GH3.3) (Fig. S10), increasing concentrations of IAA conjugates IAA-Asp and IAA-Glu (Fig. 4) that maintain IAA homeostasis (Fig. 5). Nevertheless, dao1-1 mutant plants exhibit subtle but clear phenotypes (Fig. 2) (20). These data indicate that, although homeostatic mechanisms regulating IAA levels in Arabidopsis act redundantly, they cannot fully compensate for the loss of AtDAO1 (or GH3) expression, resulting in auxin-related mutant phenotypes (Fig. 2 and Figs. S3 and S6) (20).
Fig. 5.
IAA degradation and conjugation regulate IAA homeostasis in Arabidopsis. (A) In WT plants, IAA is irreversibly oxidized to oxIAA by DAO1 and subsequently conjugated with glucose by the UGT74D1 enzyme to produce oxIAA-glc (9). IAA can also be conjugated to either glucose (IAA-glc) or amino acids by UGT84B1 (7) and members of the GH3 family (2), respectively. IAA-Glu and IAA-Asp are the most abundant IAA-amino acid conjugates in Arabidopsis (5, 10, 11) and believed to be irreversible conjugates that cannot be hydrolyzed to form free IAA (4, 10). (B) In the dao1-1 mutant, GH3 genes are up-regulated to drain accumulating IAA by irreversible conjugation to form IAA-Asp and IAA-Glu, whereas IAA-glc levels are unaltered. Solid arrows indicate steps in which the indicated enzyme is known to catalyze the reaction. Dashed arrows indicate steps that are not well-defined. oxIAA-aa, 2-oxoindole-3-acetic acid amino acid.
Materials and Methods
Growth Conditions.
Seeds were surface sterilized with 50% (vol/vol) hypochlorous acid for 5 min and then, washed three times with sterile deionized water. For IAA metabolite profiling experiments, plant seeds were plated in Murashige and Skoog medium (4.4 g salts per 1 L), including 1% sucrose and 0.5 g/L MES monohydrate, at pH 5.7 and solidified with 0.8% Plant Agar (Duchefa). Seeds were stratified at 4 °C for 72 h in the dark to synchronize germination and then, incubated vertically in a culture room under long-day (LD) conditions (16 h light at 22 °C and 8 h dark at 18 °C; 150 μmol m−2 s−1) and at a relative humidity of 67%. For the rest of the experiments, seeds were plated on 1/2 Murashige and Skoog medium (2.17 g salts per 1 L) without sucrose, stratified at 4 °C for 2–3 d, and then, incubated vertically in a culture room at 22 °C under continuous light (120–150 μmol m−2 s−1).
Plant Material.
The Arabidopsis ecotype Columbia was used as the WT in all experiments. The dao1 T-DNA insertion mutants were obtained from Nottingham Arabidopsis Stock Centre, and the insertion was confirmed by PCR using forward and reverse primers in combination with LBb1.3 (for dao1-1, dao1-3, and dao1-4D) or LB1 (for dao1-2D) (Table S1). The gh3 sextuple mutant (gh3.1,2,3,4,5,6) was assembled by repeated rounds of crossing between the single-gene insertion mutants or their double- or triple-mutant derivatives. Mutants gh3.1 and gh3.2 are in the Landsberg erecta background, and primers for their genotyping were previously described (2). All other mutants were in the Col-0 background; gh3.5 was described previously as wes1 (22), and gh3.4 and gh3.6 are T-DNA insertion lines (Salk_102549 and Salk_013458, respectively), whereas gh3.3 is a transposon line (SM.37350). Genotyping of gh3 insertions was done with forward and reverse primers along with Lba1 (for gh3.4, gh3.5, and gh3.6) or 3′dSpm (for gh3.3) (Table S1). Each single mutant was verified to be essentially a complete KO by Northern blot hybridizations.
Table S1.
Primers used in this work
| Purpose and primer name | Primer sequence (5′→3′) | |
| Forward primer | Reverse primer | |
| Genotyping of insertion lines | ||
| dao1-1 | TTCCCCACGGAATTAAG GTAC | CTATGGGGAAAAAGGTTCC TG |
| dao1-2D | AGCGGTTTGAG ATAC ATGTGG | TTGGTGGACTTG AAGC TATGG |
| dao1-3 | TGAAACATCCCC ATC TCTC AC | ATAAATTTG GGCCC AAAAGTG |
| dao1-4D | TCCGTTTAGTTCCCCC ATATC | TCGTGTTTTGGG TCTC CTATG |
| Gh3.3 | GTGACAGGCAG AG TCACAAG C | TTTTAACGTATTAATC TTGGC ACG |
| Gh3.4 | CAATGACGGGATTTTGATC AC | TGTGGAGCGGAATTATG AAAC |
| Gh3.5 | AGGCCAGTGTTG TTGTC TTTG | TGGTCTTGAGCATAG ATTCCG |
| Gh3.6 | GCAAAAACAGC ACC AAC ACG A | CGCAGCTTTGGAG GTTTC TG A |
| LBb3.1 | ATTTTGCCGATTTC GG AAC | |
| LB1 | GCCTTTTCAGAAATGG ATAAATAG CCTT GCTTCC | |
| Lba1 | TGGTTCACGTAG TG GGCC ATCG | |
| 3′dSpm | TACGAATAAGAGCG TCC ATTTTAG AGT | |
| Cloning | ||
| At1g14130pro | CACCTTCCATAGAAATGTATATG TG | ATCTTCAATGG AG AG GTTAAC |
| At1g14130gfp | CACCTTCCATAGAAATGTATATG TG | TTTATCTAGTCC TGC ATGG G |
| At1g14130cds | CACCATGGGGGAACTAAACG G | TCATTTATCTAGTC CTG CATG |
| qRT-PCR | ||
| qDAO1 | TCGAAGCTTCTGC AG ATCAA | TTTCCTCGCTAAATCC GTTG |
| qDAO2 | CCAGTGGATAG AG ATCTTG AAGC | GGCTTGTATAG TCGC GG ATG |
| qGH3.2 | GTTTGCTTCCGGTC TCCTC | CACGAGCAAGTTCCTTCC A |
| qGH3.3 | CATCACAGAGTTCCTC AC AAGC | GTCGGTCCATGTCTTC ATC A |
| qRSL4 | TCTCTTGGGGATGTTCAAC TTT | AGGCCAAGCAAC TCG TCTC |
| qACT2 | CCGCTCTTTCTTTCCAAGC | CCGGTACCATTGTC AC AC AC |
Root Phenotyping.
The number of lateral roots per seedling was counted using a stereo microscope, and digital images were taken. For RH measurements, seedlings were imaged with a camera mounted to a Leica stereomicroscope. The digital images were used for RH and primary root length measurement with FIJI software. RHs ∼3 mm from the root tip were measured (10 RHs per seedling). For hormone treatment, the indicated concentration of IAA was added to 1/2 Murashige and Skoog medium before it solidified. For gravitropic response assays, plates containing 6-d-old seedlings grown on a 12-h/12-h light/dark period were turned 90°, and the root angle was imaged every 60 min for 8 h using an automated image acquisition system (23) and quantified using FIJI software.
Cloning of At1g14130 and Arabidopsis Transformation.
The transcriptional and translational fusions as the overexpression lines of At1g14130 were generated in gateway-compatible vectors. Genomic DNA from Col-0 was used to amplify 847 bp upstream of the At1g14130 translational start codon by using the At1g14130pro forward and reverse primers (Table S1). The PCR product was cloned into pENTR-d-Topo entry vector (Invitrogen) and recombined by LR reaction into the pGWB3 destination binary vector to create a transcriptional GUS fusion. For the translational fusion, a fragment of 1,846 bp, containing the At1g14130 promoter and coding sequence region without the stop codon, was amplified with At1g14130gfp primers (Table S1). The PCR product was cloned into pENTR-d-Topo entry vector (Invitrogen) and recombined by LR reaction into the pGWB4 (24) destination binary vector to create a translational GFP fusion. To create an overexpression line, the coding sequence of At1g14130 was amplified using the At1g14130cds primers (Table S1). The PCR product was cloned into pENTR-d-Topo entry vector (Invitrogen) and recombined by LR reaction into the pK2GW7 (24) destination binary vector. The authenticity of all constructs was verified by sequencing before transformation. A. thaliana (ecotype Columbia) plants were transformed with Arabidopsis tumefaciens (strain GV3101) using the floral dipping method (25). Screening of T3 seeds for 100% antibiotic resistance identified homozygous plants for the transgene.
IAA Metabolite Profiling.
A. thaliana WT Col-0 as well as gh3.1,2,3,4,5,6 and dao1 mutant lines were grown under LD conditions for 7 or 10 d. Whole seedlings or dissected tissues were collected in five replicates (20 mg tissue per sample). Sample purification and quantification of IAA metabolites were performed as described in ref. 11.
Feeding Experiments with Labeled IAA and Indole.
Seven-day-old Arabidopsis seedlings (Col-0, gh3.1,2,3,4,5,6, and dao1 mutant lines) were incubated with liquid medium containing 0.5 μM [13C6]IAA or 10 μM [15N1]indole for 0, 3, 6, 12, and 24 h under gentle shaking and in darkness. For each time point, 20 mg whole seedlings were collected in three replicates. The samples were extracted and purified by solid-phase extraction as described in ref. 11. Incorporation of the label into IAA metabolites was measured using LC-MS/MS, with the Multiple Reaction Monitoring transitions corresponding to endogenous and labeled compounds. De novo synthesis of IAA metabolites was expressed as the concentration of labeled metabolites at individual time points after correction for natural isotope abundances (26).
Microscopy.
Confocal microscopy was performed using a Leica SP5 Confocal Laser-Scanning Microscope (Leica Microsystems). Cell walls were stained using propidium iodide (10 µg/mL; Sigma). Scanning settings used for one experiment were optimized and kept unchanged throughout the experiment. Images were processed using the Leica SP5 Image Analysis software. Images for Fig. 2 were processed with Adobe Photoshop only for adjustment of brightness and contrast.
Histochemical Analysis.
The GUS gene activity was revealed by incubating seedlings at 37° for 1 h in a phosphate buffer (500 mM; pH 7) containing 0.5 mM potassium ferricyanide, 0.5 mM potassium ferrocyanide, 1 mM EDTA (pH 8), 0.5% (vol/vol) Triton X-100, and 1 mM 5-bromo-4-chloro-3-indolyl β-d-glucuronide (X-Gluc; Sigma). The X-Gluc was initially dissolved in dimethylformamide to reach a final concentration of 0.5%. After GUS staining, seedlings were cleared and mounted in 50% (wt/vol) glycerol.
qRT-PCR.
Real-time qRT-PCR reactions were performed on a LightCycler 480 apparatus (Roche) using SYBR Green Master Mix (Bioline). A standard reaction mixture (12 µL) contained 5 µL cDNA template, 6 µL 2× SYBR Green I Master Mix (Roche), 0.1 µL 100 µM forward and reverse primers, and 0.8 µL H2O. All of the specific primer pairs (Table S1) were designed with the Universal Probe Library Assay Design Center (Roche; lifescience.roche.com/shop/home) and used to quantify the gene expression levels. Arabidopsis ACT2 gene (At3g18780) was used as a constitutive internal standard, which showed no clear changes in Cycle threshold values, to normalize the obtained gene expression results. All individual reactions were done in triplicates.
Acknowledgments
We thank the Swedish Metabolomics Centre for the use of instrumentation. S.P. and M.J.B. acknowledge PhD scholarship support from the University of Nottingham. This work was funded by Ministry of Education, Youth and Sport of the Czech Republic National Program for Sustainability I Grant LO1204 and Internal Grant Agency of Palacky University Grant IGA_PrF_2016_011 (to A.P., P.P., and O.N.). A.R. and M.J.B. acknowledge support of the Saudi Arabian Ministry of Higher Education. U.V., A.B., R.S. and M.J.B. acknowledge support of the Biological and Biotechnology Science Research Council Responsive Mode and CISB awards to the Centre for Integrated Structural Biology. R.C.-S., A.P., O.N., and K.L. acknowledge support from the Swedish Foundation for Strategic Research, the Swedish Research Council, Carl Tryggers Stiftelse för Vetenskaplig Forskning, and Kempestiftelserna. A.G. and K.V. were supported by Research Foundation Flanders Grants G009412N, G.0.602.11.N.10, and 1.5.091.11.N.00 and University of Antwerp Grant BOF-DOCPRO4. K.S. and M.J.B. acknowledge support of the European Research Council FUTUREROOTS Project. P.H. and A.L.P. are funded by the 20:20 Wheat Institute Strategic Programme Grant from the Biotechnology and Biological Sciences Research Council of the United Kingdom.
Footnotes
The authors declare no conflict of interest.
This article is a PNAS Direct Submission.
See Commentary on page 10742.
This article contains supporting information online at www.pnas.org/lookup/suppl/doi:10.1073/pnas.1604375113/-/DCSupplemental.
References
- 1.Ludwig-Müller J. Auxin conjugates: Their role for plant development and in the evolution of land plants. J Exp Bot. 2011;62(6):1757–1773. doi: 10.1093/jxb/erq412. [DOI] [PubMed] [Google Scholar]
- 2.Staswick PE, et al. Characterization of an Arabidopsis enzyme family that conjugates amino acids to indole-3-acetic acid. Plant Cell. 2005;17(2):616–627. doi: 10.1105/tpc.104.026690. [DOI] [PMC free article] [PubMed] [Google Scholar]
- 3.Westfall CS, Herrmann J, Chen Q, Wang S, Jez JM. Modulating plant hormones by enzyme action: The GH3 family of acyl acid amido synthetases. Plant Signal Behav. 2010;5(12):1607–1612. doi: 10.4161/psb.5.12.13941. [DOI] [PMC free article] [PubMed] [Google Scholar]
- 4.Östin A, Kowalyczk M, Bhalerao RP, Sandberg G. Metabolism of indole-3-acetic acid in Arabidopsis. Plant Physiol. 1998;118(1):285–296. doi: 10.1104/pp.118.1.285. [DOI] [PMC free article] [PubMed] [Google Scholar]
- 5.Kai K, Horita J, Wakasa K, Miyagawa H. Three oxidative metabolites of indole-3-acetic acid from Arabidopsis thaliana. Phytochemistry. 2007;68(12):1651–1663. doi: 10.1016/j.phytochem.2007.04.030. [DOI] [PubMed] [Google Scholar]
- 6.Pencík A, et al. Regulation of auxin homeostasis and gradients in Arabidopsis roots through the formation of the indole-3-acetic acid catabolite 2-oxindole-3-acetic acid. Plant Cell. 2013;25(10):3858–3870. doi: 10.1105/tpc.113.114421. [DOI] [PMC free article] [PubMed] [Google Scholar]
- 7.Jackson RG, et al. Identification and biochemical characterization of an Arabidopsis indole-3-acetic acid glucosyltransferase. J Biol Chem. 2001;276(6):4350–4356. doi: 10.1074/jbc.M006185200. [DOI] [PubMed] [Google Scholar]
- 8.Peer WA, Cheng Y, Murphy AS. Evidence of oxidative attenuation of auxin signalling. J Exp Bot. 2013;64(9):2629–2639. doi: 10.1093/jxb/ert152. [DOI] [PubMed] [Google Scholar]
- 9.Tanaka K, et al. UGT74D1 catalyzes the glucosylation of 2-oxindole-3-acetic acid in the auxin metabolic pathway in Arabidopsis. Plant Cell Physiol. 2014;55(1):218–228. doi: 10.1093/pcp/pct173. [DOI] [PMC free article] [PubMed] [Google Scholar]
- 10.Kowalczyk M, Sandberg G. Quantitative analysis of indole-3-acetic acid metabolites in Arabidopsis. Plant Physiol. 2001;127(4):1845–1853. [PMC free article] [PubMed] [Google Scholar]
- 11.Novák O, et al. Tissue-specific profiling of the Arabidopsis thaliana auxin metabolome. Plant J. 2012;72(3):523–536. doi: 10.1111/j.1365-313X.2012.05085.x. [DOI] [PubMed] [Google Scholar]
- 12.Butler ED, Gallagher TF. Characterization of auxin-induced ARRO-1 expression in the primary root of Malus domestica. J Exp Bot. 2000;51(351):1765–1766. doi: 10.1093/jexbot/51.351.1765. [DOI] [PubMed] [Google Scholar]
- 13.Zhao Z, et al. A role for a dioxygenase in auxin metabolism and reproductive development in rice. Dev Cell. 2013;27(1):113–122. doi: 10.1016/j.devcel.2013.09.005. [DOI] [PubMed] [Google Scholar]
- 14.Yi K, Menand B, Bell E, Dolan L. A basic helix-loop-helix transcription factor controls cell growth and size in root hairs. Nat Genet. 2010;42(3):264–267. doi: 10.1038/ng.529. [DOI] [PubMed] [Google Scholar]
- 15.Balcerowicz D, Schoenaers S, Vissenberg K. Cell fate determination and the switch from diffuse growth to planar polarity in Arabidopsis root epidermal cells. Front Plant Sci. 2015;6:1163. doi: 10.3389/fpls.2015.01163. [DOI] [PMC free article] [PubMed] [Google Scholar]
- 16.Velasquez SM, Barbez E, Kleine-Vehn J, Estevez JM. Auxin and Cellular Elongation. Plant Physiol. 2016;170(3):1206–1215. doi: 10.1104/pp.15.01863. [DOI] [PMC free article] [PubMed] [Google Scholar]
- 17.Datta S, Prescott H, Dolan L. Intensity of a pulse of RSL4 transcription factor synthesis determines Arabidopsis root hair cell size. Nat Plants. 2015;1(10):15138. doi: 10.1038/nplants.2015.138. [DOI] [PubMed] [Google Scholar]
- 18.Mellor N, et al. Dynamic regulation of auxin oxidase and conjugating enzymes AtDAO1 and GH3 modulates auxin homeostasis. Proc Natl Acad Sci USA. 2016;113:11022–11027. doi: 10.1073/pnas.1604458113. [DOI] [PMC free article] [PubMed] [Google Scholar]
- 19.Ljung K. Auxin metabolism and homeostasis during plant development. Development. 2013;140(5):943–950. doi: 10.1242/dev.086363. [DOI] [PubMed] [Google Scholar]
- 20.Zhang J, et al. DAO1 catalyzes temporal and tissue-specific oxidative inactivation of auxin in Arabidopsis thaliana. Proc Natl Acad Sci USA. 2016;113:11010–11015. doi: 10.1073/pnas.1604769113. [DOI] [PMC free article] [PubMed] [Google Scholar]
- 21.Voß U, et al. The circadian clock rephases during lateral root organ initiation in Arabidopsis thaliana. Nat Commun. 2015;6:7641. doi: 10.1038/ncomms8641. [DOI] [PMC free article] [PubMed] [Google Scholar]
- 22.Park JE, et al. GH3-mediated auxin homeostasis links growth regulation with stress adaptation response in Arabidopsis. J Biol Chem. 2007;282(13):10036–10046. doi: 10.1074/jbc.M610524200. [DOI] [PubMed] [Google Scholar]
- 23.Wells DM, et al. Recovering the dynamics of root growth and development using novel image acquisition and analysis methods. Philos Trans R Soc Lond B Biol Sci. 2012;367(1595):1517–1524. doi: 10.1098/rstb.2011.0291. [DOI] [PMC free article] [PubMed] [Google Scholar]
- 24.Nakagawa T, et al. Development of series of gateway binary vectors, pGWBs, for realizing efficient construction of fusion genes for plant transformation. J Biosci Bioeng. 2007;104(1):34–41. doi: 10.1263/jbb.104.34. [DOI] [PubMed] [Google Scholar]
- 25.Clough SJ, Bent AF. Floral dip: A simplified method for Agrobacterium-mediated transformation of Arabidopsis thaliana. Plant J. 1998;16(6):735–743. doi: 10.1046/j.1365-313x.1998.00343.x. [DOI] [PubMed] [Google Scholar]
- 26.Cobelli C, Toffolo G, Foster DM. Tracer-to-tracee ratio for analysis of stable isotope tracer data: Link with radioactive kinetic formalism. Am J Physiol. 1992;262(6 Pt 1):E968–E975. doi: 10.1152/ajpendo.1992.262.6.E968. [DOI] [PubMed] [Google Scholar]


