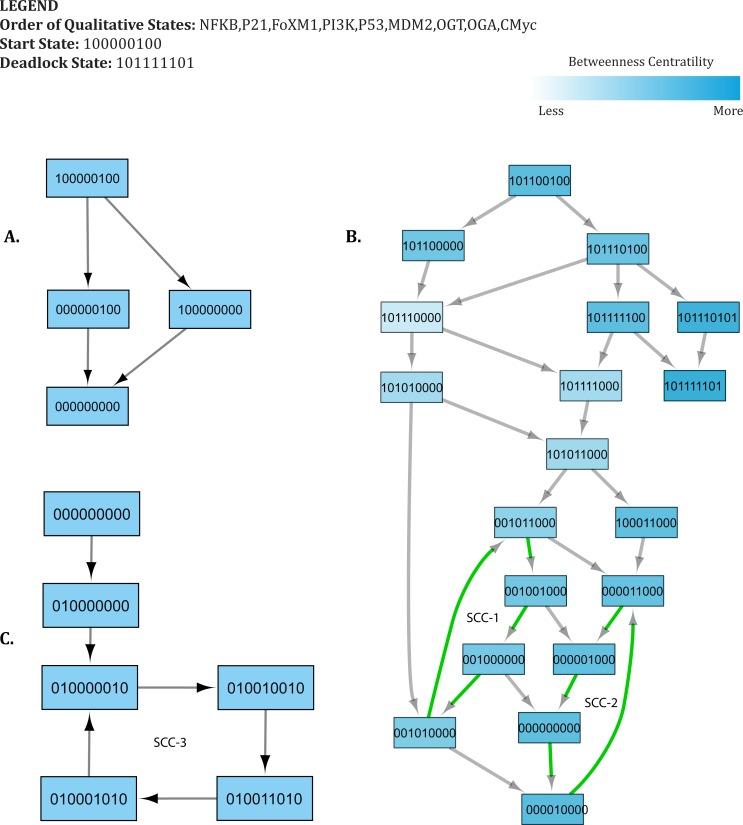
Figure 7. Important trajectories involved in Recovery.
Each node in the graph represents a unique state of the system characterized by the expression level of genes in the following order: NF-κB, p21, FoxM1, PI3K, p53, MDM2, OGT, OGA, c-Myc. Activation of a particular gene/entity is indicated with “1”, whereas “0” indicates that the expression level of a gene is below the activation threshold. Nodes are shaded based on the level of betweenness centrality. Nodes and trajectories involved in oscillations are denoted using green arrows. SCC highlights strongly connected components. (A) Transition from the start state (1,0,0,0,0,0,1,0,0) to the recovery state (0,0,0,0,0,0,0,0,0). (B) Possible transition from advanced tumor progression to the recovery state. (C) Transition from the recovery state (0,0,0,0,0,0,0,0,0) to attractor. The deadlock state is represented as (1,0,1,1,1,1,1,0,1).

