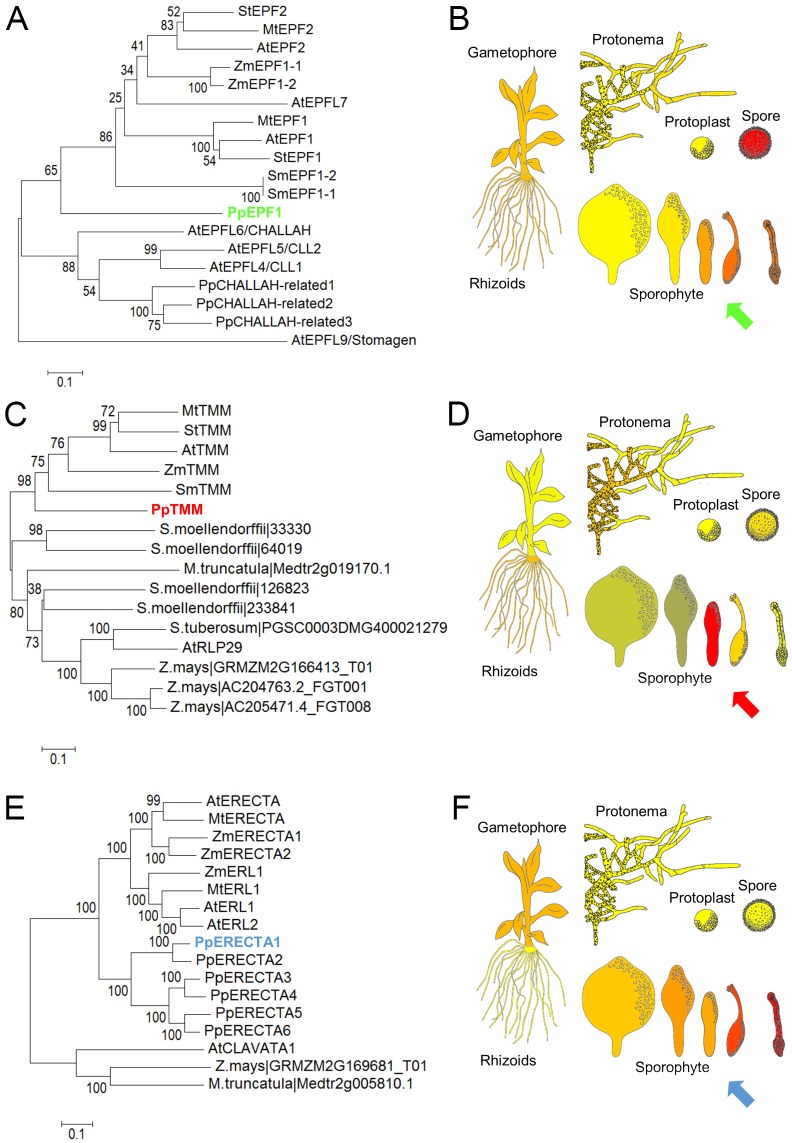
Fig. 1.
Phylogeny and expression profiles of stomatal patterning genes in Physcomitrella patens. (A,C,E) Phylogenetic trees constructed using amino acid sequences of selected Arabidopsis EPF1 (A), TMM (C) and ERECTA (E) gene family members based on Phytozome V11 (Goodstein et al., 2012), using the neighbour-joining method (Saitou and Nei, 1987; Takata et al., 2013) on MEGA6 (Tamura et al., 2013). The percentage of replicate trees in which the associated taxa clustered together in the bootstrap test (1000 replicates) are shown next to the branches (Felsenstein, 1985). Amino acid sequences from P. patens (Pp), Selaginella moellendorffii (Sm), Zea mays (Zm), Symphytum tuberosum (St), Medicago truncatula (Mt) and A. thaliana (At) were used to generate trees, except for ERECTA, for which S. moellendorffii and S. tuberosum gene family members were omitted, owing to the large overall number of genes in the ERECTA family. For complete analyses of all three gene families, see Fig. S1. (B,D,F) Expression profiles of PpEPF1 (B), PpTMM (D) and PpERECTA1 (F) based on microarray data taken from the P. patens eFP browser (Ortiz-Ramírez et al., 2016; Winter et al., 2007) for spore, protoplast, protonemal, gametophyte and sporophyte tissue. Red indicates a relatively high transcript level, with the arrows highlighting phases of sporophyte development when the respective genes appear to be relatively highly expressed. For the expression profiles of other PpERECTA gene family members, see Fig. S2.

