. 2016 Sep 30;5:e18458. doi: 10.7554/eLife.18458

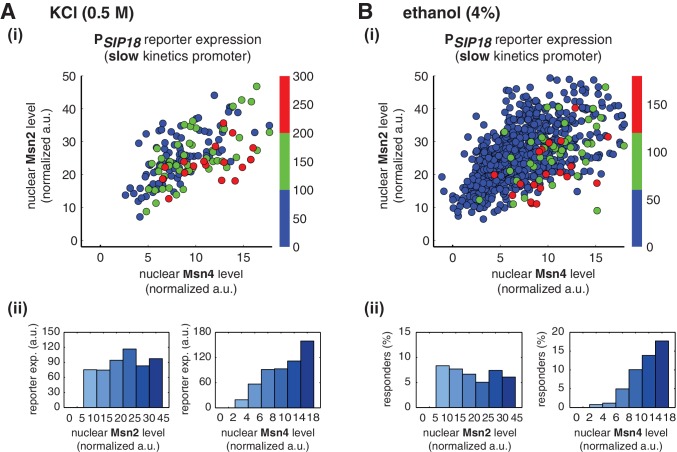
Figure 4. Msn2 and Msn4 exhibit distinct gene regulatory functions in single cells in response to natural stresses.

(A) (i) A scatter plot showing the relationship of the slow kinetics promoter PSIP18 reporter expression with Msn2 and Msn4 activation at the single cell level in response to 0.5M KCl. Each dot represents a single cell. The x and y axes represent the peak values of Msn4 and Msn2 nuclear translocation (the maximal values in the first 30 min of translocation time traces), respectively; and the dot color represents the peak level of gene expression as indicated in the color bar (n: 182 cells). (ii) Plots show the relationships between PSIP18 reporter expression and (left) Msn2 or (right) Msn4, respectively. Single cells are binned based on their Msn2 or Msn4 nuclear level as indicated in the x-axis and the average of reporter expression is calculated for each binned groups of single cells and shown in the bar graphs. (B) Scatter plots and bar graphs showing the relationship of the slow kinetics promoter PSIP18 reporter expression with Msn2 and Msn4 activation at the single cell level in response to 4% ethanol. The data analysis and presentation schemes are consistent with those in (A). Because the majority of cells are not able to express the reporter gene, the proportion of 'responder' cells (green and red cells) is quantified and shown in the bar graphs, instead of the average of reporter expression. Data from a large number of single cells are collected to obtain enough responders (n: 924 cells). Single-cell data used in these plots are provided in the source data files.

DOI: http://dx.doi.org/10.7554/eLife.18458.018

Figure 4—source data 1. Source data for Figure 4A.
DOI: 10.7554/eLife.18458.019
Figure 4—source data 2. Source data for Figure 4B.
DOI: 10.7554/eLife.18458.020

Figure 4.

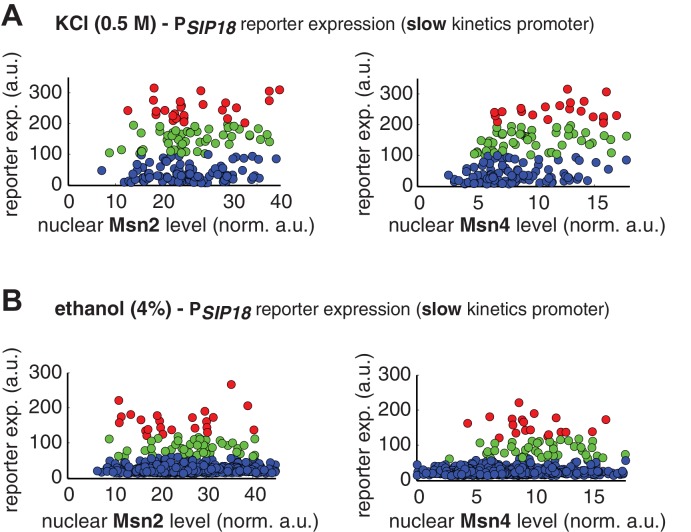
Figure 4—figure supplement 1. Single-cell distributions of reporter gene expression versus nuclear TF levels in response to natural stresses.

Figure 4—figure supplement 1.

(A) Single-cell scatter plots showing the relationships between PSIP18 reporter expression and (left) Msn2 or (right) Msn4 nuclear level, respectively, in response to 0.5 M KCl. Single-cell data are from Figure 4A. (B) Single-cell scatter plots showing the relationships between PSIP18 reporter expression and (left) Msn2 or (right) Msn4 nuclear level, respectively, in response to 4% ethanol. Single-cell data are from Figure 4B. Because the majority of cells are not able to express the reporter gene, scatter plots, instead of boxplots, are used here to show the distributions of responder cells (green and red) and non-responder cells (blue) with different TF levels.
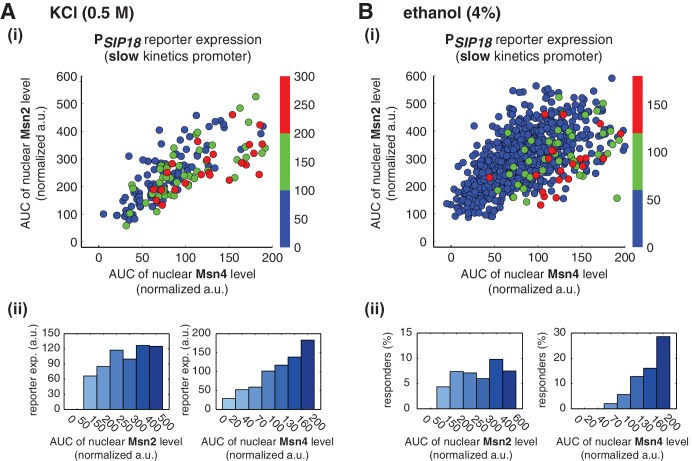
Figure 4—figure supplement 2. Relationship between reporter gene expression and the area-under-the-curve (AUC) of nuclear TF levels in response to natural stresses.

Figure 4—figure supplement 2.

Single-cell data in Figure 4 were analyzed show the relationship of the slow kinetics promoter PSIP18 reporter expression with the AUC of Msn2 and Msn4 nuclear translocation in response to (A) 0.5 M KCl and (B) 4% ethanol. For the ethanol treatment, the AUC is calculated as the sum of TF nuclear levels for the first 30 min of stress treatment for each single-cell time trace (data points taken every two minutes). Due to the translational arrest induced by ethanol stress, TF nuclear localization at the later time points would not be able to contribute significantly to gene expression.