

Abstract
Background:
Prenatal exposure to ambient PM2.5, (i.e., fine particulate matter, aerodynamic diameter ≤ 2.5 μm) has been associated with preterm birth and low birth weight. The association between prenatal PM2.5 exposure and intrauterine inflammation (IUI), an important risk factor for preterm birth and neurodevelopmental outcomes, has not been evaluated.
Objectives:
We aimed to investigate the association between maternal exposure to PM2.5 and IUI in the Boston Birth Cohort, a predominantly urban low-income minority population.
Methods:
This analysis included 5,059 mother–infant pairs in the Boston Birth Cohort. IUI was assessed based on intrapartum fever and placenta pathology. PM2.5 exposure was assigned using data from the U.S. EPA’s Air Quality System. Odds ratios (OR) and 95% confidence intervals (CI) quantified the association of maternal PM2.5 exposure during preconception and various periods of pregnancy with IUI.
Results:
Comparing the highest with the lowest PM2.5 exposure quartiles, the multi-adjusted association with IUI was significant for all exposure periods considered, including 3 months before conception (OR = 1.52; 95% CI: 1.22, 1.89), first trimester (OR = 1.93; 95% CI: 1.55, 2.40), second trimester (OR = 1.67; 95% CI: 1.35, 2.08), third trimester (OR = 1.53; 95% CI: 1.24, 1.90), and whole pregnancy (OR = 1.92; 95% CI: 1.55, 2.37).
Conclusions:
Despite relatively low exposures, our results suggest a monotonic positive relationship between PM2.5 exposure during preconception and pregnancy and IUI. IUI may be a sensitive biomarker for assessing early biological effect of PM2.5 exposure on the developing fetus.
Citation:
Nachman RM, Mao G, Zhang X, Hong X, Chen Z, Soria CS, He H, Wang G, Caruso D, Pearson C, Biswal S, Zuckerman B, Wills-Karp M, Wang X. 2016. Intrauterine inflammation and maternal exposure to ambient PM2.5 during preconception and specific periods of pregnancy: the Boston Birth Cohort. Environ Health Perspect 124:1608–1615; http://dx.doi.org/10.1289/EHP243
Introduction
Maternal exposure to air pollution during pregnancy is associated with adverse birth outcomes such as low birth weight and preterm birth (Bell et al. 2007; Brauer et al. 2008; Dadvand et al. 2014; Fleischer et al. 2014; Gehring et al. 2011; Jalaludin et al. 2007; Kloog et al. 2012; Le et al. 2012; Lee et al. 2013; Malmqvist et al. 2011; Pereira et al. 2014; Ritz et al. 2000, 2007; Wang et al. 1997; Xu et al. 1995). The biological mechanisms behind this relationship are not well understood, but inflammation is thought to play a role (Muglia and Katz 2010; Slama et al. 2008). Exposure to PM2.5 (particulate matter with an aerodynamic diameter ≤ 2.5 μm) and resulting oxidative stress may lead to chronic systematic inflammation (Hajat et al. 2015; WHO 2003). Maternal PM2.5 exposure and inflammation during pregnancy (Lee et al. 2011; van den Hooven 2012a), may affect the growth, development, and function of the placenta (Backes et al. 2013; van den Hooven 2012b; Wright and Brunst 2013). Emerging evidence in rats suggests that PM2.5 exposure of the pregnant mother may induce inflammation at the site of the placenta (de Melo et al. 2015), raising concerns that PM2.5 may be associated with intrauterine inflammation (IUI), a known risk factor for preterm birth, low birth weight, and poor respiratory outcomes in early childhood [Gupta et al. 2007; Institute of Medicine (U.S.) Committee on Understanding Premature Birth and Assuring Healthy Outcomes 2007; Kumar et al. 2008; Mestan et al. 2010]. In humans, cord blood C-reactive protein concentrations—evidence of systemic inflammation in the fetus—have been positively associated with maternal exposure to particulate matter during pregnancy, and IUI is hypothesized to play a role (van den Hooven et al. 2012a). However, currently, to our knowledge, no investigation of the association between air pollution exposure and IUI has been carried out. Large cohorts created through the linkage of birth registries with air pollution data are useful for the study of preterm birth and low birth weight, because these outcomes can be identified using data commonly included in birth records. However, study of IUI is complicated by the need for tissue samples and/or clinical data from which the presence of IUI can be determined.
In addition, few existing studies have investigated the reproductive effects of air pollution in one of the most at-risk populations, urban minorities (Le et al. 2012). Within the United States, African Americans and Hispanics are more highly exposed to air pollution (Jones et al. 2014), and African Americans have higher rates of IUI than do whites [Institute of Medicine (U.S.) Committee on Understanding Premature Birth and Assuring Healthy Outcomes 2007]. Estimates of the prevalence of IUI range from 25% to 50% of preterm births (Culhane and Goldenberg 2011; Goldenberg et al. 2000, 2008; Incerpi 2010), and 20% of full-term births in the general population (Incerpi 2010), though data are sparse because evaluation of IUI by adequately sensitive methods is not routinely performed.
In this study, we assessed the relationship between IUI and maternal exposure to ambient PM2.5 before and during pregnancy in an at-risk urban predominantly minority population. By examining IUI, we potentially bridge two previously studied relationships: PM2.5 exposure and preterm birth (Rappazzo et al. 2014; Ritz et al. 2007; Pereira et al. 2014; Xu et al. 1995), and IUI and preterm birth (Goldenberg et al. 2000). The study of IUI will further our understanding of inflammation as a potential marker of biologic effect of exposure to PM2.5 early in life with relevance to the health of the developing fetus.
Methods
Study Design and Population
The study population was a subgroup of mother–infant pairs recruited from 1999 through 2012 as part of the Boston Birth Cohort, an ongoing prospective cohort established in 1998 at the Boston Medical Center (BMC). BMC serves an ethnically diverse community of patients who primarily reside in an urban setting, and the birth cohort is enriched for preterm birth by recruiting at a ratio of approximately one preterm for two full-term births. Multiple births and newborns with major birth defects were excluded. Patient recruitment and data collection methods are detailed elsewhere (Wang et al. 2002). Briefly, recruitment took place 24–48 hr after birth, and informed written consent was obtained from all participating mothers. Clinical data were obtained from maternal and infant medical records, and an interview questionnaire was administered at the time of recruitment and consent to determine social demographic variables, smoking status, and alcohol intake. In addition, maternal blood, placental tissue, and other biological samples were collected at the time of recruitment and analyzed or stored for later analysis. The study protocol was approved by institutional review boards at the BMC and Johns Hopkins Bloomberg School of Public Health.
Data Collection
Detailed data collection and measurement methods for clinical and sociodemographic variables have been previously published elsewhere (Kumar et al. 2008; Wang et al. 2002). Briefly, an interview was conducted using a standardized questionnaire, upon obtaining informed signed consent from the mother, from which data on maternal education, household income, current and previous residential addresses, and maternal smoking before and during the pregnancy were obtained for the period 3 months before conception and for each of the first, second, and third trimesters. Participants were asked to provide dates of residence changes. In addition, a standardized abstraction form was used to obtain data such as maternal prepregnancy body mass index (BMI), maternal age at delivery, sex of the baby, ultrasound findings, pathology reports, laboratory results, and labor and delivery course from medical records. Medical records were also used to identify changes in residential address not captured in the questionnaire. Gestational age was assessed based on the date of the last menstrual period as well as results of early ultrasound (< 20 weeks gestation), abstracted from medical records.
Outcome Assessment
Mothers were defined as having IUI if either of the following criteria were met: placenta histopathology consistent with uterine inflammation, or the presence of intrapartum maternal fever > 38°C at parturition. Placentas were obtained by the labor and delivery nurses at the time of delivery and sent to the hospital perinatal pathologist to be processed and reviewed. The presence of inflammation (acute or chronic) in any of several locations in the placenta, including the decidua, chorion, amnion, chorionic plate, and the umbilical cord, was reported according to algorithms consistent with guidelines of the College of American Pathologists (Benirschke et al. 2000; Langston et al. 1997). Strong intra-observer agreement (κ = 0.78–0.81) has been reported for the diagnosis of inflammatory conditions such as chorioamnionitis (Simmonds et al. 2004). During the course of the Boston Birth Cohort, a new hospital pathologist took over examination of placentas. Before this, for training purposes, a subset (n = 298) of the placental pathology slides was randomly selected and independently reviewed by the two placental pathologists, who compared readings and reached consensus about the reporting of the pathology findings.
Exposure Assessment
Individual exposures to PM2.5 were estimated by assigning each subject to the closest monitor by their residential address, reported at the time of study recruitment, using ArcGIS 10.2 (ESRI, Inc.). No limits were placed on the distance between subjects and monitors. A map of the study area depicts the locations of subjects relative to monitor locations (Figure 1). We included only data from monitors that had at least one measurement per week for 75% of the study period. All other monitors were excluded from the analysis. Measurements were recorded every 3 days for the monitors in the study except for a few short periods during which measurements were recorded daily.
Figure 1.

Map of the study area (Boston, Massachusetts) depicting distances between 5,059 mother–infant pairs (green) and PM2.5 air quality monitors (yellow) included in the study. (Map image is the intellectual property of ESRI and is used herein under license. Copyright © 2014 ESRI and its licensors. All rights reserved.)
Exposure periods were calculated based on the gestational age of the infant at birth and were divided into phases: 3 months (90 days) before pregnancy, first trimester (day 1 to day 90 of pregnancy), second trimester (day 91 to day 180 of pregnancy), third trimester (day 181 of pregnancy to birth), and the last month before delivery. Because data sets from monitors in the study far exceeded the criterion of 1 measurement per week for 75% of the study period, the last recorded measurement was assigned to the next 2 days for those monitors with a 1-in-3 day measurement schedule. Exposure was assessed for each individual participant as the geometric mean of the daily PM2.5 ambient concentrations during a given exposure period of interest (e.g., preconception, first, second, and third trimester, whole pregnancy, and last month). Daily PM2.5 concentration data came from the monitor closest to the participant’s date-specific address. If a participant moved residence, daily data from the monitor closest to the previous residence were used up to the date of the move, and data from the monitor closest to the new address were used starting on the date of the move. Quartiles of exposure were determined separately for each pregnancy period from the distribution of all participant exposures during that period. Exposure was categorized by quartile and as a continuous variable. Interquartile ranges (IQRs) and cut points between quartiles varied slightly by period of exposure due to missing exposure data, and varied between the main analysis and analyses performed in subsets of the study population.
Statistical Analysis
Population characteristics among those positive for IUI and negative for IUI were compared as follows. Continuous variables were expressed as median (IQR), and differences between the two groups were assessed by Mann–Whitney U-test because variable distributions were skewed. Categorical data were expressed as n (%), and a chi-square test was used to compare the differences of the proportion between the two groups.
We examined the associations [odds ratios (OR) and 95% confidence intervals (CI)] of IUI (binary) by quartile of maternal exposure to residential ambient PM2.5 using multivariable logistic regression via PROC GLM in SAS 9.3 (SAS Institute Inc.). ORs were also estimated for PM2.5 exposure as a continuous variable. The following covariates included in the models were chosen a priori based on potential association with PM2.5 exposure and because they are known risk factors for either IUI or preterm birth: maternal smoking status, race, BMI, age at delivery, education level, parity, season of delivery, household income, and sex of the baby [Institute of Medicine (U.S.) Committee on Understanding Premature Birth and Assuring Healthy Outcomes 2007; Astolfi et al. 1999]. All covariates were treated as categorical variables; missing data for each covariate were treated as a separate category. Smoking status was self-reported in response to the interview questionnaire administered at enrollment for four time periods: 3 months before conception and first, second, and third trimesters. Based on these data, smoking was grouped into three categories: never smoking, if no smoking was reported during any period of the pregnancy or the 3 months prior; quit smoking if smoking occurred during the first trimester or the 3 months prior, and continued smoking if smoking occurred continued past the first trimester. Also self-reported at enrollment were race/ethnicity, categorized as Hispanic, white, African/African American, or other; prepregnancy BMI, calculated as reported weight divided by height squared (kg/m2), and categorized as underweight (BMI < 18.5), normal (18.5 ≤ BMI < 25), overweight (25 ≤ BMI < 30), and obese (BMI ≥ 30); age at delivery, categorized into five levels (< 20, 20–24, 25–29, 30–34, and ≥ 35 years); education, categorized as middle school or below, high school, and college or above; parity, categorized as 0 or ≥ 1 live birth before index birth, and annual income treated as a dichotomous variable with income < $25,000 as the reference group. We applied separate models to each of several exposure timing scenarios: maternal exposure 3 months before pregnancy, during the first trimester, during the second trimester, during the third trimester, during the entire pregnancy, and 1 month before birth. Two-sided p-value < 0.05 was the designated significance level. We also examined significance after correcting for multiple comparisons by establishing a more stringent significance level equal to 0.05 divided by 6, the number of exposure periods for which we tested the association between maternal PM2.5 and IUI. When taking into account multiple comparisons, effect estimates were considered to be significant if the p-value was < 0.008.
In addition, we performed several subanalyses to evaluate the robustness of the findings, the results of which are presented in the Supplemental Material. To account for possible confounding by exposure to PM2.5 during other pregnancy periods, we estimated the effect of exposure during each of four exposure periods (preconception, first trimester, second trimester, and third trimester), adjusting for exposure during the other three time periods. If exposure during any of the other three time periods was missing, as it was in subjects who were enrolled near the start or end dates of the study, exposure for the missing periods was assigned to a separate category such that the sample size for each exposure period of interest remained the same in the multiple time–period model as it was in the single time–period model. In addition, we performed a subgroup analysis among participants living within either 4 km or 10 km of a monitor to assess potential bias due to exposure misclassification among participants living greater than those distances from a monitor. We also performed a stratified analysis to examine the consistency or difference of the effect in participants who were African American compared with those who were not. In this analysis, non–African-American participants were grouped to achieve a large enough sample size in both strata. To evaluate modification of the effect by warm or cool season, we performed an additional analysis stratifying subjects exposed from May through September (warm season) and October through April (cool season).
Results
Population Characteristics
Of those with IUI (n = 910), 229 were assessed based on fever only [i.e., histology was negative (n = 82) or missing (n = 147)], 563 based on placenta histology only [i.e., fever was negative (n = 478) or missing (n = 85)], and 118 on both (i.e., histology and fever were positive). Of those with no IUI (n = 4,149), 1,412 were negative for both fever and histology, 2,513 were negative for fever and histology was missing, and 224 were negative for histology and fever was missing. Participants for whom both histology and fever data were missing were excluded from the analysis (n = 583). Placenta pathology data were available for 47.4% of the study population, and fever data were available for 93.9% of the population. In cases when both variables were available, concordance for presence of IUI was 73.2%. IUI was present in 18.0% of the study population. Of 1,567 mothers delivering preterm, 378 (24.1%) were positive for IUI, compared with 532 (15.2%) of 3,492 mothers who carried to term. Among 579 very preterm (< 34 weeks gestation), 217 (37.48%) were positive for IUI.
Population characteristics by IUI status are presented in Table 1. Mothers with IUI at the time of the birth (compared to those without inflammation) tended to be younger, more likely to be smokers, born in the United States, and nulliparous; they were less likely to be Hispanic or have received a college education or higher (Table 1). The ratio of boys to girls was higher among babies born to mothers with IUI than among those born to mothers with no IUI. Also, gestational age at birth and birth weight were lower among mothers with IUI. There was no significant difference in IUI by income categorized as ≥ $25,000 or < $25,000. Data on household income were missing for 40.0% of participants (40.1% missing among those with IUI and 39.5% among those without IUI).
Table 1.
Birth-related covariates and characteristics of the study population.
| Characteristics | No inflammation (n = 4,149) | Inflammation (n = 910) | p-Value |
|---|---|---|---|
| Maternal characteristics | |||
| Age at delivery (years) | 0.031 | ||
| < 20 | 453 (10.92) | 115 (12.64) | |
| 20–24 | 1,030 (24.83) | 256 (28.13) | |
| 25–29 | 1,046 (25.21) | 223 (24.51) | |
| 30–34 | 923 (22.25) | 193 (21.21) | |
| ≥ 35 | 697 (16.80) | 123 (13.52) | |
| Prepregnancy BMI (kg/m2) | 0.737 | ||
| < 18.5 | 191 (4.60) | 40 (4.40) | |
| 18.5–24.9 | 1,943 (46.83) | 430 (47.25) | |
| 25.0–29.9 | 1,150 (27.72) | 242 (26.59) | |
| ≥ 30.0 | 771 (18.58) | 171 (18.79) | |
| Missing | 94 (2.27) | 27 (2.97) | |
| Race/ethnicity | 0.050 | ||
| Hispanic | 1,183 (28.51) | 215 (23.63) | |
| White | 460 (11.09) | 109 (11.98) | |
| African/African American | 2,014 (48.54) | 474 (52.09) | |
| Others | 487 (11.74) | 110 (12.09) | |
| Missing | 5 (0.12) | 2 (0.22) | |
| Smoking during pregnancy | 0.046 | ||
| Never smoking before | 3,287 (79.22) | 684 (75.16) | |
| Quit smoking | 289 (6.97) | 70 (7.69) | |
| Continue smoking | 544 (13.11) | 147 (16.15) | |
| Missing | 29 (0.70) | 9 (0.99) | |
| Education category | 0.010 | ||
| Middle school or below | 1,395 (33.62) | 302 (33.19) | |
| High school | 1,353 (32.61) | 309 (33.96) | |
| College or above | 1,370 (33.02) | 282 (30.99) | |
| Missing | 31 (0.75) | 17 (1.87) | |
| Household income per year | 0.811 | ||
| < $25,000 | 1,794 (43.24) | 404 (44.40) | |
| ≥ $25,000 | 690 (16.63) | 147 (16.15) | |
| Missing | 1,665 (40.13) | 359 (39.45) | |
| Place of birth | < 0.001 | ||
| Non-USA | 2,587 (62.35) | 508 (55.82) | |
| USA | 1,544 (37.21) | 392 (43.08) | |
| Missing | 18 (0.43) | 10 (1.10) | |
| Season at delivery | 0.479 | ||
| Spring (March–May) | 921 (22.20) | 212 (23.30) | |
| Summer (June–August) | 1,043 (25.14) | 213 (23.41) | |
| Autumn (September–November) | 1,091 (26.30) | 255 (28.02) | |
| Winter (December–February) | 1,094 (26.37) | 230 (25.27) | |
| Parity | < 0.001 | ||
| 0 | 1,662 (40.06) | 477 (52.42) | |
| ≥ 1 | 2,483 (59.85) | 433 (47.58) | |
| Missing | 4 (0.10) | 0 (0.00) | |
| Children characteristics | |||
| Sex | 0.003 | ||
| Girl | 2,126 (51.24) | 439 (48.24) | |
| Boy | 2,023 (48.76) | 469 (51.54) | |
| Missing | 0 (0.00) | 2 (0.22) | |
| Gestational age (weeks)a | 38.57 (36.57, 40.00) | 38.14 (34.29, 40.00) | < 0.001 |
| Birth weight (g)a | 2930.0 (2390.0, 3410.0) | 2692.5 (2035.0, 3365.0) | < 0.001 |
| aData did not meet normal distribution and are described as median (IQR), and Mann–Whitney U-test was applied to compare the difference between two groups. | |||
Among all participants included in this analysis, mean maternal age was 28.01 ± 6.54. By race, African Americans were the largest subgroup (49.2%), followed by Hispanics (27.6%). Education varied in the study population: Approximately one-third were educated at the college level or above, a third had completed some high school, and a third were not educated beyond middle school.
The participation rate has been > 90% among mothers approached for recruitment into the larger parent study. Characteristics of the 2,777 Boston Birth Cohort participants excluded from the current analysis for lack of data on IUI (n = 583) or lack of PM2.5 exposure data (n = 2,194) are found in Table S1 and Figure S1. Those excluded were less likely to be < 25 years of age, African American, ever/current smokers, or educated at the college level. Participants excluded were also more likely to be obese, and more likely to have a household income of ≥ $25,000.
Exposure to Ambient PM2.5
Figure 1, a map of the study area, shows individuals’ approximate locations in relation to ambient monitors. Address change occurred during pregnancy in 11.9% of the subjects; the rest remained at the same residential address throughout the pregnancy.
Out of 26 monitors, 13 fit the criteria for inclusion in the study. The average distance of a subject from the nearest monitor was 7.058 ± 6.909 km, and 95% of the subjects’ residential addresses were within 23.4 km of a monitor. 11.39% of the variability in exposures was attributable to monitor site (i.e., spatial variation in exposures). Temporal variability among women assigned to the same monitor accounted for 88.61% of the total variability.
Ambient PM2.5 exposures over the entire pregnancy ranged from 5.54 to 29.00 μg/m3, with an IQR of 3.31 μg/m3 (Table 2). Exposures decreased over the study period (see Figure S2). Participants who were enrolled within 1 year of the start or end of the study period were consequently missing exposure data for one or more periods before or during pregnancy; therefore, the number of subjects varies by exposure period.
Table 2.
Associations between maternal exposure to ambient PM2.5 (quartile) and odds of IUI in the study population.
| PM2.5 (μg/m3) | n | Cases (%) | Crude | Adjusted | ||
|---|---|---|---|---|---|---|
| OR (95%CI) | p-Value | OR (95%CI) | p-Value | |||
| Preconception | ||||||
| 1.2–9.06 | 1,212 | 182 (15.00) | 1.00 (1.00, 1.00) | Referent | 1.00 (1.00, 1.00) | Referent |
| 9.07–10.85 | 1,212 | 194 (16.00) | 1.08 (0.87, 1.34) | 0.501 | 1.10 (0.88, 1.38) | 0.487 |
| 10.86–12.73 | 1,213 | 210 (17.30) | 1.18 (0.95, 1.47) | 0.125 | 1.18 (0.94, 1.48) | 0.154 |
| 12.73–29.00 | 1,212 | 255 (21.00) | 1.51 (1.22, 1.86) | < 0.001 | 1.52 (1.22, 1.89) | < 0.001* |
| Per IQR = 3.67 | 1.05 (0.97, 1.13) | 0.239 | 1.05 (0.97, 1.14) | 0.230 | ||
| 1st trimester | ||||||
| 4.16–8.99 | 1,239 | 171 (13.80) | 1.00 (1.00, 1.00) | Referent | 1.00 (1.00, 1.00) | Referent |
| 9.00–10.95 | 1,228 | 180 (14.70) | 1.07 (0.86, 1.35) | 0.543 | 1.11 (0.88, 1.40) | 0.361 |
| 10.96–12.72 | 1,234 | 225 (18.20) | 1.39 (1.12, 1.73) | 0.003 | 1.41 (1.13, 1.77) | 0.003* |
| 12.72–27.72 | 1,233 | 288 (23.40) | 1.90 (1.55, 2.35) | < 0.001 | 1.93 (1.55, 2.40) | < 0.001* |
| Per IQR = 3.73 | 1.27 (1.17, 1.39) | < 0.001 | 1.30 (1.19, 1.42) | < 0.001* | ||
| 2nd trimester | ||||||
| 4.44–8.97 | 1,249 | 183 (14.70) | 1.00 (1.00, 1.00) | Referent | 1.00 (1.00, 1.00) | Referent |
| 8.98–10.96 | 1,250 | 194 (15.50) | 1.07 (0.86, 1.33) | 0.544 | 1.07 (0.85, 1.34) | 0.568 |
| 10.97–12.58 | 1,246 | 238 (19.10) | 1.38 (1.11, 1.70) | 0.003 | 1.39 (1.11, 1.74) | 0.004* |
| 12.58–52.90 | 1,251 | 280 (22.40) | 1.68 (1.37, 2.06) | < 0.001 | 1.67 (1.35, 2.08) | < 0.001* |
| Per IQR = 3.61 | 1.30 (1.20, 1.42) | < 0.001 | 1.31 (1.20, 1.43) | < 0.001* | ||
| 3rd trimester | ||||||
| 3.20–8.85 | 1,244 | 192 (15.40) | 1.00 (1.00, 1.00) | Referent | 1.00 (1.00, 1.00) | Referent |
| 8.86–10.85 | 1,244 | 187 (15.00) | 0.97 (0.78, 1.21) | 0.780 | 0.99 (0.79, 1.24) | 0.902 |
| 10.86–12.66 | 1,244 | 205 (16.50) | 1.08 (0.87, 1.34) | 0.477 | 1.08 (0.86, 1.36) | 0.496 |
| 12.66–39.30 | 1,244 | 273 (21.90) | 1.54 (1.26, 1.89) | < 0.001 | 1.53 (1.24, 1.90) | < 0.001* |
| Per IQR = 3.82 | 1.09 (1.00, 1.19) | 0.041 | 1.09 (1.00, 1.19) | 0.055 | ||
| Whole pregnancy | ||||||
| 5.54–9.11 | 1,264 | 195 (15.40) | 1.00 (1.00, 1.00) | Referent | 1.00 (1.00, 1.00) | Referent |
| 9.12–11.06 | 1,265 | 175 (13.80) | 0.88 (0.71, 1.10) | 0.257 | 0.94 (0.75, 1.18) | 0.584 |
| 11.07–12.42 | 1,265 | 217 (17.20) | 1.14 (0.92, 1.40) | 0.240 | 1.16 (0.93, 1.46) | 0.186 |
| 12.42–29.00 | 1,265 | 323 (25.50) | 1.88 (1.54, 2.29) | < 0.001 | 1.92 (1.55, 2.37) | < 0.001* |
| Per IQR = 3.31 | 1.38 (1.26, 1.50) | < 0.001 | 1.41 (1.29, 1.54) | < 0.001* | ||
| The last month before delivery | ||||||
| 2.26–8.61 | 1,243 | 196 (15.80) | 1.00 (1.00, 1.00) | Referent | 1.00 (1.00, 1.00) | Referent |
| 8.62–10.59 | 1,242 | 200 (16.10) | 1.03 (0.83, 1.27) | 0.820 | 1.05 (0.84, 1.31) | 0.667 |
| 10.60–13.09 | 1,244 | 253 (20.30) | 1.36 (1.11, 1.68) | 0.003 | 1.44 (1.16, 1.79) | 0.001* |
| 13.09–52.90 | 1,244 | 243 (19.50) | 1.30 (1.05, 1.60) | 0.014 | 1.41 (1.13, 1.77) | 0.003* |
| Per IQR = 4.48 | 1.14 (1.05, 1.23) | 0.002 | 1.13 (1.04, 1.23) | 0.004* | ||
| Adjusted for maternal smoking status during pregnancy, maternal race/ethnicity, maternal age at delivery, maternal prepregnancy BMI, maternal education level, sex of baby, parity, season of delivery. *Significant after Bonferroni correction for multiple comparisons (p < 0.008). | ||||||
Association between Maternal Exposure to PM2.5 and IUI
Comparing the highest with the lowest PM2.5 exposure quartiles, PM2.5 was positively associated with IUI during all exposure periods, including exposure during the 3 months before conception, both before and after adjusting for relevant covariates (Table 2, Figure 2). The effect estimates were similar across different exposure periods, though associations were strongest for PM2.5 exposure during the first trimester and over the entire pregnancy (OR = 1.93; 95% CI: 1.55, 2.40 and OR = 1.92; 95% CI: 1.55, 2.37 for the highest versus lowest quartiles during each time period, respectively). When ORs were modeled per IQR increase in PM2.5 exposure, the association was significant at the α = 0.008 level for the periods of the first trimester, second trimester, the entire pregnancy, and the last month before delivery.
Figure 2.
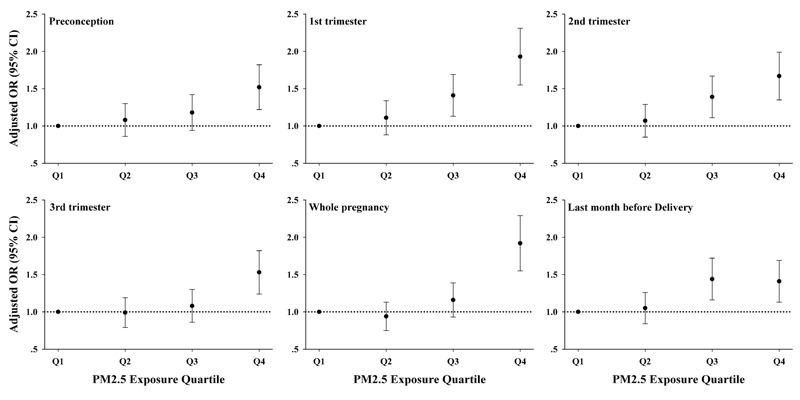
Adjusted ORs quantifying associations between PM2.5 exposure and IUI by quartile and period of prepregnancy or pregnancy in 5,059 mothers from 1999 to 2012.
After adjusting for exposure to PM2.5 during the other exposure periods (in addition to all other covariates already in the model), the ORs by quartile and per IQR for the first trimester of pregnancy were consistent with ORs estimated by the single time period model (see Table S2). The OR comparing the fourth and first quartiles of exposure during the first trimester was significant at the 0.008 level (OR = 1.85; 95% CI: 1.37, 2.50 for the multiple time–period model and OR = 1.93; 95% CI: 1.55, 2.40, for the single time–period model). ORs by quartile of exposure during the second trimester were no longer significant after adjusting for other periods of exposure; the OR per IQR was still significant. ORs by quartiles and per IQR were near or below the null for both the period before the pregnancy and the third trimester, after adjusting for exposure during the other three time periods. Exposures to PM2.5 during the six time periods examined were moderately to highly correlated (Spearman coefficients 0.43–0.86) (see Table S3). The highest correlations were observed between exposures during the period of the entire pregnancy and each of the three trimesters (Spearman ρ = 0.76–0.86). The correlation between exposures during first and third trimesters was also moderate to high (Spearman ρ = 0.71).
To assess bias due to exposure misclassification among participants located furthest from a monitor, we ran our models in subgroups living within 10 km [n = 4,357 (768 cases)] and 4 km [n = 1,719 (n = 307 cases)] of an ambient PM2.5 monitor. Effect estimates in these two subgroups (see Tables S4 and S5) were consistent with results of our main model (Table 2). The association was strongest for exposure during the first trimester among participants within 4 km of a monitor (OR = 2.15; 95% CI: 1.47, 3.14 for the highest versus lowest quartile, compared with OR = 1.93; 95% CI: 1.55, 2.40 for the total study population).
In a stratified analysis to evaluate differences by race/ethnicity, the relationship between maternal exposure to PM2.5 and IUI was generally consistent across African-American and non–African-American participants (see Table S6). There were no consistent differences in associations by subgroup. Associations between IUI and PM2.5 exposure during trimesters 1 and 2 and the entire pregnancy were also generally robust to stratification by warm and cold months (see Table S7), with a few exceptions. Exposure to PM2.5 during preconception during the warm season was not significantly associated with IUI. Conversely, PM2.5 during the third trimester during the cold season was not significantly associated with IUI.
In a stratified analysis by two study periods, 1999–2005 and 2006–2012, exposures to PM2.5 were generally higher in the early period, during which 3,368 (66.6%) of the participants including 664 (72.3%) of the cases were recruited, compared with the later period. The effect estimates in the early period were consistent with findings of the main analysis (see Table S8). The strongest associations in this stratum were seen for exposure during the first trimester (OR = 2.30; 95% CI: 1.58, 3.34) and over the entire pregnancy (OR = 2.57; 95% CI: 1.75, 3.76). No association was observed in the low exposure period (2006–2012), but it should be noted that the same cut points between exposure quartiles were applied in both strata, and thus there were a low number of subjects in the third and fourth quartiles of exposure during the later period.
Discussion
Summary of Results
IUI is a risk factor for preterm birth, low birth weight, and poor respiratory outcomes in early childhood [Gupta et al. 2007; Institute of Medicine (U.S.) Committee on Understanding Premature Birth and Assuring Healthy Outcomes 2007; Kumar et al. 2008; Mestan et al. 2010]. The etiology of these conditions is poorly understood, and inflammation is thought to play a role. Using placenta histopathology and intrapartum fever data from the Boston Birth Cohort, a cohort of mother–infant pairs from an at-risk urban and mostly minority population, we investigated the relationship between exposure to ambient PM2.5 just before and during pregnancy and IUI. Comparing the highest with the lowest PM2.5 exposure quartiles, the association was significant for all periods of the pregnancy considered. Associations were generally consistent between African-American and non–African-American participants.
The strongest association was observed for periods of the first trimester and the entire pregnancy. This suggests that early pregnancy may be a window of susceptibility to effects of PM2.5 on IUI. Moderate to strong positive correlations between exposures during different periods of pregnancy limited our ability to estimate associations that were specific to exposures at different periods of the pregnancy in the single time–point models used in our main analysis. When exposures during multiple time points (i.e, pregnancy periods) were included in the model, the association was still the strongest in the first trimester, supporting the results of the single time–point model. The results of the multiple time–point model should be interpreted with caution due to collinearity in the model resulting from correlation between exposures during different periods.
By treating exposure as a categorical variable (quartiles), we were able to explore the association between maternal PM2.5 exposure and IUI without imposing linearity. We did not observe a threshold of exposure-effect at the levels at which our population was exposed. Estimated exposures to PM2.5 during the period of the entire pregnancy were below the federal annual standard of 12 μg/m3 in 68.61% of the participants included in this analysis. For the first and second trimesters, ORs were significant when comparing quartile 3 to quartile 1, even though quartile 3 included subjects exposed at concentrations < 12 μg/m3. The current National Ambient Air Quality Standard for PM2.5, last revised in 2013, is based on associated risks in adults including premature mortality and chronic respiratory disease (U.S. EPA 2013). Risks to the fetus were considered in the ruling, but the evidence available at the time of the final ruling was considered to be emerging. Our findings add to a growing body of literature suggesting that pregnant women are a sensitive subpopulation that must be considered during review of the PM2.5 standard, because there is increasing evidence that PM2.5 exposures near or below the current standard may have adverse effects on the mother and developing fetus.
The annual mean of the daily ambient PM2.5 concentration in Boston at the start of the study period was 16.3 μg/m3, decreasing to an annual mean of 9.5 μg/m3 in 2012 during the study period (U.S. EPA 2015a). These exposure levels are low compared with those in more highly polluted cities inside and outside the United States, such as Fresno, California (44.6 μg/m3 in 2012), Dehli, India (153 μg/m3 in 2013), and Beijing, China (56 μg/m3) (U.S. EPA 2015b; WHO 2014). For this reason, it is remarkable that we observed a significant effect on IUI despite the relatively low level of exposure in this population.
Comparison with Other Studies
The need for placental tissue histology and clinical data for IUI detection makes study of IUI challenging. The association between air pollution and IUI has not been assessed previously in humans, so we cannot compare our findings to other studies of this exposure and outcome. However, because IUI is a risk factor for preterm birth, we can view our findings in the context of studies of PM2.5 exposure during pregnancy and preterm birth. The first trimester has emerged as an exposure window of interest; significant associations between exposure to PM2.5 during first trimester and preterm birth have been reported in several studies (Lee et al. 2013; Pereira et al. 2014; Rappazzo et al. 2014).
In addition, exposure to particulate matter early on in pregnancy has been reported to be associated with elevated maternal blood C-reactive protein levels in early pregnancy in studies conducted in the United States and the Netherlands (Lee et al. 2011; van den Hooven et al. 2012a). In the latter study, exposure to particulate matter and NO2 were associated with elevated fetal (cord blood) C-reactive protein as well as blood biomarkers consistent with adverse changes in placental growth and function (van den Hooven et al. 2012a, 2012b).
Strengths and Limitations
Restriction to a single city limits the generalizability of our results, because the proportion of PM2.5 from regional and local sources varies by geographic location, which affects the elemental composition of PM at the city level. In Boston, regional sources (i.e., coal burning power plants) are the greatest contributor to PM2.5, accounting for about half of PM2.5 from all sources (Masri et al. 2015).
Our exposure assessment methodology does not account for differences in exposures due to variation in distance from a stationary monitor. However, > 85% of our population lived within 10 km of a monitor, and exposure estimates for PM2.5 concentrations from spatial models do not change substantially at a resolution of < 10 km2 due to the homogenous distribution of fine particulate matter over this area (Kloog et al. 2012). The consistency of our results when we ran the analysis in subgroups of subjects within 10 km and 4 km of a monitor also suggests that variation in subject distance from ambient monitors did not bias our exposure estimates.
By adjusting for season in the model, we may have accounted for some confounding by temporally varying factors for which we did not have direct measurements, such as seasonal influenza and respiratory syncytial virus. However, some residual confounding by temporally varying factors may be unaccounted for.
IUI was assessed cross-sectionally in our study and thus does not provide insight into the dynamics of IUI before the time of birth. Due to the invasive nature of available methods for identifying IUI, little is known about whether IUI identified at birth represents recent or chronic IUI, and whether IUI might be present at earlier periods, but not at birth. The strong associations between PM2.5 exposure during the first trimester or over the entire pregnancy with IUI suggest that the first trimester may be an important window of exposure for IUI and that chronic exposure may also be important. Data on IUI before birth, if they were available, would help to elucidate the temporal relationship between PM2.5 exposure and development of IUI.
Though the placenta histopathology at birth provides a snapshot at one point in time, the use of these data to define IUI is a strength of the study because histopathology captures subclinical and less severe inflammation which may not be detected by other methods such as bacterial culture of amniotic fluid or diagnosis of IUI solely based on fever at parturition. Data on fever were more widely available in the study population than histopathology data. Though fever at parturition is a validated criterion for clinical diagnosis of intrauterine infection (Gibbs et al. 1982), it may be present for reasons other than IUI, or may not be present even when there is histologic evidence of IUI (Goldenberg et al. 2000). As a result, the potential exists for false positives and false negatives among individuals with data on fever but no histopathology data.
The placement of 2,024 (40.0%) participants for whom no income data were available in a missing category is a potential source of bias in our estimates. As the high proportion of participants in the study who qualify for Medicaid (> 90%) reflects, household income is relatively homogeneous among study participants, which may have reduced potential bias due to missing income data.
We also stratified by cool and warm seasons, which serves the purpose of accounting for differences in PM2.5 composition during those periods. The findings of the stratified analysis were consistent with the main analysis, and consistent across warm and cold periods, for the three periods for which we saw a strong associations (first trimester, second trimester, and whole pregnancy). This strengthens our confidence that the observed associations between PM2.5 exposure and IUI are robust.
A strength of the study was the use of questionnaire data to account for changes in smoking status or residential address during periods of preconception and pregnancy. Despite adjustment for a wide range of covariates including smoking, some residual confounding from unidentified sources may have not been accounted for in our model. Likewise, data on changes in residential address reduced exposure misclassification, though some likely remains due to other factors such as lack of information on exposures at locations other than the residence where participants spent time and the use of a stationary ambient monitor as a surrogate for personal exposure.
Conclusions
Despite a relatively low level of exposure, our results suggest a monotonic positive relationship relationship between PM2.5 exposure during preconception and each trimester of pregnancy and IUI at birth. Our findings suggest that IUI may be a sensitive biomarker for assessing early biological effect of PM2.5 exposure on the developing fetus, which may in turn influence subsequent growth, development, and health outcomes.
Editor’s Note: In the Advance Publication, data points in Figure 2 were located incorrectly on the graphs. The corrected Figure 2 is included in this article and now matches the adjusted odds ratio data in Table 2 . The authors regret this error.
Supplemental Material
Acknowledgments
We wish to thank all of the study participants, and the Boston Medical Center Labor and Delivery Nursing Staff for their support and help with the study. We are also grateful for the dedication and hard work of the field team at the Department of Pediatrics, Boston University School of Medicine.
Footnotes
The Boston Birth Cohort (the parent study) is supported in part by the March of Dimes Perinatal Epidemiology Research Initiative (PERI) (grants 20-FY02-56 and 21-FY07-605), and the National Institutes of Health (NIH; grants R21ES011666, R01HD041702, R21HD066471, and T32ES007141). S.B. is supported by National Institute of Environmental Health Sciences–sponsored grant U91ES06721. We wish to acknowledge generous philanthropic support from The Ludwig Family Foundation and the Zanvyl Krieger Endowment.
The sponsors had no role in the design and/or conduct of the study; in the collection, analysis, and interpretation of the data; or in the preparation, review, and approval of the manuscript.
The authors declare they have no actual or potential competing financial interests.
References
- Astolfi P, Zonta LA. Risks of preterm delivery and association with maternal age, birth order and fetal gender. Hum Reprod. 1999;14:2891–2894. doi: 10.1093/humrep/14.11.2891. [DOI] [PubMed] [Google Scholar]
- Backes CH, Nelin T, Gorr MW, Wold LE. 2013. Early life exposure to air pollution: how bad is it? Toxicol Lett 216 1 47 53, doi: 10.1016/j.toxlet.2012.11.007 [DOI] [PMC free article] [PubMed] [Google Scholar]
- Bell ML, Ebisu K, Belanger K. 2007. Ambient air pollution and low birth weight in Connecticut and Massachusetts. Environ Health Perspect 115 1118 1124, doi: 10.1289/ehp.9759 [DOI] [PMC free article] [PubMed] [Google Scholar]
- Benirschke KKP, Kaufmann P, Baergen R. New York: Springer; 2000. Pathology of the Human Placenta. [Google Scholar]
- Brauer M, Lencar C, Tamburic L, Koehoorn M, Demers P, Karr C. 2008. A cohort study of traffic-related air pollution impacts on birth outcomes. Environ Health Perspect 116 680 686, doi: 10.1289/ehp.10952 [DOI] [PMC free article] [PubMed] [Google Scholar]
- Culhane JF, Goldenberg RL. 2011. Racial disparities in preterm birth. Semin Perinatol 35 4 234 239, doi: 10.1053/j.semperi.2011.02.020 [DOI] [PubMed] [Google Scholar]
- Dadvand P, Basagaña X, Figueras F, Martinez D, Beelen R, Cirach M, et al. 2014. Air pollution and preterm premature rupture of membranes: a spatiotemporal analysis. Am J Epidemiol 179 2 200 207, doi: 10.1093/aje/kwt240 [DOI] [PubMed] [Google Scholar]
- de Melo JO, Soto SF, Katayama IA, Wenceslau CF, Pires AG, Veras MM, et al. 2015. Inhalation of fine particulate matter during pregnancy increased IL-4 cytokine levels in the fetal portion of the placenta. Toxicol Lett 232 2 475 480, doi: 10.1016/j.toxlet.2014.12.001 [DOI] [PubMed] [Google Scholar]
- Fleischer NL, Merialdi M, van Donkelaar A, Vadillo-Ortega F, Martin RV, Betran AP, et al. 2014. Outdoor air pollution, preterm birth, and low birth weight: analysis of the World Health Organization global survey on maternal and perinatal health. Environ Health Perspect 122 425 430, doi: 10.1289/ehp.1306837 [DOI] [PMC free article] [PubMed] [Google Scholar]
- Gehring U, Wijga AH, Fischer P, de Jongste JC, Kerkhof M, Koppelman GH, et al. 2011. Traffic-related air pollution, preterm birth and term birth weight in the PIAMA birth cohort study. Environ Res 111 1 125 135, doi: 10.1016/j.envres.2010.10.004 [DOI] [PubMed] [Google Scholar]
- Gibbs RS, Blanco JD, St Clair PJ, Castaneda YS. Quantitative bacteriology of amniotic fluid from women with clinical intraamniotic infection at term. J Infect Dis. 1982;145(1):1–8. doi: 10.1093/infdis/145.1.1. [DOI] [PubMed] [Google Scholar]
- Goldenberg RL, Culhane JF, Iams JD, Romero R. 2008. Epidemiology and causes of preterm birth. Lancet 371 75 84, doi: 10.1016/S0140-6736(08)60074-4 [DOI] [PMC free article] [PubMed] [Google Scholar]
- Goldenberg RL, Hauth JC, Andrews WW. 2000. Intrauterine infection and preterm delivery. N Engl J Med 342 20 1500 1507, doi: 10.1056/NEJM200005183422007 [DOI] [PubMed] [Google Scholar]
- Gupta M, Mestan KK, Martin CR, Pearson C, Ortiz K, Fu L, et al. 2007. Impact of clinical and histologic correlates of maternal and fetal inflammatory response on gestational age in preterm births. J Matern Fetal Neonatal Med 20 1 39 46, doi: 10.1080/14767050601156861 [DOI] [PubMed] [Google Scholar]
- Hajat A, Allison M, Diez-Roux AV, Jenny NS, Jorgensen NW, Szpiro AA, et al. Long-term exposure to air pollution and markers of inflammation, coagulation, and endothelial activation: a repeat-measures analysis in the Multi-Ethnic Study of Atherosclerosis (MESA). Epidemiology. 2015;26:310–320. doi: 10.1097/EDE.0000000000000267. [DOI] [PMC free article] [PubMed] [Google Scholar]
- Incerpi MH. In: Management of Common Problems in Obstetrics and Gynecology. (Goodwin TM, Montoro MN, Muderspach L, Paulson R, Roy S, eds) Oxford, UK: Blackwell Publishing Ltd; 2010. Chorio-amnionitis and postpartum endometritis. pp. 48–51. [Google Scholar]
- Institute of Medicine (U.S.) Committee on Understanding Premature Birth and Assuring Healthy Outcomes. Washington, DC: National Academies Press; 2007. Preterm Birth: Causes, Consequences, and Prevention. [Google Scholar]
- Jalaludin B, Mannes T, Morgan G, Lincoln D, Sheppeard V, Corbett S. 2007. Impact of ambient air pollution on gestational age is modified by season in Sydney, Australia. Environ Health 6 16, doi: 10.1186/1476-069X-6-16 [DOI] [PMC free article] [PubMed] [Google Scholar]
- Jones MR, Diez-Roux AV, Hajat A, Kershaw KN, O’Neill MS, Guallar E, et al. 2014. Race/ethnicity, residential segregation, and exposure to ambient air pollution: the Multi-Ethnic Study of Atherosclerosis (MESA). Am J Public Health 104 11 2130 2137, doi: 10.2105/AJPH.2014.302135 [DOI] [PMC free article] [PubMed] [Google Scholar]
- Kloog I, Melly SJ, Ridgway WL, Coull BA, Schwartz J. 2012. Using new satellite based exposure methods to study the association between pregnancy PM2.5 exposure, premature birth and birth weight in Massachusetts. Environ Health 11 40, doi: 10.1186/1476-069X-11-40 [DOI] [PMC free article] [PubMed] [Google Scholar]
- Kumar R, Yu Y, Story RE, Pongracic JA, Gupta R, Pearson C, et al. 2008. Prematurity, chorioamnionitis, and the development of recurrent wheezing: a prospective birth cohort study. J Allergy Clin Immunol 121 4 878 84.e6, doi: 10.1016/j.jaci.2008.01.030 [DOI] [PMC free article] [PubMed] [Google Scholar]
- Langston C, Kaplan C, Macpherson T, Manci E, Peevy K, Clark B, et al. Practice guideline for examination of the placenta: developed by the Placental Pathology Practice Guideline Development Task Force of the College of American Pathologists. Arch Pathol Lab Med. 1997;121(5):449–476. [PubMed] [Google Scholar]
- Le HQ, Batterman SA, Wirth JJ, Wahl RL, Hoggatt KJ, Sadeghnejad A, et al. 2012. Air pollutant exposure and preterm and term small-for-gestational-age births in Detroit, Michigan: long-term trends and associations. Environ Int 44 7 17, doi: 10.1016/j.envint.2012.01.003 [DOI] [PMC free article] [PubMed] [Google Scholar]
- Lee PC, Roberts JM, Catov JM, Talbott EO, Ritz B. 2013. First trimester exposure to ambient air pollution, pregnancy complications and adverse birth outcomes in Allegheny County, PA. Matern Child Health J 17 3 545 555, doi: 10.1007/s10995-012-1028-5 [DOI] [PMC free article] [PubMed] [Google Scholar]
- Lee PC, Talbott EO, Roberts JM, Catov JM, Sharma RK, Ritz B. Particulate air pollution exposure and C-reactive protein during early pregnancy. Epidemiology. 2011;22(4):524–531. doi: 10.1097/EDE.0b013e31821c6c58. [DOI] [PMC free article] [PubMed] [Google Scholar]
- Malmqvist E, Rignell-Hydbom A, Tinnerberg H, Björk J, Stroh E, Jakobsson K, et al. 2011. Maternal exposure to air pollution and birth outcomes. Environ Health Perspect 119 553 558, doi: 10.1289/ehp.1002564 [DOI] [PMC free article] [PubMed] [Google Scholar]
- Masri S, Kang CM, Koutrakis P. Composition and sources of fine and coarse particles collected during 2002–2010 in Boston, MA. J Air Waste Manag Assoc. 2015;65(3):287–297. doi: 10.1080/10962247.2014.982307. [DOI] [PMC free article] [PubMed] [Google Scholar]
- Mestan K, Yu Y, Matoba N, Cerda S, Demmin B, Pearson C, et al. 2010. Placental inflammatory response is associated with poor neonatal growth: preterm birth cohort study. Pediatrics 125 4 e891 e898, doi: 10.1542/peds.2009-0313 [DOI] [PubMed] [Google Scholar]
- Muglia LJ, Katz M. 2010. The enigma of spontaneous preterm birth. N Engl J Med 362 6 529 535, doi: 10.1056/NEJMra0904308 [DOI] [PubMed] [Google Scholar]
- Pereira G, Belanger K, Ebisu K, Bell ML. 2014. Fine particulate matter and risk of preterm birth in Connecticut in 2000–2006: a longitudinal study. Am J Epidemiol 179 1 67 74, doi: 10.1093/aje/kwt216 [DOI] [PMC free article] [PubMed] [Google Scholar]
- Rappazzo KM, Daniels JL, Messer LC, Poole C, Lobdell DT. 2014. Exposure to fine particulate matter during pregnancy and risk of preterm birth among women in New Jersey, Ohio, and Pennsylvania, 2000–2005. Environ Health Perspect 122 992 997, doi: 10.1289/ehp.1307456 [DOI] [PMC free article] [PubMed] [Google Scholar]
- Ritz B, Wilhelm M, Hoggatt KJ, Ghosh JK. 2007. Ambient air pollution and preterm birth in the environment and pregnancy outcomes study at the University of California, Los Angeles. Am J Epidemiol 166 9 1045 1052, doi: 10.1093/aje/kwm181 [DOI] [PubMed] [Google Scholar]
- Ritz B, Yu F, Chapa G, Fruin S. Effect of air pollution on preterm birth among children born in Southern California between 1989 and 1993. Epidemiology. 2000;11(5):502–511. doi: 10.1097/00001648-200009000-00004. [DOI] [PubMed] [Google Scholar]
- Simmonds M, Jeffery H, Watson G, Russell P. 2004. Intraobserver and interobserver variability for the histologic diagnosis of chorioamnionitis. Am J Obstet Gynecol 190 1 152 155, doi: 10.1016/S0002-9378(03)00870-6 [DOI] [PubMed] [Google Scholar]
- Slama R, Darrow L, Parker J, Woodruff TJ, Strickland M, Nieuwenhuijsen M, et al. 2008. Meeting report: atmospheric pollution and human reproduction. Environ Health Perspect 116 791 798, doi: 10.1289/ehp.11074 [DOI] [PMC free article] [PubMed] [Google Scholar]
- U.S. EPA (U.S. Environmental Protection Agency) National Ambient Air Quality Standards for particulate matter; final rule. Fed Reg. 2013;78(10):3086–3287. [Google Scholar]
- U.S. EPA. Air Quality Statistics Report. 2015a Available: http://www.epa.gov/airquality/airdata/ad_rep_con.html [accessed 25 August 2015]
- U.S. EPA. National Trends in Particulate Matter Levels. 2015b Available: http://www.epa.gov/airtrends/pm.html [accessed 25 August 2015]
- van den Hooven EH, de Kluizenaar Y, Pierik FH, Hofman A, van Ratingen SW, Zandveld PY, et al. 2012a. Chronic air pollution exposure during pregnancy and maternal and fetal C-reactive protein levels: the Generation R Study. Environ Health Perspect 120 746 751, doi: 10.1289/ehp.1104345 [DOI] [PMC free article] [PubMed] [Google Scholar]
- van den Hooven EH, Pierik FH, de Kluizenaar Y, Hofman A, van Ratingen SW, Zandveld PY, et al. 2012b. Air pollution exposure and markers of placental growth and function: the Generation R Study. Environ Health Perspect 120 1753 1759, doi: 10.1289/ehp.1204918 [DOI] [PMC free article] [PubMed] [Google Scholar]
- Wang X, Ding H, Ryan L, Xu X. Association between air pollution and low birth weight: a community-based study. Environ Health Perspect. 1997;105:514–520. doi: 10.1289/ehp.97105514. [DOI] [PMC free article] [PubMed] [Google Scholar]
- Wang X, Zuckerman B, Pearson C, Kaufman G, Chen C, Wang G, et al. 2002. Maternal cigarette smoking, metabolic gene polymorphism, and infant birth weight. JAMA 287 2 195 202, doi: 10.1001/jama.287.2.195 [DOI] [PubMed] [Google Scholar]
- WHO (World Health Organization) Bonn, Germany: WHO; 2003. Health Aspects of Air Pollution with Particulate Matter, Ozone and Nitrogen Dioxide. Report on a WHO Working Group. EUR/03/5042688. Available: http://www.euro.who.int/document/e79097.pdf [accessed 25 August 2015] [Google Scholar]
- WHO. Ambient (Outdoor) Air Pollution in Cities Database 2014. 2014 Available: http://www.who.int/phe/health_topics/outdoorair/databases/cities/en/ [accessed 25 August 2015]
- Wright RJ, Brunst KJ. 2013. Programming of respiratory health in childhood: influence of outdoor air pollution. Curr Opin Pediatr 25 2 232 239, doi: 10.1097/MOP.0b013e32835e78cc [DOI] [PubMed] [Google Scholar]
- Xu X, Ding H, Wang X. 1995. Acute effects of total suspended particles and sulfur dioxides on preterm delivery: a community-based cohort study. Arch Environ Health 50 6 407 415, doi: 10.1080/00039896.1995.9935976 [DOI] [PubMed] [Google Scholar]
Associated Data
This section collects any data citations, data availability statements, or supplementary materials included in this article.