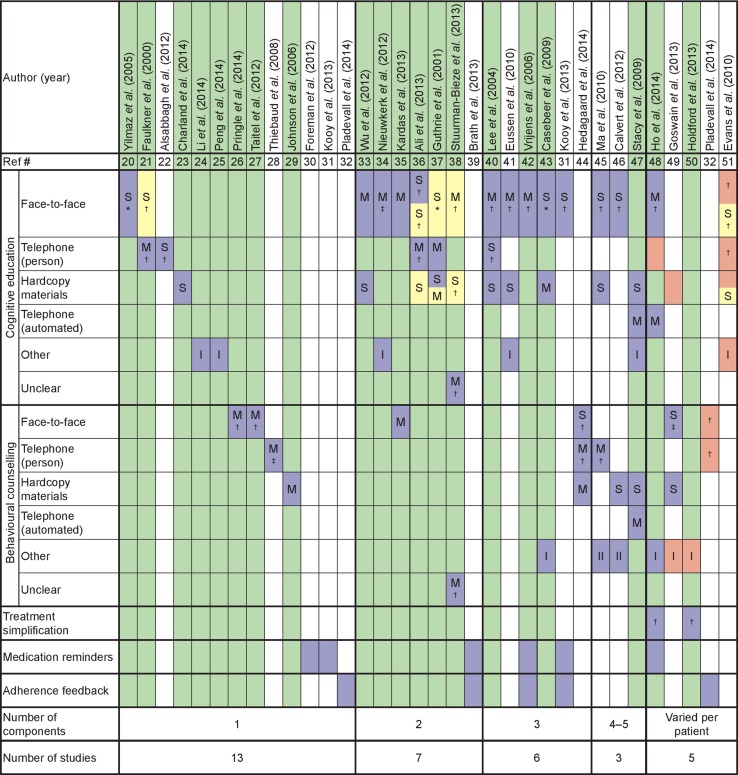
Fig. 2.
Combinations of components used in intervention groups (n = 34) to try to improve adherence to statins. Each column represents one intervention group. Intervention groups are ranked by the number of components involved. Components in each intervention group are illustrated by blue boxes (those in yellow boxes were applied to both the intervention group and the control group). Pink boxes highlight components that were not applied to all patients in the intervention group. Columns with interventions associated with a significant improvement in at least one measure of adherence are highlighted in green. Letters in boxes denote whether the component was used a single time (S) or multiple times (M). Symbols indicate who delivered the intervention: *physician; †pharmacist; and ‡nurse. Roman numerals indicate the number of ‘other’ intervention components used. The full text of the descriptions of the interventions used in each study in relation to how they were categorized is provided in Supplementary Table 1 (online)

