Abstract
Phosphorylation is one of the most important protein post-translation modifications. With the rapid development of high-throughput mass spectrometry, phosphorylation site data is rapidly accumulating, which provides us an opportunity to systematically investigate and predict phosphorylation in proteins. The phosphorylation of threonine is the addition of a phosphoryl group to its polar side chains group. In this work, we statistically analyzed the distribution of the different properties including position conservation, secondary structure, accessibility and some other physicochemical properties of the residues surrounding the phosphothreonine site and non-phosphothreonine site. We found that the distributions of those features are non-symmetrical. Based on the distribution of properties, we developed a new model by using optimal window size strategy and feature selection technique. The cross-validated results show that the area under receiver operating characteristic curve reaches to 0.847, suggesting that our model may play a complementary role to other existing methods for predicting phosphothreonine site in proteins.
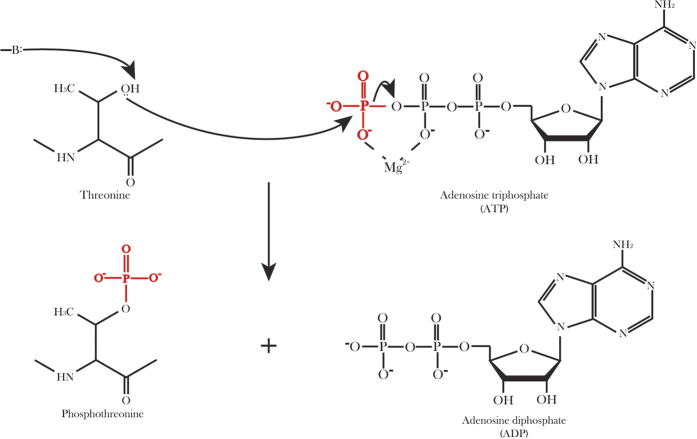
Reversible phosphorylation of protein is an important regulatory mechanism that occurs in both prokaryotic and eukaryotic organisms1,2. It is required in the majority of physiological and pathological processes, such as cell signaling transduction, neural activity, etc. In eukaryotic proteins, more than 30% of proteins are estimated to undergo the reversible phosphorylation3. Phosphorylation results in a conformational change in the structure of these proteins in many enzymes and receptors and causes them to become activated or deactivated. Phosphorylation is a process that a phosphoryl group of adenosine triphosphate (ATP) is transferred to some special amino acid residues, thereby generating adenosine diphosphate (ADP)4 as shown in Fig. 1. Phosphorylation usually occurs on serine (S), threonine (T) and tyrosine (Y) residues in eukaryotic proteins.
Figure 1. The schematic diagram of threonine phosphorylation.
Enzyme-catalyzed proton transfer from the nucleophilic ( ) group on threonine attacks the γ-phosphate (
 ) group on ATP, resulting in transfer of the phosphate group to threonine to form phosphothreonine and ADP, while this transfer is facilitated by magnesium (Mg2+) and threonine kinase. (
 ) indicates the enzyme base that initiates proton transfer.
There are several experimental ways to discover protein phosphorylation sites. High throughput Mass Spectrometry (MS) is one of the most popular technique5. However, the experimental method is time-consuming and inefficient, thereby a series of excellent algorithms are used in phosphorylation site prediction, such as Artificial Neural Network (ANN)6 and Support Vector Machines (SVM)7 etc. Some excellent webserver for phosphorylation site predictors have been constructed based on these algorithms. For example, Ingrell et al.8 developed NetPhosYeast to predict yeast-specific phosphorylation site based on neural network method. Lin et al.9 developed a rice-specific SVM predictor called Rice_Phospho by combining amino acid occurrence frequency with composition of k-spaced amino acid pairs. To identify kinase-specific phosphorylation site, Huang et al.10 developed a kinase-specific phosphorylation site prediction tool called KinasePhos based on the profile hidden Markov model. Recently, a wonderful web server called GPS (Group-based phosphorylation Predicting and Scoring)11,12 was constructed to identify ~70 kinds of kinase-specific phosphorylation site with higher prediction robustness. Although there are many available predictors for phosphothreonine site prediction, two essential issues have remained elusive: amino acid sequence window size is a very important factor for pattern prediction, and the selection of optimal window size based on different types of properties may be different; the investigation of position conservation of residues around phosphothreonine may be invaluable for its prediction. However, there are much less concerned with these views in previous work, and the predicted accuracy still has room to grow.
In this paper, we statistically analyzed the distribution of different properties including position conservation, secondary structure, accessibility and some physicochemical properties of the residues around the phosphothreonine and non-phosphothreonine sites. Based on the statistical results, a new model was developed by using optimal window size strategy and feature selection technique. The prediction performance of the proposed model was measured by using auROC value.
Results and Discussion
In order to achieve an optimal model which can achieve the highest accuracy for predicting phosphothreonine site, it is of great significance to investigate the properties of residues surrounding phosphothreonine. Thus, we statistically analyzed the distribution of different properties including position conservation of residues, secondary structure content, accessibility and some physicochemical properties of the residues surrounding the phosphothreonine site and non-phosphothreonine site.
The position conservation
The residues distribution surrounding threonine is an important factor on the phosphorylation of threonine. Thus, the position conservation of residues surrounding the threonine is likely to be a latent and be helpful information to identify phosphorylation sites. To verify our conjecture, the M(l) value (see Eq (1)) of each position was calculated based on positive and negative datasets, respectively (see Fig. 2). From Fig. 2, we noticed that the M(l) value of each position in positive dataset is greater than that in negative sample dataset, indicating that these phosphothreonine sites prefer to some special residues.
Figure 2. The position conservation M(l) value around phosphothreonine and non-phosphothreonine sites.
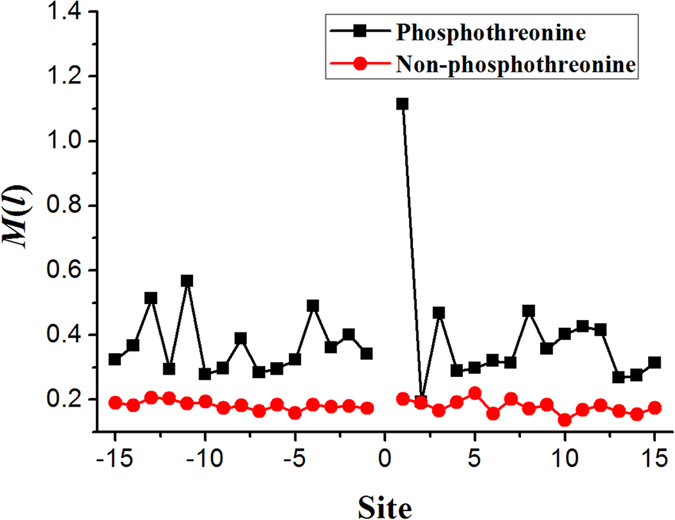
Especially, we noticed that the M(l) value at +1 site was significantly higher than other sites (Fig. 2), indicating that the first site downstream of threonine plays very important role for phosphorylation. Further analysis shows that the frequency of proline (P) is >25% at the first site downstream of phosphothreonine. We also observed that another five sites (−13, −11, −4, 3, 8) surrounding phosphothreonine site have a higher M(l) value compared with its neighboring sites. Furthermore, we found that leucine (L), lysine (K) and glycine (G) also have preferences appearing near the phosphothreonine sites, while tryptophan (W), cysteine (C) and histidine (H) present the opposite case around phosphothreonine sites. Thus, we used MEME (Multiple Em for Motif Elicitation)13 to generate the consensus motifs around the phosphothreonine sites. As shown in Fig. 3, there are consensus sequences (left: DFG-[SA], E-value: 1.4e-0.09; right: Y-APEV[IL], E-value: 9.6e-045) in the left and right region around phosphothreonine sites, respectively.
Figure 3. The MEME frequency plot to show consensus motifs of the left and right region around phosphothreonine sites.

The structural properties
Generally, the phosphothreonine sites always located at the surface of proteins. Several studies14,15,16 showed that the phosphorlation sites occur in the loop region. Thus, we performed a serial of analysis to investigate the secondary structure content and accessibility information of the residues around the phosphothreonine site and non-phosphothreonine site. Results are shown in Fig. 4.
Figure 4. The distribution of the secondary structure and mean of accessibility of each position surrounding the site.
(a) The distribution of the second structure of the each position around the phosphothreonine site. (b) The distribution of the second structure of the each position around the non-phosphothreonine site. (c) Mean of accessibility of the each position around positive and negative samples.
From Fig. 4a, we noticed that the residues around the phosphothreonine site do prefer to form loop structure. However, we cannot observe similar phenomena in non-phosphothreonine site (Fig. 4b). Moreover, we found that the closer the site gets to the phosphothreonine site, the greater the frequency of loop structure has and the lower the frequency of helix structure has. Figure 4c shows that the residues around the phosphothreonine site are inclined to have a higher accessibility than the residues around the non-phosphothreonine site. Furthermore, the distributions of secondary structure and accessibility are not strict symmetric flanking from phosphothreonine site (Fig. 4a,c), suggesting that different regions play different roles in phosphorylation of threonine.
The physicochemical properties
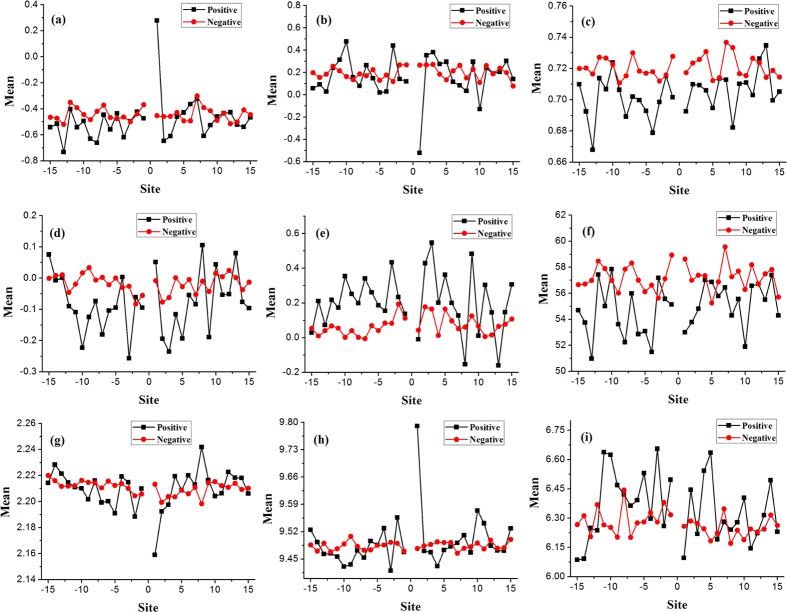
Physicochemical properties of amino acid play a pivotal role in the protein-related research works for a long time17,18,19. Here, we statistically analyzed the distribution of nine physicochemical properties of residues around the phosphothreonine and non-phosphothreonine site, as shown in Fig. 5. The values of the nine kinds of physicochemical properties have been provided in previous reference20. The results showed that, for the nine physicochemical properties, positive samples have larger fluctuation than negative samples. It also shows that the distributions of physicochemical properties flanking the phosphothreonine sites are not symmetrical. Especially, for four properties (rigidity, Flexibility, Pk1 and Pk2), +1 site of phosphothreonine are always dramatically different from other sites, which may be resulted from the phenomenon that +1 site prefer to proline.
Figure 5. The distribution of average value of residues’ different physicochemical properties in the each position surrounding the site.
(a) Rigidity, (b) Flexibility, (c) Irreplaceability, (d) Hydrohobicity, (e) Hydrophilicity, (f) Mass, (g) pk1, (h) pk2, (i) pI.
Discrimination phosphothreonine from non-phosphothreonine
Based on the above analysis, we found that the distributions of different properties of residues are not only asymmetric surrounding phosphothreonine, but also dramatically different between phosphothreonine and non-phosphothreonine. These results suggest that the information can be used to identify phosphothreonine.
One may notice that it is unbalance between positive datasets and negative datasets, which will bring biased estimate for a proposed method. Thus, we used clustering algorithm to generate 100 groups of positive sample and 100 groups of negative sample. Then, the first sample in each group are selected as training dataset. Thus, final benchmark dataset includes 100 positive samples and 100 negative samples.
A serial of calculation and analysis were performed to obtain the best prediction accuracy. We initially obtain the optimal window size of each set of features as follows. Firstly, four groups of feature sets namely position scoring function (F1), secondary structure and accessibility (F2), three kinds of physical properties (rigidity, flexibility and irreplaceability) (F3) and six kinds of chemical properties (hydrophobicity, hydrophilicity, mass, pk1, pk2 and pi) (F4) were used as features of phosphorylation site prediction, respectively. Secondly, we varied the window size from 10 residues to 30 residues and investigated the accuracy obtained by using SVM in jackknife test. The changes of auROC values with window size for four groups of features were plotted in Fig. 6. Results in Fig. 6 show that the optimal window sizes are 12, 12, 24 and 18 residues, respectively for position scoring function, second structure and accessibility, three kinds of physical properties (rigidity, flexibility and irreplaceability) and six kinds of chemical properties (hydrophobicity, hydrophilicity, mass, pk1, pk2 and pi).
Figure 6. A plot for auROC values with window sizes for four groups of features: position scoring function (F1), secondary structure and accessibility (F2), three kinds of physical properties (rigidity, flexibility and irreplaceability) (F3) and six kinds of chemical properties (hydrophobicity, hydrophilicity, mass, pk1, pk2 and pi) (F4).
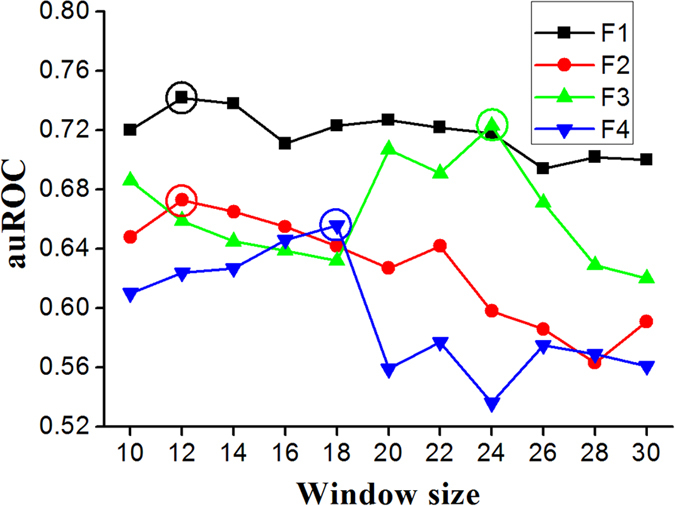
Based on the optimal window sizes for four groups of features, the sample can be formulated as a 216 dimensions vector including 12 dimensions for position scoring function, 12 × 2 = 24 dimensions for secondary structure and accessibility, 24 × 3 = 72 dimensions for three kinds of physical properties (rigidity, flexibility and irreplaceability) and 18 × 6 = 108 dimensions for six kinds of chemical properties (hydrophobicity, hydrophilicity, mass, pk1, pk2 and pi). In order to further improve the accuracy, we used mRMR program21 to exclude noise or redundant information. In view of this, we used the incremental feature selection (IFS) to determine the optimal number of feature as described below. The feature subset starts from a feature ranking first in the mRMR feature list. A new feature subset was composed when the second feature of this list was added. We repeated this process until all candidate features are added. In this study, we obtained 216 feature subsets. The prediction performance of each feature subsets was examined by using SVM with jackknife test on the benchmark dataset. We thus plotted a curve in a 2D Cartesian coordinate system with the number of features as its abscissa and the auROC as its ordinate. The maximum auROC corresponds to the peak of the curve which can be easily observed. According to the curve shown in Fig. 7, the auROC reached its peak (auROC = 0.847) when the top ranked 49 features were used.
Figure 7. The feature selection results.
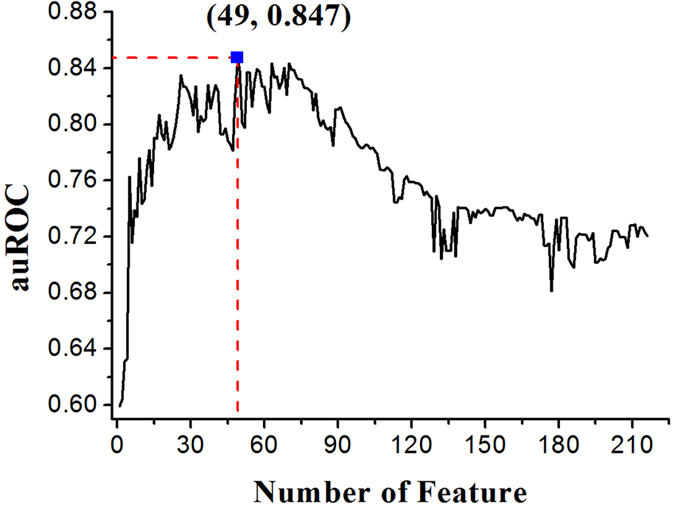
When the top 49 features were used to perform prediction, the auROC value reached its maximum peak (0.847).
Conclusion
In this paper, we statistically analyzed the distribution of the different properties around the phosphothreonine and non-phosphothreonine sites, and found several important features which can contribute the identification of phosphothreonine. In preliminary test, we found that the structural and physicochemical properties do improve the recognition quality of phosphothreonine sites. In the future, we will collect more data and extract more features to construct a predictive model with higher accuracy. Of course, the features can also be used in the prediction of other protein post-translational modification.
Materials and Methods
Database
The proteins with experimental-confirmed phosphothreonine in Homo sapiens were collected from the Universal Protein Resource (UniProt)22. Redundant sequences were removed by using CD-HIT23 program with a sequence identity threshold of 30%. The proteins which have three dimension structure information in the Protein Data Bank (PDB)24 database were remained. The PDBfinder II database25 was used to obtain the corresponding secondary structure and accessibilities of these sequences. Finally, a total of 115 proteins containing phosphothreonine sites were obtained.
Subsequently, we extracted 151 sequences in protein sets. Each sequence is 31-residue long with the experimentally-confirmed phosphothreonines in the center. These sequences are deemed as the positive samples. Correspondingly, the other 31-mer sequences with the center threonine which is unphophorylated are selected as the negative datasets. Thus, we obtained a negative datasets which contains 2158 sequences.
Feature encoding and selection
Position conservation
In order to find potential sequence characteristic of residues around phosphorylation sites (from −15 to +15), we investigated the residue preference at each site by using the conservation formulation defined as follows:
 |
where  denotes the occurrence frequency of the ith amino acid at the lth position. p0 is the background frequency (here p0 = 0.05). It is obvious that the larger the M(l) value is, the stronger the conservation of the lth site is. M(l) = 0 represents a random distribution of the 20 residues at the lth position.
The position scoring function
By aligning the training sequences of positive samples, the position weight matrix (PWM) was defined as the following:
 |
where nxl denotes the real counts of residue x at the lth site. p0 denotes the background frequency of each amino acid in protein sequence (here p0 = 0.05). Nl denotes the total number of real counts at the lth site (the number of sequences). Then, for an arbitrary peptide fragment with 31 residues, the scoring of the lth site can be calculated by,
 |
where Mp(l) and MN(l) denote the position conservation at the lth site in the positive and negative samples, respectively. The value of F(l) shows that the degree of sequence close to positive samples.
Feature selection
To build an effective prediction model, feature selection is one of the most important steps26,27,28. Generally, not all features have equivalent contribution to the phosphorylation prediction system. Some of features make key contributions, whereas some others are less important. To analyze the features, a mutual information-based feature selection method, Minimal Redundancy Maximal Relevance (mRMR) method21, was employed in this study to pick out optimal features.
The mRMR is used to enhance the wrapper feature selection. mRMR can eventually generate two alternative features list, namely MaxRel feature list and mRMR feature list. The MaxRel feature list sorts the features according to their contribution to classification, whereas the mRMR feature list sorts the features by considering not only their contribution to classification but also the correlation between features29. In this study, we ranked features according to the mRMR feature list. For the detailed description of mRMR, please refer to Peng et al.’s work21.
Model construction
Support vector machine
Support vector machine (SVM) is a supervised learning model, which can construct a hyperplane in a high-dimensional space to classify two types of samples and has been widely used in bioinformatics30,31,32. Generally, a good separation is achieved by the hyperplane that has the largest distance to the nearest training-data point of any class (so-called functional margin). Thus, the larger the margin, the lower the generalization error of the classifier is. In this paper, we used LIBSVM 3.2033 to perform prediction, which can be freely downloaded from http://www.csie.ntu.edu.tw/~cjlin/libsvm/. The radial basis function (RBF) kernel was selected as kernel function. For achieving the best model, the penalty constant C and the kernel width parameter γ were tuned in an optimization procedure using a grid search method, of which the search spaces for C and γ are [215, 2−5] and [2−5, 2−15] with steps of 2−1 and 2, respectively.
ROC curve
The receiver operating characteristic curve (ROC curve) is a graphical plot to illustrate the performance of a binary classifier system by plotting the true positive rate (TPR) against false positive rate (FPR) with various threshold settings34,35. The TPR, also called Sensitivity or recall in machine learning, measures the proportion of correctly predicted positive samples. The FPR, also known as the fall-out and can be calculated by 1-Specificity, is the proportion of negative samples be predicted as positive samples. TPR and FPR are defined as follows:
 |
where TP, FP, TN and FN denote true positive, false positive, true negative and false negative, respectively. The area under ROC curve (auROC) can better reflect the performance of a classifier. The auROC values ranged from 0.5 to 1, and the larger auROC value is, the better performance is.
Additional Information
How to cite this article: Zhao, Y.-W. et al. Prediction of phosphothreonine sites in human proteins by fusing different features. Sci. Rep. 6, 34817; doi: 10.1038/srep34817 (2016).
Acknowledgments
This work was supported by the Applied Basic Research Program of Sichuan Province (nos 2015JY0100 and LZ-LY-45), the Scientific Research Foundation of the Education Department of Sichuan Province (11ZB122), the Nature Scientific Foundation of Hebei Province (no. C2013209105), the Fundamental Research Funds for the Central Universities of China (nos ZYGX2015J144 and ZYGX2015Z006), and the Program for the Top Young Innovative Talents of Higher Learning Institutions of Hebei Province (no. BJ2014028).
Footnotes
Author Contributions H.L. and W.C. conceived and designed the experiments; Y.W.Z., H.Y.L. and H.T. implemented SVM and performed data analysis; H.L., W.C., Y.W.Z. and H.Y.L. wrote the paper. All authors read and approved the final manuscript.
References
- Cozzone A. J. Protein phosphorylation in prokaryotes. Annual review of microbiology 42, 97–125, 10.1146/annurev.mi.42.100188.000525 (1988). [DOI] [PubMed] [Google Scholar]
- Chang C. & Stewart R. C. The two-component system. Regulation of diverse signaling pathways in prokaryotes and eukaryotes. Plant physiology 117, 723–731 (1998). [DOI] [PMC free article] [PubMed] [Google Scholar]
- Hubbard M. J. & Cohen P. On target with a new mechanism for the regulation of protein phosphorylation. Trends in biochemical sciences 18, 172–177 (1993). [DOI] [PubMed] [Google Scholar]
- Que S. et al. Evaluation of protein phosphorylation site predictors. Protein and peptide letters 17, 64–69 (2010). [DOI] [PubMed] [Google Scholar]
- Kobe B., Kampmann T., Forwood J. K., Listwan P. & Brinkworth R. I. Substrate specificity of protein kinases and computational prediction of substrates. Biochimica et biophysica acta 1754, 200–209, 10.1016/j.bbapap.2005.07.036 ( 2005). [DOI] [PubMed] [Google Scholar]
- Jiang L., Zhang J., Xuan P. & Zou Q. BP neural network could help improve pre-miRNA identification in various species. BioMed Research International 2016, 9565689 (2016). [DOI] [PMC free article] [PubMed] [Google Scholar]
- Li D., Ju Y. & Zou Q. Protein Folds Prediction with Hierarchical Structured SVM. Current Proteomics 13, 79–85 (2016). [Google Scholar]
- Ingrell C. R., Miller M. L., Jensen O. N. & Blom N. NetPhosYeast: prediction of protein phosphorylation sites in yeast. Bioinformatics 23, 895–897, 10.1093/bioinformatics/btm020 (2007). [DOI] [PubMed] [Google Scholar]
- Lin S. et al. Rice_Phospho 1.0: a new rice-specific SVM predictor for protein phosphorylation sites. Scientific reports 5, 11940, 10.1038/srep11940 (2015). [DOI] [PMC free article] [PubMed] [Google Scholar]
- Huang H. D., Lee T. Y., Tzeng S. W. & Horng J. T. KinasePhos: a web tool for identifying protein kinase-specific phosphorylation sites. Nucleic acids research 33, W226–229, 10.1093/nar/gki471 (2005). [DOI] [PMC free article] [PubMed] [Google Scholar]
- Xue Y. et al. GPS: a comprehensive www server for phosphorylation sites prediction. Nucleic acids research 33, W184–187, 10.1093/nar/gki393 (2005). [DOI] [PMC free article] [PubMed] [Google Scholar]
- Xue Y. et al. GPS 2.0, a tool to predict kinase-specific phosphorylation sites in hierarchy. Molecular & cellular proteomics: MCP 7, 1598–1608, 10.1074/mcp.M700574-MCP200 (2008). [DOI] [PMC free article] [PubMed] [Google Scholar]
- Bailey T. L. & Elkan C. Fitting a mixture model by expectation maximization to discover motifs in biopolymers. Proceedings/… International Conference on Intelligent Systems for Molecular Biology ; ISMB. International Conference on Intelligent Systems for Molecular Biology 2, 28–36 (1994). [PubMed]
- Wu S. C. & Solaro R. J. Protein kinase C zeta. A novel regulator of both phosphorylation and de-phosphorylation of cardiac sarcomeric proteins. The Journal of biological chemistry 282, 30691–30698, 10.1074/jbc.M703670200 (2007). [DOI] [PMC free article] [PubMed] [Google Scholar]
- Mohamed A. S., Dignam J. D. & Schlender K. K. Cardiac myosin-binding protein C (MyBP-C): identification of protein kinase A and protein kinase C phosphorylation sites. Archives of biochemistry and biophysics 358, 313–319, 10.1006/abbi.1998.0857 (1998). [DOI] [PubMed] [Google Scholar]
- Qiao R. et al. Mechanism of APC/CCDC20 activation by mitotic phosphorylation. Proceedings of the National Academy of Sciences of the United States of America 113, E2570–2578, 10.1073/pnas.1604929113 (2016). [DOI] [PMC free article] [PubMed] [Google Scholar]
- O’Shea R. & Moser H. E. Physicochemical properties of antibacterial compounds: implications for drug discovery. Journal of medicinal chemistry 51, 2871–2878, 10.1021/jm700967e (2008). [DOI] [PubMed] [Google Scholar]
- Jia J., Liu Z., Xiao X., Liu B. & Chou K. C. iPPI-Esml: An ensemble classifier for identifying the interactions of proteins by incorporating their physicochemical properties and wavelet transforms into PseAAC. Journal of theoretical biology 377, 47–56, 10.1016/j.jtbi.2015.04.011 (2015). [DOI] [PubMed] [Google Scholar]
- Liu B. et al. Pse-in-One: a web server for generating various modes of pseudo components of DNA, RNA, and protein sequences. Nucleic Acids Research 43, W65–W71 (2015). [DOI] [PMC free article] [PubMed] [Google Scholar]
- Tang H., Chen W. & Lin H. Identification of immunoglobulins using Chou’s pseudo amino acid composition with feature selection technique. Molecular Biosystems 12, 1269–1275, 10.1039/c5mb00883b (2016). [DOI] [PubMed] [Google Scholar]
- Peng H., Long F. & Ding C. Feature selection based on mutual information: criteria of max-dependency, max-relevance, and min-redundancy. IEEE transactions on pattern analysis and machine intelligence 27, 1226–1238, 10.1109/TPAMI.2005.159 (2005). [DOI] [PubMed] [Google Scholar]
- Bairoch A. et al. The Universal Protein Resource (UniProt). Nucleic acids research 33, D154–159, 10.1093/nar/gki070 (2005). [DOI] [PMC free article] [PubMed] [Google Scholar]
- Li W. & Godzik A. Cd-hit: a fast program for clustering and comparing large sets of protein or nucleotide sequences. Bioinformatics 22, 1658–1659, 10.1093/bioinformatics/btl158 (2006). [DOI] [PubMed] [Google Scholar]
- Berman H. M. et al. The Protein Data Bank. Nucleic acids research 28, 235–242 (2000). [DOI] [PMC free article] [PubMed] [Google Scholar]
- Hooft R. W. W., Sander C., Scharf M. & Vriend G. The PDBFINDER database: A summary of PDB, DSSP and HSSP information with added value. Computer Applications in the Biosciences 12, 525–529 (1996). [DOI] [PubMed] [Google Scholar]
- Zou Q., Zeng J., Cao L. & Ji R. A Novel Features Ranking Metric with Application to Scalable Visual and Bioinformatics Data Classification. Neurocomputing 173, 346–354 (2016). [Google Scholar]
- Liu B., Chen J. & Wang X. Protein remote homology detection by combining Chou’s distance-pair pseudo amino acid composition and principal component analysis. Molecular Genetics and Genomics 290, 1919–1931 (2015). [DOI] [PubMed] [Google Scholar]
- Feng P., Lin H., Chen W. & Zuo Y. Predicting the types of J-proteins using clustered amino acids. BioMed research international 2014, 935719, 10.1155/2014/935719 (2014). [DOI] [PMC free article] [PubMed] [Google Scholar]
- Wang S. et al. Analysis and Identification of Aptamer-Compound Interactions with a Maximum Relevance Minimum Redundancy and Nearest Neighbor Algorithm. BioMed research international 2016, 8351204, 10.1155/2016/8351204 (2016). [DOI] [PMC free article] [PubMed] [Google Scholar]
- Zou Q., Chen W., Huang Y., Liu X. & Jiang Y. Identifying Multi-functional Enzyme with Hierarchical Multi-label Classifier. Journal of Computational and Theoretical Nanoscience 10, 1038–1043 (2013). [Google Scholar]
- Cao R., Wang Z. & Cheng J. Designing and evaluating the MULTICOM protein local and global model quality prediction methods in the CASP10 experiment. BMC structural biology 14, 13, 10.1186/1472-6807-14-13 (2014). [DOI] [PMC free article] [PubMed] [Google Scholar]
- Cao R., Wang Z., Wang Y. & Cheng J. SMOQ: a tool for predicting the absolute residue-specific quality of a single protein model with support vector machines. BMC bioinformatics 15, 120, 10.1186/1471-2105-15-120 (2014). [DOI] [PMC free article] [PubMed] [Google Scholar]
- Chang C. C. & Lin C. J. LIBSVM: A Library for Support Vector Machines. Acm T Intel Syst Tec 2, 10.1145/1961189.1961199 (2011). [DOI] [Google Scholar]
- Linden A. Measuring diagnostic and predictive accuracy in disease management: an introduction to receiver operating characteristic (ROC) analysis. Journal of evaluation in clinical practice 12, 132–139, 10.1111/j.1365-2753.2005.00598.x (2006). [DOI] [PubMed] [Google Scholar]
- Chen J., Long R., Wang X., Liu B. & Chou K.-C. dRHP-PseRA: detecting remote homology proteins using profilebased pseudo protein sequence and rank aggregation. Scientific Reports, 10.1038/srep32333 (2016). [DOI] [PMC free article] [PubMed] [Google Scholar]


