

Abstract
Synucleinopathies such as Parkinson's disease are characterized by the pathological deposition of misfolded α‐synuclein aggregates into inclusions throughout the central and peripheral nervous system. Mounting evidence suggests that intercellular propagation of α‐synuclein aggregates may contribute to the neuropathology; however, the mechanism by which spread occurs is not fully understood. By using quantitative fluorescence microscopy with co‐cultured neurons, here we show that α‐synuclein fibrils efficiently transfer from donor to acceptor cells through tunneling nanotubes (TNTs) inside lysosomal vesicles. Following transfer through TNTs, α‐synuclein fibrils are able to seed soluble α‐synuclein aggregation in the cytosol of acceptor cells. We propose that donor cells overloaded with α‐synuclein aggregates in lysosomes dispose of this material by hijacking TNT‐mediated intercellular trafficking. Our findings thus reveal a possible novel role of TNTs and lysosomes in the progression of synucleinopathies.
Keywords: TNTs, α‐synuclein, intercellular transfer, synucleinopathies
Subject Categories: Membrane & Intracellular Transport, Neuroscience
Introduction
Alpha‐synuclein (α‐synuclein) is a 140 amino acid protein widely expressed in the brain, localized principally in the cytosol and at presynaptic terminals in association with vesicles. Its exact function is still unclear, although it appears to be involved in neurotransmitter release (Bendor et al, 2013; Burré et al, 2013). Misfolded α‐synuclein aggregates into intraneuronal inclusions called Lewy bodies (LB) and intraglial inclusions, associated with neuronal and glial loss in specific regions of the brain. These inclusions represent the histopathological hallmark of synucleinopathies that include Parkinson's disease (PD), dementia with Lewy bodies (DLB) and multiple system atrophy (MSA), which are characterized by a chronic and progressive decline in motor, cognitive, behavioural and autonomic functions (McCann et al, 2014).
Considerable efforts have been made to understand the progression of synucleinopathies. Braak and colleagues were the first to show that α‐synuclein neuropathology progresses throughout the brain in a specific and predictable manner, suggesting that the progression of the disease is associated with the propagation of a neurotropic infectious entity (Braak et al, 2003a,b). Recent data indicate that this neurotropic agent might be aggregated α‐synuclein. Pioneering studies supporting this hypothesis evidenced the presence of LB in grafted foetal mesencephalic dopaminergic neurons in the brain of PD subjects over 10 years after transplantation (Kordower et al, 2008; Li et al, 2008). Since then, intercellular α‐synuclein transfer in vitro and in vivo has been reported (Desplats et al, 2009; Hansen et al, 2011; Kordower et al, 2011; Angot et al, 2012; Luk et al, 2012a,b; Mougenot et al, 2012; Masuda‐Suzukake et al, 2013, 2014; Bae et al, 2014; Recasens et al, 2014). Furthermore, it has been shown that fibrillar α‐synuclein seeds the aggregation of the soluble form of the protein in a prion‐like manner (Bousset et al, 2013; Aulić et al, 2014; Volpicelli‐Daley et al, 2014). Knowledge of the precise mechanism of α‐synuclein propagation from one cell to another is therefore needed for better understanding the mechanism of disease progression. Although secretion was shown to be a possible mechanism of α‐synuclein intercellular transfer (Desplats et al, 2009; Lee et al, 2010, 2013; Hansen et al, 2011; Freundt et al, 2012; Konno et al, 2012; Brahic et al, 2016), the predictable and specific patterns of spreading of α‐synuclein inclusions in the brains of PD patients (Braak et al, 2003b) together with in vitro and in vivo studies (Freundt et al, 2012; Rey et al, 2013; Holmqvist et al, 2014; Peelaerts et al, 2015) suggest a mechanism of spread following neuronal circuits.
Here, we developed a robust cell model to study in vitro the mechanism of cell‐to‐cell transfer of structurally and functionally characterized fluorescent human α‐synuclein fibrils previously shown to recapitulate α‐synuclein pathogenicity by being toxic and inducing seeding in neuronal cells and in animal models (Pieri et al, 2012; Bousset et al, 2013; Peelaerts et al, 2015). We specifically investigated the role of tunneling nanotubes, F‐actin containing membranous bridges that connect the cytoplasm of remote cells (Abounit & Zurzolo, 2012), allowing direct transfer of various cargoes (Austefjord et al, 2014) and thereby implicated in several physiological processes (Marzo et al, 2012). TNTs have been found in tissues of various origins (Chinnery et al, 2008; Lou et al, 2012; Seyed‐Razavi et al, 2013; Ady et al, 2014), and recently TNT‐like connections have been observed in human glioblastoma tumours implanted in mouse brains (Osswald et al, 2015). Of interest, data showing TNT‐mediated HIV transfer from infected to uninfected T cells (Sowinski et al, 2008) and transfer of prions and other pathogens (Onfelt et al, 2004; Gousset & Zurzolo, 2009; Gousset et al, 2009) support the role of TNTs as a general conduit used by pathogens for spreading.
In the present study, we found that efficient transfer of α‐synuclein fibrils between neuron‐like cells and primary neurons in culture relied on tunneling nanotubes (TNTs). Following TNT‐mediated transfer, α‐synuclein fibrils were able to induce the aggregation of soluble, endogenous α‐synuclein in acceptor cells. Most importantly, we show for the first time that fibrils normally directed to the lysosomal compartment for degradation both in neuron‐like cells and in primary neurons can shuttle between cells in TNTs within lysosomal vesicles. Overall, our results support TNTs as efficient means for propagation of α‐synuclein fibrils between neurons, and reveal a novel role played by lysosomes in this cell‐to‐cell transfer process.
Results
α‐synuclein fibrils transfer efficiently between neuron‐like cells
To investigate whether α‐synuclein fibrils could transfer between neurons, we first assessed whether recombinant human α‐synuclein fibrils of known dimension and molecular mass (on average 4,000 monomers for one fibril, Pieri et al, 2012) (Fig EV1A) were capable of entering catecholaminergic mouse (CAD) neuron‐like cells. In time course experiments, we quantified the percentage of cells containing the fluorescent α‐synuclein fibrils using flow cytometry and found a time‐dependent internalization of fibrils with maximum fluorescence reached after 6 h (Figs 1A and EV1B). Time course measurements of lactate dehydrogenase (LDH) release after exposure to α‐synuclein fibrils (up to 1 μM) showed no change compared to control cells (Fig EV1C). This suggested that cells were viable, thus validating their use as donor cells in our transfer assay (see below and schematic in Fig EV2).
Figure EV1. α‐synuclein fibril characterization and internalization in neuron‐like cells and cortical primary neurons.
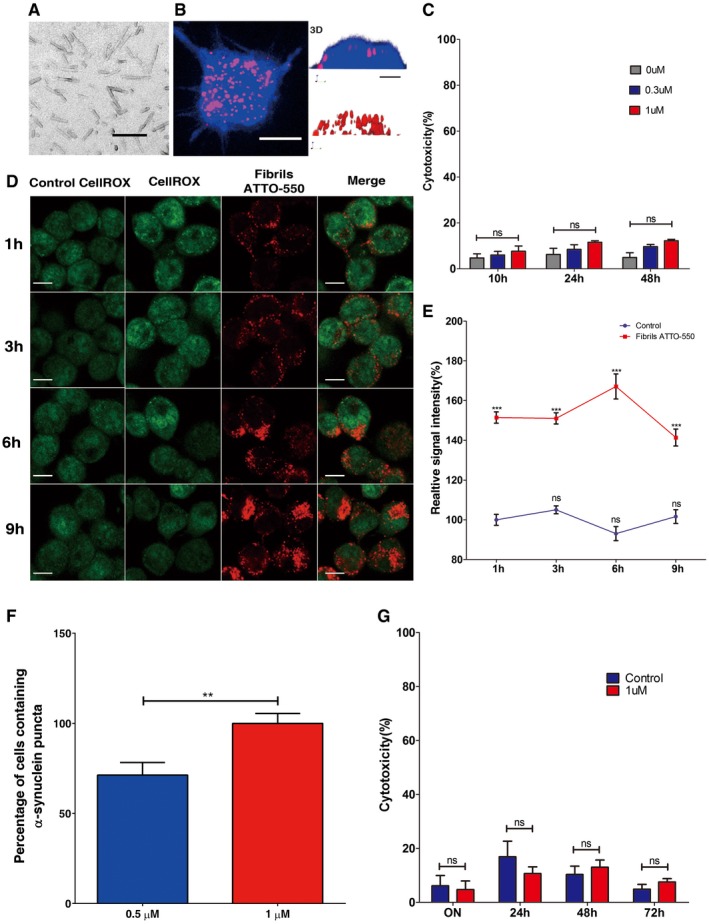
- Electron micrographs of α‐synuclein fibrils used throughout this study. The scale bar represents 100 nm. Fibrillar α‐synuclein was adsorbed to a carbon‐coated copper grid and stained with freshly prepared 1% uranyl acetate. Samples were imaged using a JEOL 1400 electron microscope equipped with an LaB6 filament and operated at 80 kV, and 10,000× magnification, images were recorded with a Gatan Orius CCD camera (Gatan).
- The left panel shows representative Z‐stack projection of confocal images showing neuron‐like CAD cells after loading with α‐synuclein fibrils for 16 h. Cells were then trypsin‐washed, fixed and labelled with HCS CellMask Blue; scale bar is 10 μm. The right panel depicts the (z, y) three‐dimensional reconstruction (3D) of a cell loaded with fibrils shown in the confocal image (left panel); scale bar is 5 μm. As seen on the three‐dimensional images, α‐synuclein fibrils are present only in the cytosol and not at the plasma membrane.
- Cell toxicity was measured by LDH release in neuron‐like cells after 10, 24 and 48 h of loading increasing concentrations of sonicated α‐synuclein fibrils. The bar graph represents the percentage of cytotoxicity normalized to control values. There were no significant differences between control and α‐synuclein‐loaded cells at any of the time points or concentrations evaluated. Ns, not significant by two‐way Student's t‐test.
- Representative images showing intracellular ROS levels in neuron‐like cells upon addition of 1 μM of α‐synuclein fibrils for up to 9 h. Intracellular ROS was measured by CellRox Green fluorescence in control and α‐synuclein‐loaded cells (red). Scale bars are 10 μm.
- The graph shows the percentage of the relative fluorescence intensity of intracellular ROS at different time points in α‐synuclein‐loaded CAD cells and controls. The values show ˜50% increase in ROS production at all time points. ***P < 0.001 compared to the control condition. Ns, not significant by two‐way Student's t‐test.
- Quantification of the percentage of primary cortical neurons containing α‐synuclein puncta after 16 h of incubation with 0.5 μM (blue bar) and 1 μM (red bar) of α‐synuclein fibrils. **P < 0.001 by two‐way Student's t‐test.
- Cell toxicity was measured by LDH release in primary neurons on addition of 1 μM of sonicated α‐synuclein fibrils for 16, 24, 48 and 72 h. The bar graph represents the percentage of cytotoxicity normalized to control values. There were no significant differences between control (blue bar) and α‐synuclein‐loaded (red bar) cells at any of the time points evaluated. Ns, not significant by two‐way Student's t‐test.
Data information: Data in (C and E–G) represent the mean ± s.e.m. of three independent experiments. Whereas at least 100 cells were scored for each experiment of internalization and ROS, values for toxicity experiments are derived from triplicates of three different experiments.
Figure 1. α‐synuclein fibrils transfer efficiently between neuron‐like CAD cells.
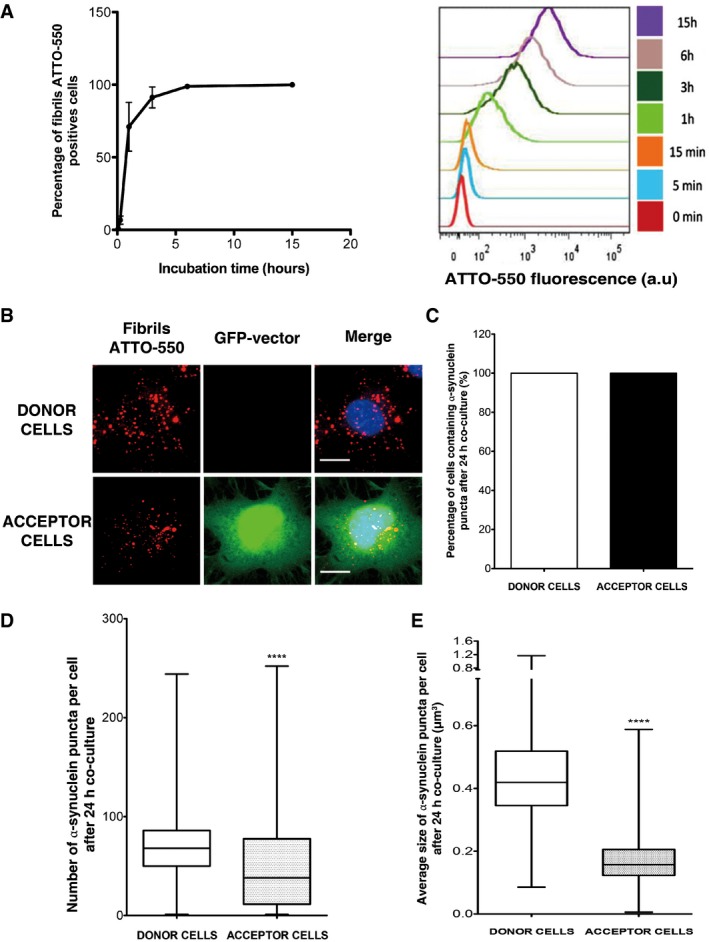
- Time course of rapid internalization of fluorescent α‐synuclein fibrils by CAD cells (for characterization of α‐synuclein assemblies, see Fig EV1A). Internalization was measured by recording ATTO‐550‐positive neuron‐like cells by flow cytometry. Percentage of ATTO‐550‐positive cells was quantified (mean ± s.e.m.) (left panel) and representative histograms of ATTO‐550‐positive cells are shown on the right panel (a.u., arbitrary units). n = 3 independent experiments. Similarly, α‐synuclein fibril internalization was also confirmed by fluorescent microscopy (see Fig EV1B).
- Representative images of donor (upper panel) and acceptor cells (lower panel) after 24‐h co‐culture. Donor cells were loaded with α‐synuclein fibrils prior to co‐culture with GFP‐transfected acceptor cells: in red, α‐synuclein fibrils; in green, acceptor cells; and in blue, nuclei. Scale bars represent 10 μm. n = 3 independent experiments. A larger field where donor and acceptor cells are shown is presented in Fig EV3A.
- Percentage of donor and acceptor cells containing α‐synuclein fibrils after co‐culture as in (B): all acceptor cells received α‐synuclein fibrils.
- Quantification of the number of α‐synuclein fibrils in donor and acceptor cells after co‐culture as in (B). Donor cells contain around 70 α‐synuclein fibril puncta (median), while acceptor cells contain 38 α‐synuclein fibril puncta, respectively (****P < 0.0001 by two‐tailed Mann–Whitney U‐test).
- Quantification of the average size of α‐synuclein fibrillar foci in donor and acceptor cells after co‐culture as in (B) (****P < 0.0001 by two‐tailed Mann–Whitney U‐test). See also Fig EV3 for an example of α‐synuclein fibrillar puncta detection in an acceptor cell. After detection, the number and the size of foci were determined using the ICY software.
Figure EV2. Schematic of the experimental design of co‐culture experiments.
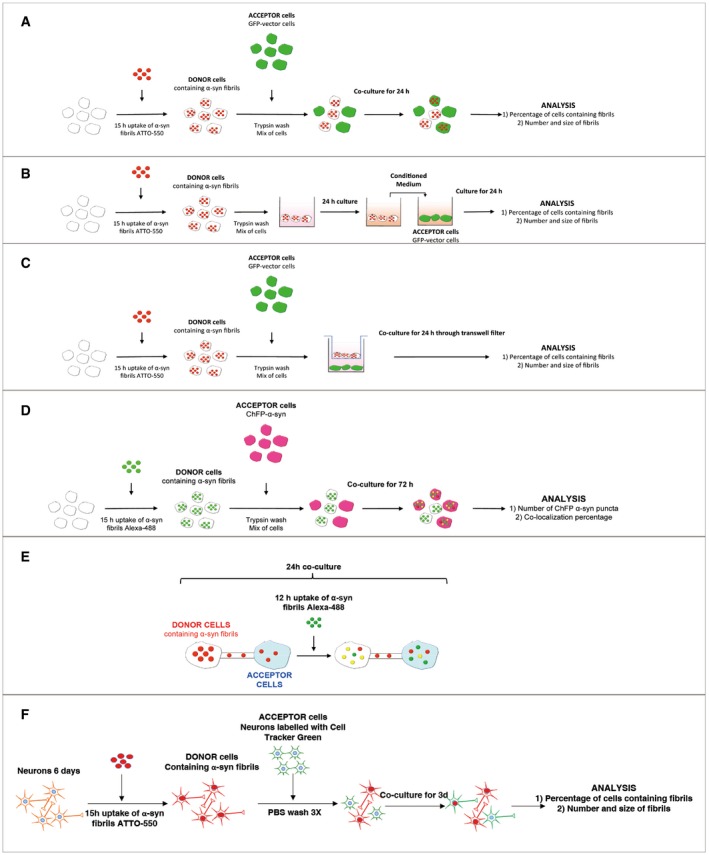
- Experimental set‐up used for the co‐culture experiment (also referred to as a transfer experiment). CAD neuron‐like cells are loaded for 16 h with human fluorescent ATTO‐550 α‐synuclein fibrils. Cells are trypsin‐washed and are used as “Donor cells” since their cytosol is loaded with α‐synuclein fibrils. Donor cells are mixed with GFP‐transfected cells referred to as “Acceptor cells” for 24 h. Then, the co‐culture is fixed and imaged and (i) the percentage of cells containing ATTO‐550 α‐synuclein fibrils and (ii) the average number and size of ATTO‐550 α‐synuclein fibrils per cells are quantified using ICY software.
- Experimental set‐up used for the conditioned medium experiment. This experiment allows investigating the contribution of secretion to cell‐to‐cell α‐synuclein fibril transfer. Here, donor cells are obtained as described in (A) (i.e. loading followed by trypsin wash) and then cultured for 24 h. The medium of donor cells referred to as conditioned medium (CM) is entirely collected and used as is to culture GFP‐transfected acceptor cells for 24 h. The same analysis described in (A) is performed (i.e. percentage of cells containing α‐synuclein fibrils, number and size of α‐synuclein fibrils per cells) but also quantitative analysis of the amount of fibrils within donor cells and the culture medium by filter trapping on cellulose acetate membranes.
- Experimental set‐up used for the filter experiment. This set‐up was designed to separate donor and acceptor cells to investigate the contribution of (i) secretion or/and (ii) cell contact to transfer. The co‐culture is performed similarly as described in (A) with the exception that donor cells are plated in the well, and then a transwell filter is placed on top of which acceptor cells are plated. After 24‐h co‐culture, the same analysis is performed (see A).
- Experimental set‐up used for the seeding experiment. Here, donor cells loaded with α‐synuclein fibrils Alexa‐488 (and trypsin‐washed as described in A) were co‐cultured with acceptor cells overexpressing ChFP‐α‐synuclein for 72 h. The number of ChFP‐α‐synuclein fibril puncta as well as the co‐localization rate between α‐synuclein fibrils Alexa‐488 and ChFP α‐synuclein fibril puncta was quantified.
- Schematic of the experimental design of exogenous α‐synuclein fibril internalization in co‐cultured cells. Donor cells previously loaded with ATTO‐550 α‐synuclein fibrils were co‐cultured with untransfected acceptor cells for 24 h. After 12 h of co‐culture, cells were challenged with α‐synuclein fibrils Alexa‐488 (i.e. exogenously added α‐synuclein fibrils) for an additional 12 h.
- Schematic of the experimental design of α‐synuclein fibril internalization and transfer between primary neurons. Donor neurons pre‐loaded with ATTO‐550 α‐synuclein fibrils were co‐cultured with CTG‐labelled acceptor neurons for 72 h. Acceptor neurons were prepared from a different dissection and labelled in suspension before adding them on top of the donor neurons. After 72 h, the cells are fixed and imaged and (i) the percentage of cells containing α‐synuclein puncta and (ii) the number and average size of α‐synuclein puncta per cell are quantified using ICY software.
Although transfer of α‐synuclein fibrils between neuronal cells has been shown, quantification (i.e. percentage of cells containing fibrils, number and size of α‐synuclein foci) and intracellular localization of the transferred aggregates have not been thoroughly characterized. We set up a new co‐culture assay where “donor” CAD cells (loaded overnight with α‐synuclein fibrils) were co‐cultured for 24 h at the ratio of 1:1 with naïve “acceptor” CAD cells expressing GFP. In order to remove any membrane‐bound extracellular α‐synuclein fibrils, donor cells were trypsin‐washed before co‐culture (Fig EV2A).
To automatically detect and quantify the number and size of fibrillar α‐synuclein puncta in the donor and acceptor cell populations separately, we used confocal microscopy and developed a specific script of the ICY software (see Appendix and Fig EV3). By this method, we found that 100% of acceptor cells contained fibrillar α‐synuclein (Fig 1B and C). Furthermore, to determine the efficiency of transfer, we quantified the number of fluorescent puncta in the donor and acceptor cell populations. While donor cells contained about 70 puncta per cell, acceptor cells contained 38 puncta (Fig 1D) indicating that 35% of the puncta transferred from donor to acceptor cells. Together with the fact that 100% acceptor cells contained fibrillar α‐synuclein puncta, this shows that in our model cell‐to‐cell transfer of fibrillar α‐synuclein occurs and is very efficient.
Figure EV3. α‐synuclein fibril detection in acceptor cells.
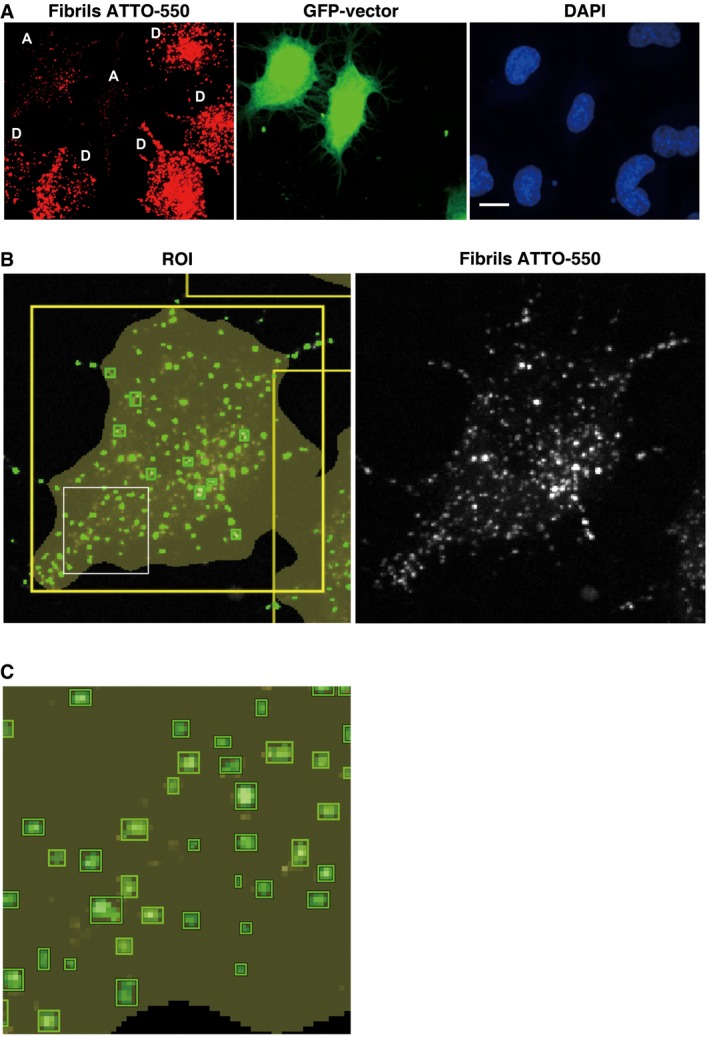
-
ARepresentative confocal picture of donor cells loaded with α‐synuclein fibrils (D, in red), co‐cultured with GFP vector‐transfected acceptor cells (A, in green) and stained with DAPI (in blue). Scale bar represents 10 μm.
-
B, CRepresentative confocal picture of an acceptor cell from (A) (top left cell) showing cell segmentation (large yellow ROI) and detection of α‐synuclein fibrils in small green square ROIs (left panel). The green square ROIs change in size according to the size of the fibrils. Thereby the large fibrils are seen in green squares and the smaller fibrils appear in small green spots which when the magnification is increased resolve into squares as seen in the inset in (C). Note in (B) the correlation between α‐synuclein fibrils (in white, right panel) and the spots detected by the software (in green, left panel).
We next analysed the size of α‐synuclein puncta in donor and acceptor cells and found that the transferred puncta in acceptor cells correspond to smaller puncta (the median value is 0.15 μm3) than the ones within the donor cells (the median value is 0.42 μm3) (Fig 1E). This finding suggests size limitation of fibrillar α‐synuclein puncta upon cell‐to‐cell transfer.
α‐synuclein fibrils induce the aggregation of soluble α‐synuclein after transfer in acceptor cells
We have previously demonstrated that α‐synuclein fibrils identical to those used in this study efficiently seed the aggregation of soluble reporter α‐synuclein (ChFP‐α‐synuclein) when exogenously added to neuron‐like cells in culture or in rodent (Bousset et al, 2013; Peelaerts et al, 2015). However, a key question is whether these fibrils would seed cytoplasmic reporter α‐synuclein, following their transfer from donor to acceptor cells. To address this question, we performed our co‐culture experiment for 72 h using as acceptor CAD cells stably overexpressing soluble ChFP‐α‐synuclein (see schematic Fig EV2D). As expected for soluble α‐synuclein, in control conditions, ChFP‐α‐synuclein cells cultured alone displayed a nucleocytoplasmic diffuse α‐synuclein signal with a few ChFP‐α‐synuclein in discrete puncta, revealing low aggregation state of ChFP‐α‐synuclein (Fig 2A and B). In contrast, quantitative analysis revealed that after co‐culture with donor cells loaded with α‐synuclein fibrils, acceptor cells contained a significantly higher number of endogenous ChFP‐α‐synuclein in discrete puncta (4 and 15 α‐synuclein‐ChFP puncta per acceptor cell in control and co‐culture conditions, respectively) (Fig 2A and B). In addition, 11% of the transferred Alexa‐488 α‐synuclein co‐localized with ChFP‐α‐synuclein in discrete puncta (Fig 2A and C). These results indicate that α‐synuclein fibrils are able to recruit soluble ChFP‐α‐synuclein, suggesting that they retain their seeding activity after being transferred from donor to acceptor cells.
Figure 2. α‐synuclein fibrils induce the aggregation of the soluble α‐synuclein protein after transfer in acceptor cells.
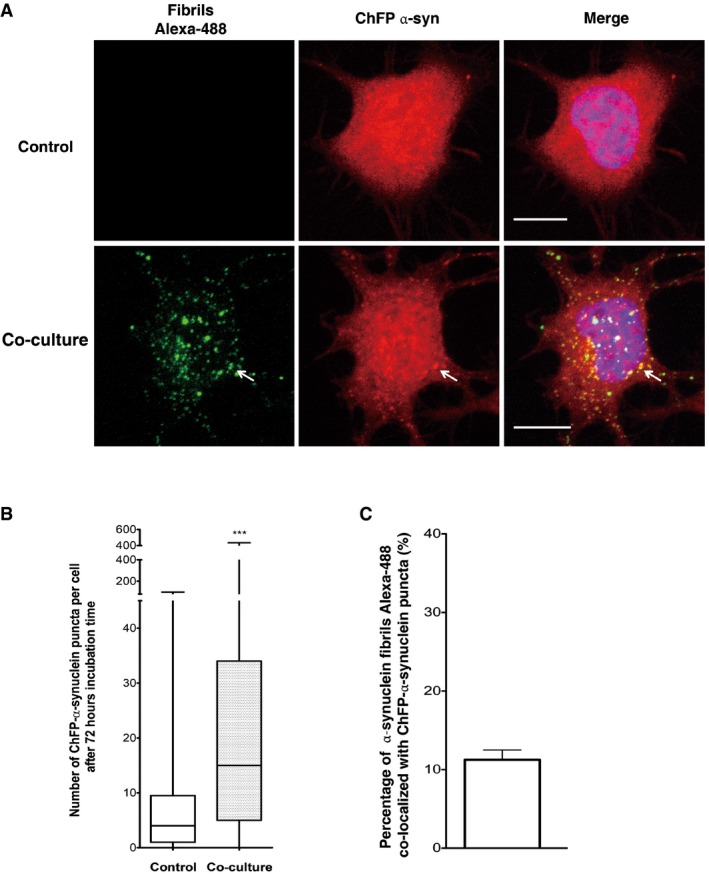
- Representative confocal images showing ChFP‐α‐syn‐transfected cells (in red) cultured alone (upper) or co‐cultured with donor cells containing fluorescent Alexa‐488 α‐synuclein fibrils (in green) for 72 h (bottom). The arrow is pointing out representative α‐synuclein fibrils co‐localized with ChFP‐α‐syn puncta. Scale bars represent 10 μm. Nuclei are stained with DAPI (blue). n = 3 independent experiments.
- Quantification of the number of ChFP‐α‐synuclein puncta in ChFP‐α‐syn acceptor cells showed a significant increase in ChFP‐α‐synuclein puncta number when cells were co‐cultured with donor cells containing α‐synuclein fibrils (***P < 0.001 by two‐tailed Mann–Whitney U‐test). In the box and whisker plot, boxes extend from the first to the third quartile, the line inside the boxes shows the median and the whiskers represent the min/max value of at least 100 cells scored for each independent experiment (n = 3).
- Quantification of the percentage of co‐localization of α‐synuclein fibrils Alexa‐488 and ChFP‐α‐syn puncta. Data are shown as mean ± s.e.m. After co‐culture, 11% of the transferred α‐synuclein fibrils Alexa‐488 co‐localized with ChFP‐α‐syn puncta. n = 3 independent experiments.
α‐synuclein fibril transfer is favoured by cell‐to‐cell contact
To further characterize the mechanism of transfer, we first determined whether transferred α‐synuclein fibrils propagating from cell to cell co‐localize with freshly taken up fibrils. Overnight co‐cultures of donor (loaded with ATTO‐550 α‐synuclein fibrils) and acceptor cells were exposed for additional 12 h to α‐synuclein fibrils labelled with Alexa‐488. As expected, exogenously added Alexa‐488 α‐synuclein fibrils were taken up by both donor and acceptor cells with similar efficiency (Fig 3A). Alexa‐488 fibrils co‐localized with the ATTO‐550 fibrils in donor cells indicating that fibrils taken up initially (ATTO‐550) and freshly taken up fibrils (Alexa‐488) are directed to the same sub‐cellular compartment (Fig 3B). Intriguingly, however, while in donor cells we observed high co‐localization percentage between ATTO‐550‐ and Alexa‐488‐labelled fibrils (and reverse) (66 ± 0.66%), indicating that the two fibril batches were taken up following the same pathway (Fig 3B), in acceptor cells the taken up (Alexa‐488) and transferred fibrils (ATTO‐550) from the donor population co‐localized much less (16 ± 0.9%) (Fig 3B). These data suggest that taken up and transferred fibrils in the acceptor cells may not undertake the same pathway.
Figure 3. α‐synuclein fibril transfer is favoured by cell‐to‐cell contact.
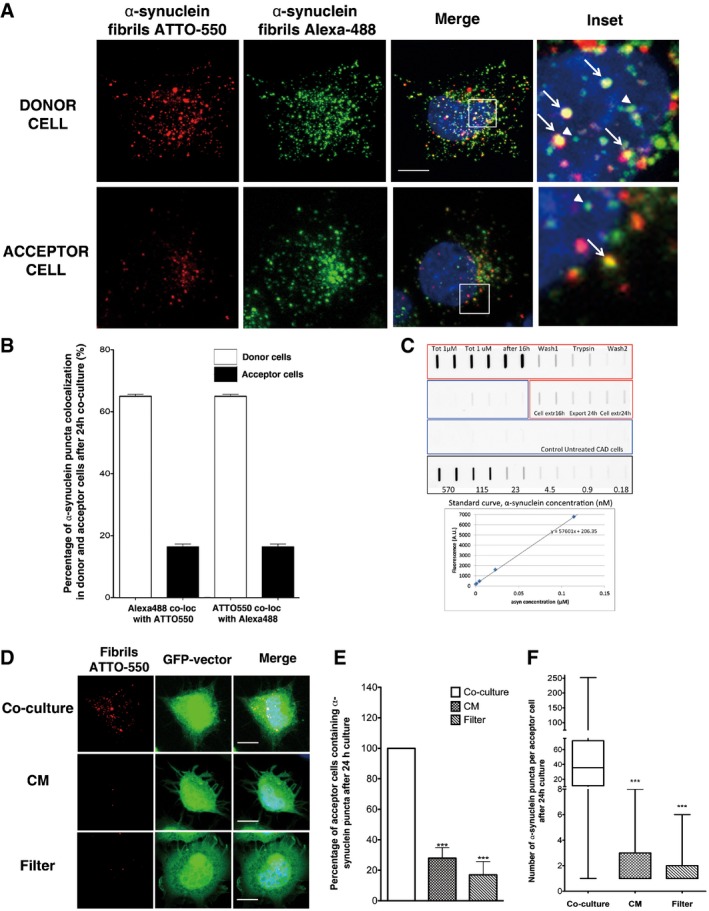
- Representative images of donor cells (upper panel) and acceptor cells (bottom panel) of the co‐culture system explained in Fig EV2E: in red, ATTO‐550 α‐synuclein fibrils; in green, α‐synuclein fibrils Alexa‐488; and in blue, nuclei. Scale bar represents 10 μm (n = 3 independent experiments). In insets, arrows point to co‐localized ATTO‐550 and Alexa‐488 α‐synuclein fibril puncta, whereas arrowheads point to puncta of α‐synuclein Alexa‐488 fibrils that do not co‐localize with fibrillar ATTO‐550 α‐synuclein.
- Quantification of the percentage of Alexa‐488 α‐synuclein fibrils co‐localizing with ATTO‐550 α‐synuclein fibrils and the reverse co‐localization in discrete puncta in donor and acceptor cells as in (A). Both measurements revealed high co‐localization of the two fluorophores in donor cells (white bar), but less in acceptor cells. Data are shown as mean ± s.e.m. of 3 independent experiments.
- The amount of fibrils taken up by CAD cells exposed to 1 μM fibrils, remaining in the cells and exported into the medium after 24‐h incubation was quantified by a filter trap assay. n = 3 independent measurements, filtered in duplicate. The standard fluorescence curve for increasing ATTO‐550 α‐synuclein fibril concentrations is given.
- Representative images of GFP‐transfected acceptor cells that were either (i) co‐cultured with donor cells (upper panel, Co‐culture), (ii) cultured with the conditioned medium of donor cells (middle panel, CM) or (iii) physically separated from donor cells using a filter (bottom panel, Filter). Prior to culture, donor cells were loaded with ATTO‐550 α‐synuclein fibrils. In red: α‐synuclein fibrils, in green: acceptor cells and in blue: nuclei. Scale bars represent 10 μm. n = 3 independent experiments.
- Quantification of the percentage of acceptor cells containing α‐synuclein fibrils from images such as those presented in (C). When acceptor cells were cultured with the conditioned medium from donor cells previously treated with α‐synuclein fibrils (not diluted, concentrated or diluted) or co‐cultured with a filter, the percentage of acceptor cells containing α‐synuclein puncta was low. Data are shown as mean ± s.e.m. of 3 independent experiments. ***P < 0.001 by two‐tailed Student's t‐test.
- Quantification of the number of puncta of α‐synuclein fibrils per acceptor cell from (D). While in co‐culture conditions the number of α‐synuclein puncta in acceptor cells is on average 35 (median), this number was on average 1 puncta per acceptor cells in both CM and filter conditions (***P < 0.001 by two‐tailed Mann–Whitney U‐test). In the box and whisker plot, boxes extend from the first to the third quartile, the line inside the boxes shows the median and the whiskers represent the min/max value of at least 100 cells scored for each independent experiment (n = 3).
We further observed that the internalization of exogenous α‐synuclein fibrils is dependent on dynamin‐1 as the expression of dominant‐negative dynamin‐1 (GFP‐Dyn1 K44A) affected uptake (Fig EV4A and B). Interestingly, the overexpression of this mutant (GFP‐Dyn1 K44A) did not affect α‐synuclein fibril transfer in CAD cells (Fig EV4C–E). These data indicate that transfer of fibrils from donor to recipient cells in co‐culture is dynamin independent in contrast to uptake of fibrils from the medium.
Figure EV4. α‐synuclein fibrils are partially internalized in a dynamin‐dependent manner.
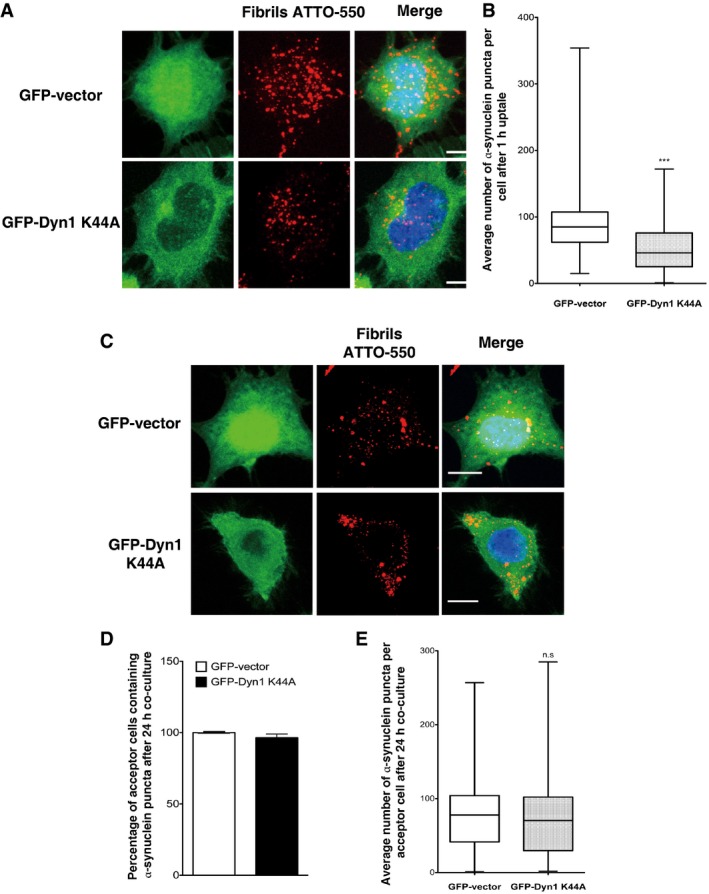
- Representative images of GFP vector (upper panel) or GFP‐dynamin‐1 K44A‐transfected cells (bottom panel) challenged for 1 h with ATTO‐550 α‐synuclein fibrils, trypsin‐washed and then fixed: in red, α‐synuclein fibrils; in green, GFP vector or GFP‐dynamin‐1 K44A‐transfected cells; and in blue, nuclei. Scale bars represent 5 μm. n = 3 independent experiments.
- Quantification of the average number of α‐synuclein fibrils per cell obtained from experiments in (A) shows a significant decrease in the number of α‐synuclein fibrils in dynamin dominant‐negative cells (GFP‐Dyn1 K44A) compared to control cells (GFP vector) indicating a partial dynamin‐dependent mechanism of α‐synuclein fibril uptake in neuron‐like cells (***P < 0.001 by two‐tailed Mann–Whitney U‐test). n = 3 independent experiments.
- Representative images of GFP vector (upper panel) or GFP‐dynamin‐1 K44A‐transfected acceptor cells (bottom panel) after 24‐h co‐culture with donor cells loaded with α‐synuclein fibrils: in red, α‐synuclein fibrils; in green, GFP vector or GFP‐dynamin‐1 K44A‐transfected acceptor cell; and in blue, nuclei. Scale bars represent 10 μm. n = 3 independent experiments.
- Relative percentage of acceptor cells containing α‐synuclein fibrils after co‐culture as in (C) revealed that transfer of α‐synuclein fibrils does not depend on dynamin‐1. Data are shown as mean ± s.e.m. (n.s. with GFP vector raw percentage set to 100%, not significant by Student's t‐test).
- Quantification of the average number of α‐synuclein fibrils per acceptor cells after co‐culture as in (C) showing no significant difference in the number of α‐synuclein fibrils in acceptor cells in control (GFP vector) and dynamin dominant‐negative (GFP‐Dyn1 K44A) conditions. Data are shown as mean ± s.e.m. of three independent experiments (n.s., not significant by two‐tailed Mann–Whitney U‐test).
Data information: In the box and whisker plots shown in (B and E), boxes extend from the first to the third quartile, the line inside the boxes shows the median and the whiskers represent the min/max value of at least 100 cells scored for each experiment.
To directly assess the role of secretion in the transfer, we loaded CAD cells with ATTO‐550 fibrils for 16 h and first assessed the amount of fibrils that remained within the cells and that were exported from the cells into the medium after 24 h. Our quantitative assessment indicates that the proportion of α‐synuclein fibrils taken up by cells within 16 h is 2.7 ± 0.5% (25–30 nM internalized for 1 μM in total). The proportion of fibrillar α‐synuclein remaining in the cells and exported into the medium after 24‐h incubation was 55 and 45 ± 5%, respectively (Fig 3C). We then directly challenged the acceptor cell population with the 24‐h conditioned medium (CM) of donor cells (Figs EV2B and 3D, panel CM). To faithfully mimic the condition of co‐culture, the CM was not concentrated, diluted nor centrifuged. In this condition, the percentage of acceptor cells containing α‐synuclein puncta decreased substantially (28.3 ± 6.9% in CM condition compared to 100% in co‐culture condition) (Fig 3E, CM). Noteworthy, the decrease of fibril transfer was accompanied with a drastic decrease in the number of α‐synuclein puncta transferred per acceptor cell (i.e. less than two puncta per cell compared to 38 when direct contact was allowed) (Fig 3F, CM).
When co‐culture experiments where the donor and acceptor cells were separated by filters were performed (Figs EV2C and 3D, Filter), the percentage of acceptor cells containing α‐synuclein puncta and the number of puncta in acceptor cells were drastically reduced compared to the control condition (Fig 3E and F). It is worth noting that this percentage was even more reduced than for the CM condition (17.4 ± 8.7% and 28.3 ± 6.9% in filter and CM conditions, respectively) (Fig 3E). In these conditions, a 0.4‐μm membrane pore size semipermeable filter was used to prevent contact between donor and acceptor cells, but to allow the passage of soluble factors between the two cell populations (Gousset et al, 2009; Pasquier et al, 2012; Costanzo et al, 2013). One possibility to explain this result is that filters are impairing the passage of large cell debris contained in CM, which in turn will be responsible of the transfer observed in CM condition.
Altogether, these data indicate that in our experimental condition intercellular transfer is favoured by cell‐to‐cell contacts, and exclude a role for dynamin.
α‐synuclein fibrils induce TNT formation and are present inside TNTs
Because tunneling nanotubes (TNTs) allow direct communication between cells and were found to play a role in the spreading of prions (and prion‐like proteins) (Gousset et al, 2009; Wang et al, 2011; Costanzo et al, 2013; Ding et al, 2015), we next assessed the involvement of these structures in α‐synuclein fibril transfer. Noteworthy, cells exposed to α‐synuclein fibrils formed 20% more TNTs than control cells (Fig 4A and B), indicating that fibrils can induce TNT formation. Interestingly, following uptake of α‐synuclein fibrils, we observed a significant and persistent increase in reactive oxygen species (ROS), which could contribute to the increase in the TNT number (Wang et al, 2011; Gousset et al, 2013) (Fig EV1D and E). Furthermore, as early as 16 h after uptake, α‐synuclein fibrils were found in the lumen of TNTs between donor cells (Fig 4C). Most importantly, in co‐culture α‐synuclein fibrils were present inside TNTs that directly connect donor and acceptor cell populations (Fig 4D). These results together with the data indicating that cell‐to‐cell contact contributes to the efficient α‐synuclein fibril transfer strongly support the implication of TNTs in this process.
Figure 4. α‐synuclein fibrils induce TNT formation and use TNTs to efficiently spread between neuron‐like CAD cells.
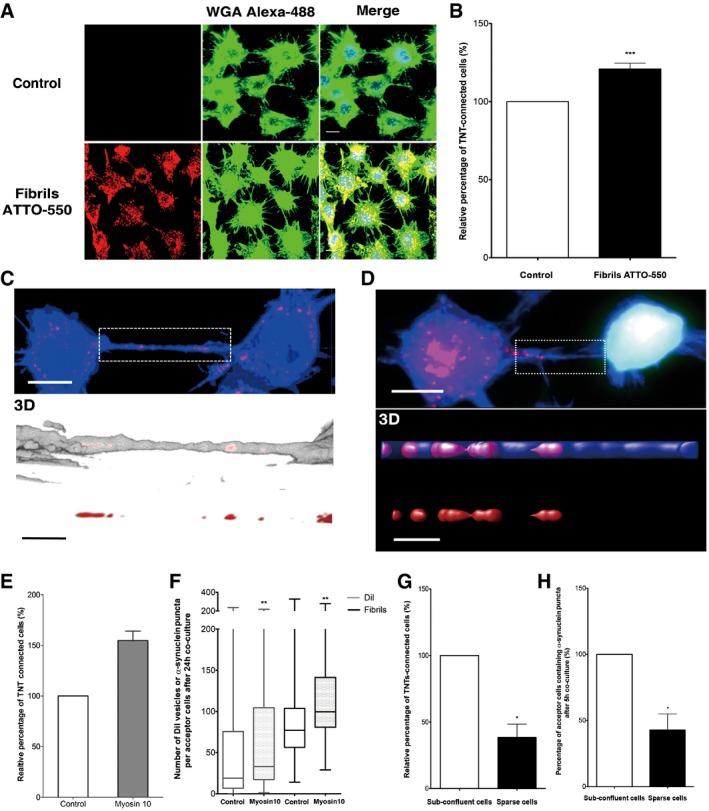
- Representative images of control cells (upper panel) or cells treated with ATTO‐550 α‐synuclein fibrils (bottom panel) for 16 h: in red, α‐synuclein fibrils; in green, WGA Alexa‐488 (plasma membrane dye marker); in blue, DAPI. Scale bar represents 10 μm. n = 3 independent experiments.
- Relative percentage of TNT‐connected cells after α‐synuclein fibril treatment as in (A) shows an increase in TNT number upon fibril treatment. Data are shown as mean ± s.e.m. (***P < 0.001 by paired, two‐tailed Student's t‐test).
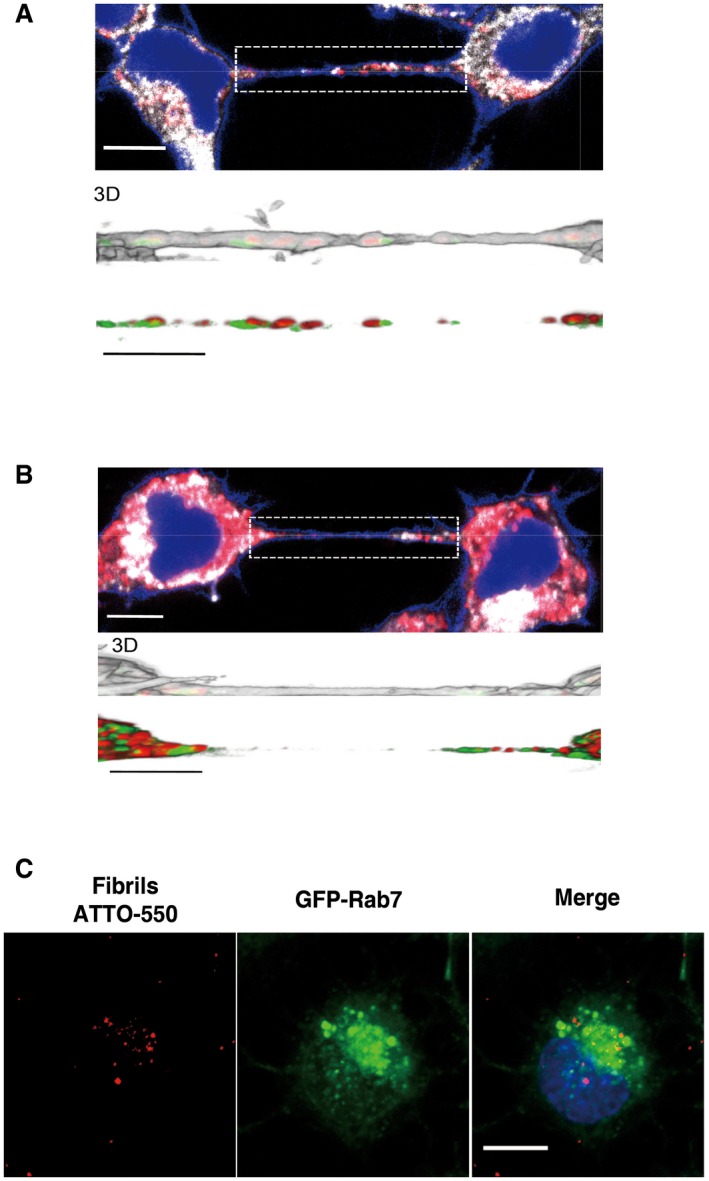
- Confocal images showing one TNT connecting two cells loaded with ATTO‐550 α‐synuclein fibrils (in red) 16 h after co‐culture and stained with WGA Alexa‐488 (in blue). The image represents a Z‐projection of the several middle stacks where the TNT is located (top panel). Insets show 3D reconstructions of the TNT using ICY software (middle panel, merge; bottom panel, red channel). Several α‐synuclein fibrils (red) are present in the lumen of the TNT (WGA Alexa‐488 in white). Scale bars represent 10 μm (confocal images) and 4 μm (insets).
- Confocal image showing a TNT connecting a donor cell containing α‐synuclein fibrils and a GFP‐transfected acceptor cell (top panel) strongly suggesting α‐synuclein fibril transfer from donor to acceptor cell. Insets show 3D reconstructions of TNT containing α‐synuclein fibrils in the lumen of the TNT: in red, α‐synuclein fibrils; in green, GFP‐transfected acceptor cells; in blue, WGA Alexa‐633. Scale bars represent 10 μm (confocal images) and 3 μm (insets).
- Relative percentage of TNTs in cells containing α‐synuclein fibrils untransfected (control) or transfected with myosin‐10 (myosin‐10). Overexpression of myosin‐10 in the donor cell population led to an increase in the number of TNTs. Data are shown as mean ± s.e.m.
- Quantification of the average number of ATTO‐550 α‐synuclein fibrils per acceptor cell after 24‐h co‐culture with donor cells containing α‐synuclein fibrils untransfected (control) or transfected with myosin‐10 (myosin‐10). In the box and whisker plot, boxes extend from the first to the third quartile, the line inside the boxes shows the median and the whiskers represent the min/max value of at least 100 cells scored for each independent experiment (n = 3). Note that myosin‐10 overexpression increases both the transfer of vesicles labelled with the liophilic dye DiI and the number of transferred α‐synuclein puncta in acceptor cells; n = 3 independent experiments (**P < 0.01 by two‐tailed Mann–Whitney U‐test).
- Quantification of the relative proportion of TNTs in co‐culture of donor cells containing α‐synuclein puncta and GFP acceptor cells under sub‐confluent or sparse culture conditions. Data are shown as mean ± s.e.m.; n = 3 independent experiments (*P < 0.05 by paired, two‐tailed Student's t‐test).
- Quantification of the percentage of acceptor cells containing α‐synuclein puncta of the co‐culture in (G). n = 3 independent experiments (*P < 0.05 by two‐tailed Mann–Whitney U‐test). Conditions impairing TNT formation (i.e. sparse conditions) induce a drastic decrease in TNT number and α‐synuclein fibril transfer compared to conditions allowing TNT formation (sub‐confluent conditions). Data are shown as mean ± s.e.m.
α‐synuclein fibrils use TNTs to efficiently spread between neuron‐like cells
In order to directly assess the involvement of TNTs in α‐synuclein fibril transfer, we repeated the co‐culture experiment in conditions enhancing or reducing TNT formation. We have previously shown that myosin‐10 increases both TNT number and TNT‐mediated unidirectional transfer of intracellular vesicles (Gousset et al, 2013). Therefore, we analysed whether overexpression of myosin‐10 in donor cells would affect the transfer of the fibrils. As control, we verified that upon overexpression of myosin‐10 there was an increase in TNT formation and in the amount of DiI‐labelled vesicle transfer (Fig 4E and F) and demonstrated that myosin‐10 donor cells containing α‐synuclein fibrils formed 50% more TNTs (Fig 4E). Noteworthy, after co‐culturing donor cells overexpressing myosin‐10 with acceptor cells for 24 h, a statistically relevant 1.3‐fold increase in the transfer of α‐synuclein fibrils was observed as compared to control conditions (Fig 4F). To further support the involvement of TNTs in α‐synuclein fibril transfer, we impaired TNT formation by plating co‐cultured cells in sparse conditions. Indeed, in order to establish TNTs, cells are required to be in relative close contact (sub‐confluent cells); therefore, in sparse conditions, the percentage of TNT‐connected cells was drastically reduced (42.8 ± 12.2% versus 100% in sparse and sub‐confluent conditions, respectively) (Fig 4G). In these conditions, we observed a decrease in the percentage of acceptor cells containing α‐synuclein fibrils (38.5 ± 9.9% versus 100% in sparse and sub‐confluent conditions, respectively) (Fig 4H), which paralleled the decrease in TNT number. Altogether, these results clearly show that TNTs contribute to the intercellular transfer of α‐synuclein fibrils.
α‐synuclein fibrils are predominantly found in lysosomal vesicles in the cytosol of donor cells and inside TNTs
To determine whether α‐synuclein fibrils transfer through TNTs “naked” or embedded in vesicles, we first characterized the subcellular localization of fibrils in donor cells. As expected from previous studies showing that fibrils taken up from the medium are preferentially directed to the lysosomal compartment for degradation (Sung et al, 2001; Lee et al, 2008; Liu et al, 2009; Hasegawa et al, 2011; Konno et al, 2012), we found α‐synuclein puncta in the endolysosomal compartment (Fig 5A left panel). Quantifications of co‐localization (see the Appendix) revealed that almost 90% of fibrils localized within endolysosomal vesicles with the majority of fibrils found in lysosomes (16.7 ± 6.31% in EEA1‐, 24.9 ± 0.52% in Vamp3‐ and 51.8 ± 3.08% in Lamp1‐positive vesicles) (Fig 5A right panel). Next, we investigated the subcellular localization of α‐synuclein fibrils inside TNTs. Interestingly, the large bulk of fibrils in TNTs were found in Lamp1‐positive vesicles and only rarely did they co‐localized with markers of the early or recycling endosomes (Figs 5B and EV5A and B), indicating that fibrils travel inside TNT‐connecting cells preferentially confined in lysosomal vesicles.
Figure 5. α‐synuclein fibrils are predominantly found in lysosomal vesicles in the cytosol of donor cells and inside TNTs after transfer.
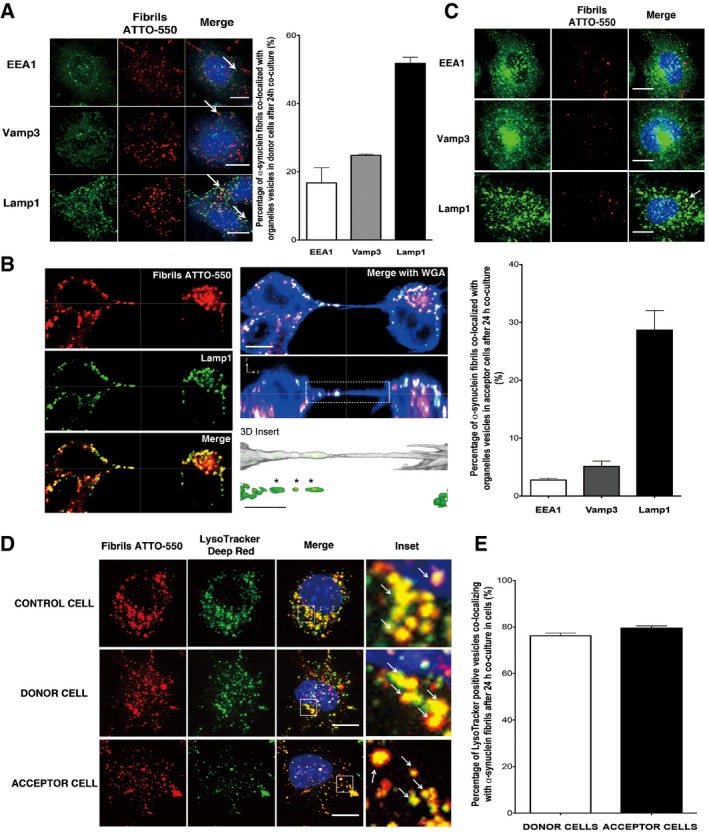
- Subcellular localization of α‐synuclein fibrils in donor cells after 24‐h co‐culture. The left panels show representative images of co‐localization of α‐synuclein puncta with early endosomes (EEA1, top panel), recycling endosomes (Vamp3, middle panel) and lysosomal vesicles (Lamp1, bottom panel) (see arrows for co‐localized spots): in red, α‐synuclein fibrils; in green, EEA1, Vamp3 or Lamp1; and in blue, nuclei. Scale bars represent 10 μm. On the right, the bar graph represents the percentage of α‐synuclein puncta co‐localized with endolysosomal vesicles. Data are shown as mean ± s.e.m. from three independent experiments.
- Confocal images showing a TNT connecting two cells loaded with ATTO‐550 α‐synuclein fibrils immunostained with Lamp1 (in green). Labelling of TNTs is performed using a plasma membrane dye (WGA Alexa‐633, in blue). The image represents a Z‐projection of the several middle stacks where the TNT is located. The merged image with WGA Alexa‐633 (blue), the orthogonal view and insets showing 3D reconstructions of the TNT (with WGA in white) are on the right. Several α‐synuclein fibrillar foci (in red) are present in the lumen of the TNT and embedded in Lamp1‐positive vesicles (in green). Of note, only tubular structures physically connecting remote cells and not touching the substratum were identified as TNTs to distinguish them from filopodia. Scale bars represent 10 μm (confocal images) and 3 μm (insets). The merged image of α‐synuclein fibrils (red) and Lamp1 (green) channels and the respective single channels are shown on the left panel.
- The top panels show representative images of GFP‐transfected acceptor cells after 24‐h co‐culture with donor cells containing ATTO‐550 α‐synuclein fibrils. Immunofluorescence was performed with endolysosomal organelle markers (top panel, EEA1; middle panel, Vamp3; and bottom panel, Lamp1) and revealed that α‐synuclein fibrils co‐localized with lysosomal vesicles (see arrow): in red, α‐synuclein fibrils; in green, organelle markers; and in blue, nuclei. Scale bars represent 10 μm. The bar graph below shows the quantification of the percentage of co‐localization of α‐synuclein fibrils with organelle markers, revealing that α‐synuclein puncta co‐localized mostly with lysosomal vesicles. Data are shown as mean ± s.e.m. from three independent experiments.
- Representative confocal pictures of control cells loaded with ATTO‐550 α‐synuclein fibrils and LysoTracker Deep Red (top panel), and of donor cells previously loaded with ATTO‐550 α‐synuclein fibrils and LysoTracker Deep Red (middle panel), that were co‐cultured for 24 h with GFP‐transfected acceptor cells (bottom panel, GFP vector not shown). In red, α‐synuclein fibrils; in green, LysoTracker Deep Red; and in blue, nuclei. Scale bars represent 10 μm, and arrows in inset pinpoint fibrils co‐localizing with LysoTracker‐positive vesicles.
- The percentage of co‐localization of LysoTracker‐positive vesicles with α‐synuclein fibrils revealed that 80% of lysosomal vesicles that transferred from donor to acceptor cells contained α‐synuclein fibrils, thus demonstrating direct transfer of α‐synuclein fibrils from donor to acceptor cells in majority inside lysosomal vesicles derived from donor cells. Data are shown as mean ± s.e.m. from three independent experiments.
Figure EV5. α‐synuclein fibrils are not found in endosomal vesicles inside TNTs and do not co‐localize with lysosomal vesicles of acceptor cells after transfer.
-
A, BConfocal images showing a TNT connecting two cells loaded with red ATTO‐550‐labelled α‐synuclein fibrils immunostained with EEA1 (A) or Vamp3 (B) (in white) and stained with WGA Alexa‐488 (in blue). The images represent a Z‐projection of the several middle stacks where TNTs are located. Insets show 3D reconstructions of TNTs using ICY software: red, ATTO‐550 fibrils; green, EEA1 (A) or Vamp3 (B); white, WGA Alexa‐488. Several α‐synuclein fibrils are present in the lumen of the TNT but do not co‐localize with EEA1 (A)‐ or Vamp3 (B)‐positive vesicles. Scale bars represent 10 μm (confocal images) and 3 μm (insets).
-
CRepresentative confocal images of GFP‐Rab7‐transfected acceptor cells after co‐culture (with donor cells containing ATTO‐550 α‐synuclein fibrils) show no co‐localization between transferred α‐synuclein fibrils (in red) and GFP‐Rab7‐positive vesicles (in green). Scale bar represents 10 μm, and the nucleus is in blue (n = 3 independent experiments).
α‐synuclein fibrils transferred in acceptor cell via TNTs are confined inside lysosomal vesicles derived from donor cells
To examine the destiny of α‐synuclein fibrils after TNT‐mediated transfer (i.e. once they reached the acceptor cells), we performed similar co‐localization studies and found that transferred fibrils predominantly co‐localized with Lamp1‐positive vesicles (28.7 ± 3.37%) in acceptor cells (Fig 5C). Only a few fibrils co‐localized with EEA1‐ or Vamp3‐positive vesicles (2.75 ± 0.55% and 5.13 ± 1.56% for EEA1 and Vamp3, respectively) (Fig 5C). These observations are consistent with the predominant lysosomal localization of α‐synuclein fibrils in the TNT lumen and indicate that once transferred to acceptor cells, the majority of α‐synuclein fibrils are confined inside lysosomal vesicles.
Finally, in order to demonstrate that lysosomal vesicles containing α‐synuclein fibrils in acceptor cell came from donor cells (i.e. transfer), we pre‐stained the lysosomes of donor cells with LysoTracker (i.e. lysosomotropic agent labelling lysosomal vesicles). After 24‐h co‐culture with acceptor cells, 100% of donor and acceptor cells contained LysoTracker‐positive vesicles indicating transfer of lysosomes from donor to acceptor cells (Fig 5D). Importantly, almost 80% of LysoTracker‐positive vesicles co‐localized with α‐synuclein fibrils in both donor and acceptor cells (76.2 ± 1.2% and 79.5 ± 0.9% for donor and acceptor cells, respectively) (Fig 5E). These results clearly indicate that α‐synuclein fibrils in acceptor cells are inside lysosomes coming from donor cells. Consistent with this, transferred α‐synuclein fibrils did not co‐localize with GFP‐Rab7‐labelled lysosomal vesicles of the acceptor cells (Fig EV5C).
α‐synuclein fibrils transfer efficiently between neurons
We next investigated α‐synuclein fibril transfer between primary cortical neurons. Firstly, we determined by quantitative confocal microscopy the proportion of primary cortical neurons (6 div) that internalized fluorescent α‐synuclein fibrils after 16 h of incubation with two different fibril concentrations (0.5 and 1 μM). Internalization was very efficient and increased with the concentration of fibrils (around 75 and 100%, respectively) (Figs EV1F and 6A). Like in CAD cells, uptake of α‐synuclein fibrils did not lead to an increase in LDH release over 72 h as compared to control neurons (Fig EV1G). Cortical neurons take up α‐synuclein fibrils as early as 3 and up to 9 days in vitro (div) (Appendix Fig S1); however, we chose to perform the transfer experiments with 1‐week‐old neurons given that it gave us the best balance between good cell maturity and density.
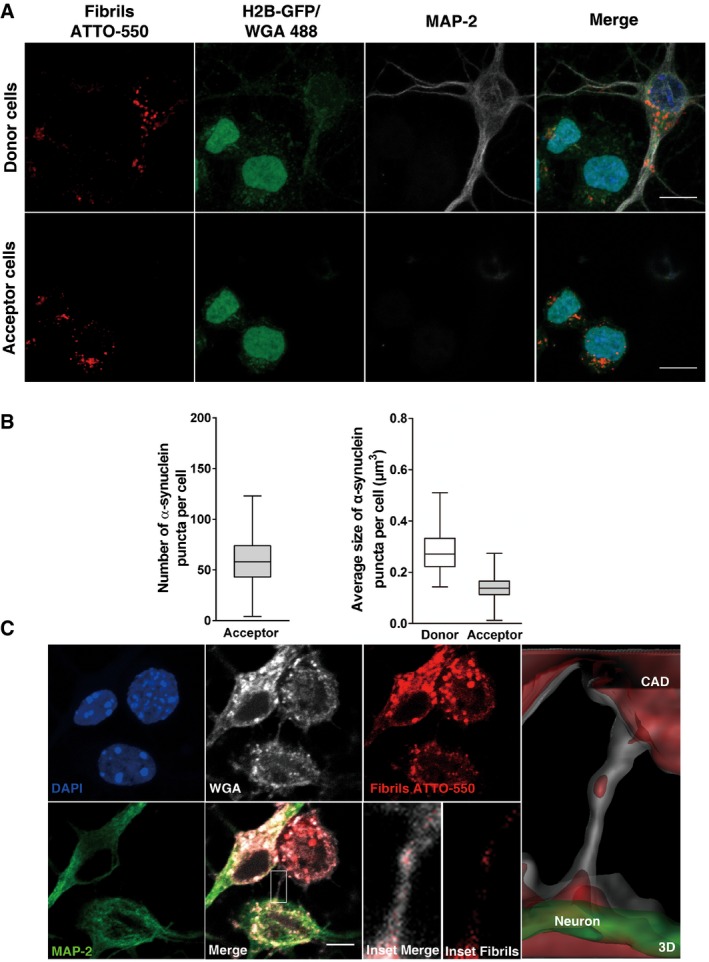
Figure 6. α‐synuclein fibrils are found in lysosomes and are efficiently transferred between primary neurons.
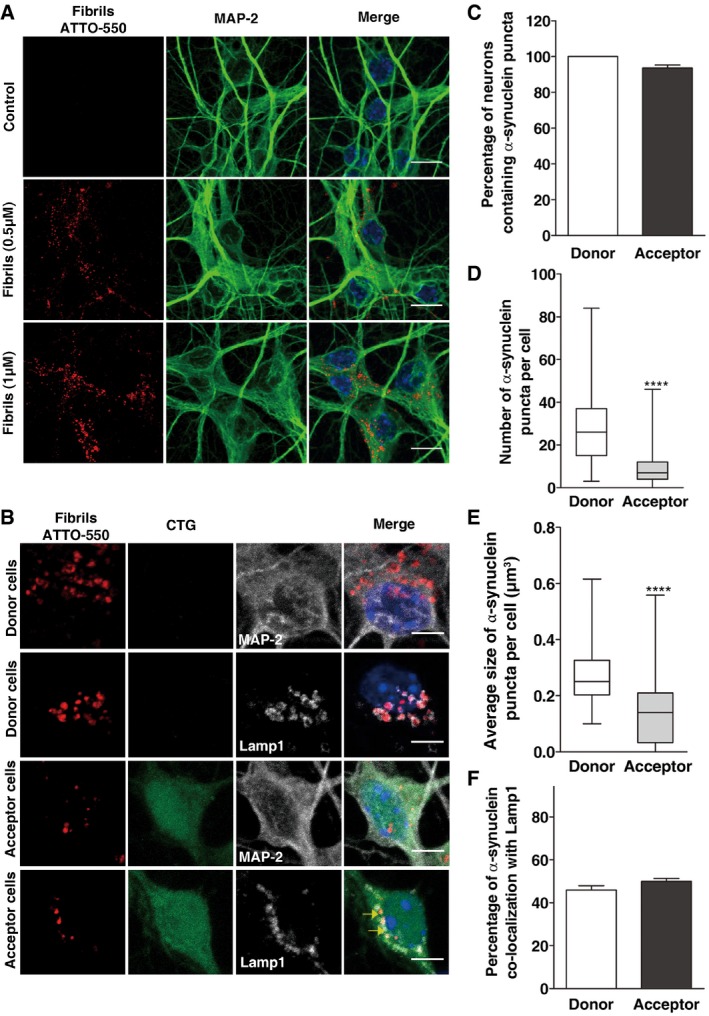
- Representative images of control (upper panel) and α‐synuclein‐loaded (middle, 0.5 μM; bottom, 1 μM) neurons after 16 h. In red, α‐synuclein fibrils; in green, MAP‐2; and in blue, nuclei. Scale bars represent 10 μm.
- Representative images of donor (upper panels) and acceptor neurons (bottom panels) after 72 h of co‐culture. Donor neurons were loaded with α‐synuclein fibrils prior to co‐culture with CTG‐labelled acceptor neurons and then cells were labelled either with MAP‐2 (first and third panels) or Lamp1 (second and fourth panels). In red, α‐synuclein fibrils; in green, CTG; in white, MAP‐2/Lamp1; and in blue, nuclei. Scale bars represent 5 μm. Yellow arrows point to co‐localized ATTO‐550 α‐synuclein puncta and Lamp1.
- The graph bar shows the percentage of donor (white bar) and acceptor (black bar) neurons containing α‐synuclein puncta. Data are shown as mean ± s.e.m.
- The box plot depicts the number of puncta in donor (white) and acceptor (grey) neurons.
- Box plot showing the distribution of the average size of α‐synuclein puncta in donor (white) and acceptor (grey) neurons.
- The graph bar represents the percentage of α‐synuclein puncta co‐localized with lysosomes in donor (white) and acceptor (black) neurons. Data are shown as mean ± s.e.m.
To study neuron‐to‐neuron transfer of α‐synuclein fibrils, “donor” neurons, exposed overnight to α‐synuclein fibrils (1 μM), were co‐cultured with naïve freshly dissected “acceptor” CellTracker Green (CTG)‐labelled neurons for 72 h (Fig EV2F). Appropriate controls were included in every experiment in order to assess health of the young acceptor neurons (Appendix Fig S2). After 72‐h co‐culture, the number and size of puncta in both donor and acceptor cells were quantified by confocal microscopy using the same script of the ICY software employed for CAD cells (Appendix Fig S3). Note that because the acceptor neurons were pre‐labelled in green with CTG, it was possible to easily discriminate them from the donor population (Appendix Figs S2 (lower panel) and S3). Under these experimental conditions, 94 ± 1.6% of acceptor neurons contained at least one α‐synuclein puncta (Fig 6B and C). More precisely, while donor cells contained a median of 26 puncta, acceptor cells had a median of 7 puncta (Fig 6D). Similar to CAD cells, the mean size of puncta in donor cells (the median value is 0.25 μm3) was larger than in acceptor cells (the median value is 0.17 μm3) (Fig 6E). Taken together, these results indicate that healthy neurons are able to take up and efficiently transfer α‐synuclein fibrils to co‐cultured neurons, in agreement with previous data (Freundt et al, 2012).
α‐synuclein fibrils are located in lysosomal vesicles in both donor and acceptor neurons
In order to gain further insight into the mechanisms of α‐synuclein transfer between neurons, we assessed the subcellular localization of α‐synuclein puncta. Given our observations with neuron‐like cells, we focused on the lysosomal pathway. After 72 h in co‐culture, we found that the majority of α‐synuclein puncta co‐localized with Lamp1‐positive vesicles in both donor (46 ± 2.0%) and acceptor neurons (50 ± 1.4%) (Fig 6B and F).
Cell–cell contacts facilitate α‐synuclein fibril transfer between neurons
To determine whether physical contacts between neurons favour the transfer of α‐synuclein fibrils as is the case for CAD cells, we grew donor neurons, containing α‐synuclein fibrils, and CTG‐labelled acceptor neurons on separated coverslips in the same Petri dish (Costanzo et al, 2013). Under our experimental conditions, the two populations of neurons share the same culture medium but establish no physical contacts (Fig 7A, No contact). Quantitative confocal microscopy revealed that transfer of fibrillar α‐synuclein was significantly reduced under these conditions with only 3.1 ± 1.8% of the acceptor cells containing α‐synuclein puncta compared to co‐culture conditions where cells could establish contacts (Fig 7B and C).
Figure 7. Cell‐to‐cell contact facilitates α‐synuclein transfer between primary neurons.
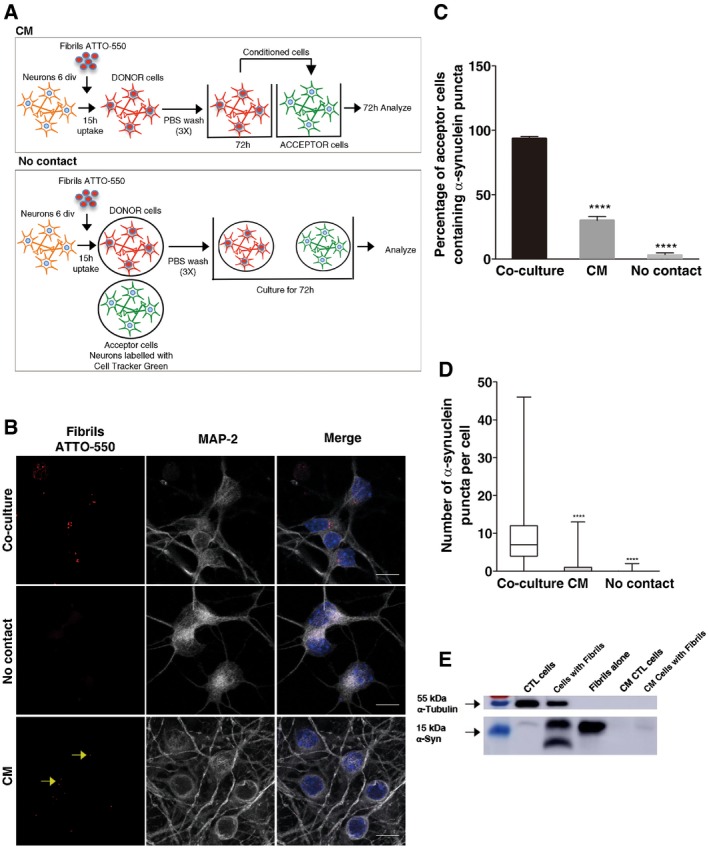
- Experimental set‐up used to assay transfer through conditioned medium (upper scheme) and cell‐to‐cell contacts (lower scheme) in neurons. For the CM experiments, donor neurons are loaded with α‐synuclein fibrils for 16 h, washed 3 times with PBS, and then fresh medium is added and left to condition for 72 h. CM is then collected and transferred to acceptor neurons (10 div) for 72 h. In the cell‐to‐cell contact impairment (No contact) experiment, the donor (already loaded) and newly dissected acceptor (already labelled) neurons are plated on different coverslips placed in the same Petri dish. In both experiments, the percentage of cells containing α‐synuclein ATTO‐550 puncta, and the number and mean size of α‐synuclein puncta per cell are quantified using the ICY software after 72 h.
- Representative images of acceptor neurons that were either (i) co‐cultured with donor neurons (upper panel, Co‐culture), (ii) physically separated from donor cells (middle panel, No contact) or (iii) cultured with the conditioned medium of donor neurons (bottom panel, CM). In red, α‐synuclein fibrils; in white, acceptor neurons; and in blue, nuclei. Scale bars represent 10 μm. Yellow arrows point to ATTO‐550 α‐synuclein puncta detected in the CM condition.
- The bar graph shows the percentage of acceptor cells containing α‐synuclein puncta from images such as those presented in (B). ****P < 0.001 compared to the co‐culture condition by two‐tailed Student's t‐test. Data are shown as mean ± s.e.m. from three independent experiments (where at least 80 cells were counted per experiment).
- The box plot shows the number of α‐synuclein puncta in acceptor neurons in co‐culture (white), in CM (grey) and in the No contact condition (light grey). Boxes extend from the first to the third quartile, the line inside the boxes shows the median and the whiskers represent the min/max value of at least 80 cells scored for each independent experiment. ****P < 0.001 compared to the co‐culture condition by two‐tailed Mann–Whitney U‐test (n = 3 independent experiments).
- Western blot analysis of α‐synuclein indicates the presence of some α‐synuclein in the CM of neurons loaded with the fibrils after 72 h compared to control medium and to lysate of cells directly exposed to the fibrils. α‐tubulin was used as a loading control.
To assess the contribution of secretion of α‐synuclein from donor cells to the propagation process, we added the 72‐h conditioned medium from donor neurons (loaded overnight with fluorescent α‐synuclein fibrils) to naïve acceptor neurons (Fig 7A, CM). As in the case of CAD cells (Fig 3C–E), the CM was not concentrated, diluted or centrifuged prior to its addition to acceptor cells. We found a significant decrease both in the percentage of acceptor cells containing α‐synuclein (30 ± 3%) and in the mean number of α‐synuclein puncta per cell (0.9) (Fig 7B–D). We also analysed the presence of α‐synuclein in the 72‐h CM of donor cells. By Western blots, we detected a strong α‐synuclein signal in the cell lysate of loaded neurons (overnight loading plus 72 h) compared to control cells. We also detected α‐synuclein in the 72‐h CM of loaded neurons, albeit this signal was quite low (Fig 7E). Altogether, these results suggest that cell‐to‐cell contacts contribute to neuron‐to‐neuron transfer of α‐synuclein fibrils.
α‐synuclein fibrils efficiently transfer between neurons and CAD cells
Because of the lack of a specific TNT marker, identification of TNTs in primary neurons is challenging. To determine whether TNTs are involved in the transfer of α‐synuclein from neurons to recipient cells, we co‐cultured acceptor H2B‐GFP‐transfected CAD cells with mature donor neurons, pre‐exposed overnight to fluorescent α‐synuclein fibrils. The proportion of the recipient cells containing α‐synuclein puncta was 100% after 24 h of co‐culture (Fig 8A). Of interest, the number (the median value is 58) and average size (the median value is 0.14 μm3) of α‐synuclein foci were very similar to the number and size found in the acceptor cells upon cell‐to‐cell‐mediated transfer of fibrillar α‐synuclein between CAD cells (compare Fig 8B to Fig 1D and E). Most importantly, under these conditions we could identify TNTs extending between CAD cells and the soma and neurites of primary cortical neurons and in some cases TNTs containing α‐synuclein puncta (Fig 8C). We conclude from these observations that TNT‐mediated cell‐to‐cell contacts contribute to the transfer of fibrillar α‐synuclein.
Figure 8. Transfer of α‐synuclein fibrils between neurons and neuron‐like CAD cells.
- Representative images of donor (upper panel) and acceptor cells (bottom panel) after 24 h of co‐culture. Donor neurons were loaded with α‐synuclein fibrils prior to co‐culture with H2B‐GFP acceptor CAD cells. In red, α‐synuclein puncta; in green, acceptor CAD cells; in white, donor neurons; and in blue, nuclei. The images of donor cells are representative Z‐stack projections of the lower slices where these cells are located, and the images corresponding to acceptor CAD cells are Z‐stack projections of the upper slices, covering the whole cell body. Scale bars represent 10 μm.
- Box plots showing the number (left side) and average size (right side) of α‐synuclein puncta in acceptor CAD cells after 24 h of co‐culture with donor neurons. (n=3 independent experiments). In the box and whisker plots, boxes extend from the first to the third quartile, the line inside the boxes shows the median and the whiskers represent the min/max value of at least 80 cells scored for each independent experiment.
- Representative images showing a TNT detected between CAD cells and neurons after 24 h of co‐culture. In green, MAP‐2; in white, WGA; in red, α‐synuclein puncta; and in blue, nuclei. The merged image in the bottom panel shows in detail the TNT connecting the cells. The insets and the 3D reconstruction of the neuron (green) and the CAD cell (white) show the presence of α‐synuclein puncta inside the TNT. Scale bar represents 5 μm.
Discussion
While the transfer of α‐synuclein between co‐cultured cells in vitro has been convincingly demonstrated, the nature of the transferred α‐synuclein and the mechanism of transfer have not been defined (Desplats et al, 2009; Danzer et al, 2011; Hansen et al, 2011; Freundt et al, 2012; Bae et al, 2014). Characterizing both these issues is critical for designing strategies aimed at interfering with the propagation component of the pathology. To address this, we assessed the intercellular transfer of well‐characterized recombinant human fluorescent α‐synuclein fibrils of defined structure and molecular mass proven to induce Lewy body‐like inclusion in rat (Peelaerts et al, 2015), in co‐culture of CAD cells and primary neurons. To our knowledge, our study is the first evidencing high levels of transfer in neuronal‐like cells and in primary neurons (100% of acceptor cells compared to on average 2–10% for equal or longer duration of co‐culture) (Desplats et al, 2009; Hansen et al, 2011; Bae et al, 2014). This may be attributed to the nature of α‐synuclein fibrils used in our study as opposed to polymorphic preparations and overexpressed α‐synuclein (which does not appear to form disease‐associated fibrillar aggregates) used in previous studies (Desplats et al, 2009; Hansen et al, 2011; Bae et al, 2014). In addition using confocal microscopy combined with a dedicated plugin for quantitative image analysis, we could document both the number and size of transferred α‐synuclein fibrils, which has been proven very challenging using manual methods (Desplats et al, 2009; Danzer et al, 2011; Hansen et al, 2011; Kondo et al, 2011; Freundt et al, 2012; Konno et al, 2012; Lee et al, 2013; Bae et al, 2014).
We demonstrate that cell‐to‐cell contacts contribute to efficient transfer of α‐synuclein fibrils in CAD cells and primary neurons. This is in agreement with a recent elegant in vivo study showing that in mice the intercellular transfer of α‐synuclein from the olfactory bulb to other brain regions was likely not due to passive diffusion through cerebrospinal fluid or brain parenchyma, but rather relied on cell‐to‐cell contacts (Rey et al, 2013). Impairing cell‐to‐cell contact in our model systems (both in CAD cells and in primary cortical neurons) reduced the transfer of α‐synuclein fibrils. Transfer through conditioned media was not as efficient as that through donor cells physically contacting recipient cells. Previous studies where the conditioned medium was concentrated (200X) suggested secretion as a major path for α‐synuclein transfer (Desplats et al, 2009; Hansen et al, 2011; Bae et al, 2014). While secretion in the medium contributes to propagation of α‐synuclein fibrils, physical contacts between cells significantly increased transfer. This means that either physical contacts between cells or tight proximity is essential for efficient transfer of α‐synuclein fibrils. It is also worth noting that studies in vivo have demonstrated lower levels of the secreted α‐synuclein protein in the cerebrospinal fluid in PD subjects compared to control subjects (Tokuda et al, 2006).
Uptake of preformed α‐synuclein fibrils has been shown to be partially dependent on dynamin (Hansen et al, 2011; Konno et al, 2012; Reyes et al, 2014). To assess the contribution of dynamin‐dependent processes on fibrillar α‐synuclein transfer, we overexpressed the dominant‐negative form of dynamin‐1 in the acceptor CAD cells. We confirmed that uptake of exogenous fibrils is partially dynamin‐1 dependent. However, the overexpression of dominant‐negative forms of dynamin‐1 did not affect the cell‐to‐cell transfer of α‐synuclein fibrils. Previous studies employed donor cells overexpressing α‐synuclein, which does not appear to form aggregates and was reported to be secreted. Significantly, we found that in acceptor cells taken up α‐synuclein fibrils co‐localized little with fibrils transferred from donor cells, which suggest that fibrils may use different pathways to be internalized or to transfer between neuron‐like cells in our co‐culture conditions.
By analysing three dimensionally reconstructed confocal images, we observed α‐synuclein fibrils in the lumen of TNT‐connecting donor and acceptor CAD cells. Importantly, the transfer of fibrils was greatly increased when TNT formation was enhanced by overexpression of the TNT inducer myosin‐10 (Gousset et al, 2013), while it decreased when TNT formation was impaired (i.e. in sparse conditions or using physical barriers). This suggests that TNTs contribute to intercellular transfer of α‐synuclein fibrils. Interestingly, we found that α‐synuclein fibrils enhance TNT formation. The mechanism for this increase needs to be further studied; however, we report a sustained increase in ROS, which could account for this observation. We have previously reported that oxidative stress (hydrogen peroxide) induces TNT formation in CAD cells (Gousset et al, 2013). Thus, α‐synuclein fibrils may induce TNT formation through ROS and hijack this process to spread efficiently. In support of this hypothesis, Wang and colleagues have shown that rat astrocytes, subjected to oxidative stress, form TNTs to selectively connect with naïve unstressed cells (Wang et al, 2011). We propose that this should favour the oriented propagation of α‐synuclein aggregates from stressed, aggregate‐containing cells, to healthy counterparts, and could explain (in part) the topographical and stereotypical spreading of α‐synuclein inclusions described in the Braak staging (Braak et al, 2003b). Consistent with this view, myosin‐10 both enhances the unidirectional transfer of vesicles through TNTs (Gousset et al, 2013) and increases the number of fibrils transferred in acceptor cells. These observations suggest that intercellular transfer of α‐synuclein fibrils through TNTs is mainly unidirectional (from donor stressed cells to unstressed acceptor cells).
How α‐synuclein fibrils are transported in TNTs and to what compartment are they directed to after they reach the acceptor cells are important questions. Endogenous α‐synuclein aggregates are targeted to lysosomes both in vivo and in cell models (Cuervo et al, 2004; Spencer et al, 2009; Mak et al, 2010), suggesting an important role of the autophagic and lysosomal pathways in the degradation of misfolded proteinaceous aggregates in neurodegenerative diseases (Zhang et al, 2009; Nixon, 2013). We found the majority of preformed α‐synuclein fibrils inside lysosomal vesicles in donor cells (Sung et al, 2001; Lee et al, 2008; Liu et al, 2009; Konno et al, 2012). We further discovered that fibrils are transported to acceptor cells in the lumen of TNTs within lysosomal vesicles. The finding that α‐synuclein fibrils traffic inside lysosomes in TNTs is reminiscent of other studies reporting a TNT‐dependent mechanism of lysosome transfer in both healthy and pathological conditions (Rustom et al, 2004; Gousset et al, 2009; Yasuda et al, 2011; Naphade et al, 2015). Of specific interest, in the context of a lysosomal disorder, Naphade and colleagues have shown that damaged lysosomes are transferred from diseased fibroblasts towards healthy macrophages (Naphade et al, 2015). Interestingly, α‐synuclein aggregation has been shown to cause lysosomal dysfunction in vivo and in vitro (Chu et al, 2009; Dehay et al, 2010; Alvarez‐Erviti et al, 2011). This appears to be very relevant for PD pathology, which is associated with lysosomal dysfunctions (Bourdenx et al, 2014). In our cell models (CAD cells and primary neurons), α‐synuclein fibrils accumulate in lysosomal vesicles. We further observed an increase in the lysosome size similar to what was reported in α‐synuclein‐induced lysosomal dysfunction (Tanik et al, 2013). Based on these findings, we formulate the hypothesis that donor cells overloaded with damaged lysosomes containing α‐synuclein fibrils dispose of this material by transferring it in a “targeted way” to healthy cells by hijacking the trafficking of TNT‐mediated lysosomal vesicles (see model, Fig 9). This hypothesis is fully supported by and explains the evidence in the literature showing that lysosomal impairment increases the transfer of α‐synuclein between cells (Bae et al, 2014). TNTs may also be involved in the oriented transfer of aggregated α‐synuclein from neurons to astrocytes. The latter have been indeed shown to take up and concentrate very efficiently fibrillar α‐synuclein (Reyes et al, 2014).
Figure 9. Model for TNT‐mediated intercellular transfer of fibrillar α‐synuclein.
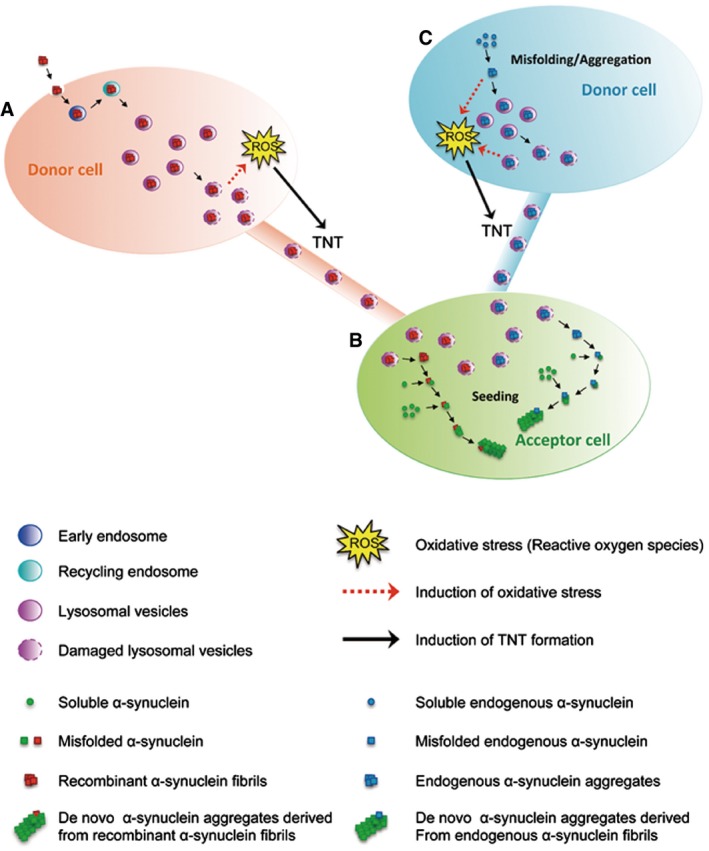
-
A–COnce internalized in donor cells (A), recombinant human α‐synuclein fibrils are mainly targeted to lysosomal vesicles (and found to a lesser extend in early and recycling endosomes). Lysosomal vesicles containing α‐synuclein fibrils transfer from donor to acceptor cells (B) inside TNTs. Once in the acceptor cells, α‐synuclein fibrils induce the formation of de novo α‐synuclein aggregates (seeding). We propose that (A) α‐synuclein fibrils accumulated inside lysosomes would impair their function leading to cellular stress (e.g. oxidative stress). In turn, this would induce TNT formation allowing spread to (B) healthy cells in order to lower the burden of α‐synuclein fibrils inside lysosomes. α‐synuclein fibrils would then escape lysosomes possibly by inducing LMP. Once free in the cytoplasm, they would recruit soluble α‐synuclein and induce de novo formation of α‐synuclein aggregates. As a consequence, α‐synuclein fibrils would propagate from stressed to unstressed cells through TNTs contributing to the intercellular spreading of the pathology. Because endogenous α‐synuclein when aggregated is targeted to lysosomes in vivo, we propose a similar mechanism occurring for endogenously formed aggregates (C).
In order to propagate the pathology, α‐synuclein fibrils have to amplify after transfer by seeding the aggregation of their soluble counterpart. While several reports have demonstrated a seeding activity of the transferred α‐synuclein (with 2–5% of inclusion formation upon co‐culture of neuronal cells), none has so far identified the species of α‐synuclein responsible for seeding after transfer (Desplats et al, 2009; Lee et al, 2010; Hansen et al, 2011; Angot et al, 2012; Bae et al, 2014). As the majority of α‐synuclein fibrils are confined within lysosomes, how α‐synuclein fibrils seed the aggregation of their cytosolic counterpart becomes intriguing. α‐synuclein assemblies have been previously shown to induce the rupture of lysosomes in vitro (Freeman et al, 2013) and lysosomal membrane permeation (LMP) has been reported in a mouse model of PD (Dehay et al, 2010). The α‐synuclein fibrils used in this study were shown to permeabilize membranes (Pieri et al, 2012). Based on these evidences, we propose that seeding may be the consequence of lysosomal rupture and release of α‐synuclein fibrils into the cytosol (see model, Fig 9). Further studies are required to determine whether this occurs or how α‐synuclein fibrils escape the lysosomal vesicles during or after TNT‐mediated transfer.
We demonstrated here that TNTs contribute significantly to intercellular α‐synuclein fibril transfer and evidenced a specific role of lysosomes in this process. This represents a major breakthrough in understanding the mechanisms underlying the progression of synucleinopathies. Furthermore, our work has revealed a novel role of lysosomes for intercellular spreading of α‐synuclein aggregates and calls for a re‐evaluation of lysosome function in neurodegenerative diseases. Similar to α‐synuclein fibrils, huntingtin (Costanzo et al, 2013), PrPSc (Gousset & Zurzolo, 2009; Gousset et al, 2009; Zhu et al, 2015) and TDP‐43 (Ding et al, 2015) aggregates were shown to induce TNT formation and to propagate from cell to cell through TNTs. Our compelling findings together with previous reports allow us to propose a general role for TNTs in the propagation of prion‐like proteins in neurodegenerative diseases (Gousset et al, 2009; Wang et al, 2011; Costanzo et al, 2013; Ding et al, 2015). The discovery of specific TNT markers is paramount to investigate the involvement of TNT‐mediated transfer in vivo. Such studies could open new avenues for the discovery of therapeutic targets and the development of innovative drugs to prevent the progression of neurodegenerative diseases.
Materials and Methods
Cell lines, reagents, plasmids and transfection
Mouse neuron‐like CAD cells were a gift from Hubert Laude (Institut National de la Recherche Agronomique, Jouy‐en‐Josas, France), and they were cultured in Opti‐MEM (Invitrogen) and 10% foetal bovine serum (FBS). Transient transfections were performed with Lipofectamine 2000® (Invitrogen) in accordance with the manufacturer's instructions. The plasmids used were GFP vector (EGFP‐C1), GFP‐dynamin‐1 K44A that was a gift from Mark A. McNiven (Mayo Clinic, Rochester, USA), GFP‐myosin‐10 that was a gift from Richard E. Cheney (University of North Carolina, Chapel Hill, USA) and ChFP‐α‐synuclein as previously described (Bousset et al, 2013). Transfected cells were selected and maintained in the same culture medium as untransfected CAD cells containing 500 μg/ml of G 418 disulfate salt (Sigma Aldrich) during at least 3 weeks, before fluorescent cell sorting according to their ChFP expression levels, using FACSAria III (BD Biosciences), with an excitation laser at 561 nm and speed of sorting ranging from 3,000 to 4,000 events per second.
Preparation of α‐synuclein fibrils
The expression and purification of human wild‐type α‐synuclein was performed as previously described (Ghee et al, 2005) and detailed in the Appendix.
Flow cytometry measurement of time course of internalization
CAD cells were plated in 24‐well plates at a density that would allow sub‐confluency to be reached after 10 h. Then, cells were treated with 1 μM of ATTO‐550 fluorescent‐tagged human recombinant α‐synuclein fibrils. Fibrils were sonicated prior to internalization for 5 min at 80% amplitude with a pulse cycle of 5 s on and 2 s off. Internalization was followed for time points of 5, 15 min, 1, 3, 6 and 16 h. To remove plasma membrane‐bound assemblies, cells were washed three times with 0.1% trypsin (Gibco) and were detached by pipetting and then passed through sterile 40‐μm nylon cell strainers (BD FalconTM) in order to obtain single‐cell suspensions. Cells were fixed using 4% PFA. The percentage of ATTO‐550‐positive cells at each time point was scored using BD LSRFortessa Cell Analyzer (BD Biosciences).
Co‐culture system in neuron‐like CAD cells
Acceptor cells were plated in T25 flasks and transiently transfected the day after with GFP vector or GFP‐dynamin‐1 K44A. The same day of transfection, donor cells were plated in 35‐mm dishes at a density that would allow sub‐confluency to be reached after 10 h. The donor cells were then treated with sonicated α‐synuclein fibrils as described above for 16 h. The day after, donor cells were detached and mixed with acceptor cells at the ratio of 1:1 and plated on μ‐Dish35 mm, high Ibidi (Biovalley, France) at a confluency that allows TNT formation (sub‐confluent cells) or impairs TNT formation (sparse cells). After 24‐h incubation, cells were briefly washed with PBS, fixed with PFA 4%, stained with DAPI (1/10,000) and mounted with Aqua‐Poly/Mount (Polysciences, Inc.). Images were acquired on an LSM 700 confocal microscope (Zeiss) with a 40× objective by taking stacks covering the whole cellular volume. The number of acceptor cells containing α‐synuclein fibrils (referred as percentage of transfer) and the number and the volume (referred as size) of fibrils per acceptor cells were assessed using a script developed by Fabrice de Chaumont for use in the ICY software. This script allows the automated detection and quantification of number and size of fibrils within donor and acceptor cells (described in image analysis).
Filter and CM controls
In order to co‐culture donor and acceptor cells in conditions that allow their physical separation, GFP‐transfected acceptor cells were plated on poly‐D‐lysine‐coated coverslips at the bottom of 24‐well plates. An equal number of donor cells containing sonicated α‐synuclein fibrils were plated in 6.5‐mm transwell filters with 0.4‐μm pore polyester membrane insert (Sigma Aldrich) which were then placed within the 24‐well plates. The cells therefore shared only the culture medium but were unable to physically contact each other. After 24‐h co‐culture, the filter was removed and the acceptor cells on the coverslip were fixed, stained and imaged as described above. For the conditioned medium control, donor cells containing sonicated α‐synuclein fibrils and GFP‐transfected acceptor cells were plated separately on μ‐Dish35 mm, high Ibidi for 24 h. The next day, the medium of acceptor cells was removed and replaced by the complete untransformed 24‐h conditioned medium of donor cells (i.e. not diluted, concentrated or centrifuged). After 24 h, cells were fixed, stained and imaged and pictures were analysed as described above.
LysoTracker‐positive vesicle transfer
To investigate whether α‐synuclein transfer from donor to acceptor cells inside lysosomal vesicles derived exclusively from donor cells, donor cells containing sonicated α‐synuclein fibrils and previously trypsin‐washed were incubated with LysoTracker Deep Red (Life Technologies) for 30 min at 1:100 dilution. After extensive washes with PBS, donor cells were cultured with GFP‐transfected acceptor cells at 1:1 ratio. After 24‐h co‐culture, cells were fixed, stained and imaged as described above. After detection of α‐synuclein fibrils and LysoTracker‐positive vesicles in both the donor and acceptor cells, the percentage of co‐localization between α‐synuclein fibrils and LysoTracker‐positive vesicles was quantified in both cell populations using a co‐localization script developed by Fabrice de Chaumont (described in the Appendix).
Exogenous α‐synuclein fibril internalization in co‐cultured cells
To get insight into the mechanism of α‐synuclein internalization and transfer, donor cells containing sonicated α‐synuclein fibrils ATTO‐550 were co‐cultured with untransfected acceptor cells as described above with the exception that after 12 h of co‐culture plating, 0.3 μM of sonicated α‐synuclein fibrils Alexa‐488 was added in the co‐culture for an additional 12 h. After a total of 24‐h co‐culture, cells were trypsin‐washed, fixed, stained and imaged. After detection of ATTO‐550 and Alexa‐488 α‐synuclein fibrils in the donor and acceptor cells, the percentage of co‐localization of α‐synuclein fibrils Alexa‐488 with ATTO‐550 α‐synuclein fibrils was quantified in both cell populations using a co‐localization script developed by Fabrice de Chaumont (described in the Appendix).
Co‐culture with CAD cells overexpressing soluble α‐synuclein
Donor cells were loaded with 1 μM of sonicated Alexa‐488 α‐synuclein fibrils for 16 h as described above and then co‐cultured sub‐confluently with acceptor ChFP‐α‐synuclein cells for 72 h. A simultaneous control was performed, wherein ChFP‐α‐synuclein cells were cultured separately for 72 h to determine whether spontaneous aggregation of the ChFP‐α‐synuclein occurred in this time frame. Cells were then fixed, stained and imaged as described above. Automated detection and quantification of the number of ChFP‐α‐synuclein puncta was assessed by using the ICY script. After detection of transferred Alexa‐488 α‐synuclein fibrils in the acceptor cells, the percentage of co‐localization of transferred α‐synuclein fibrils and ChFP‐α‐synuclein puncta was quantified using the co‐localization script previously mentioned.
TNTs imaging
To image TNTs within the donor cell population, cells were treated with 1 μM of ATTO‐550 sonicated α‐synuclein fibrils for 16 h. Then, cells were several times gently washed with PBS. To preserve TNTs, cells were first fixed with fixative solution 1 for 20 min (2% PFA, 0.05% glutaraldehyde and 0.2 M HEPES in PBS) and then with fixative solution 2 for another 20 min (4% PFA and 0.2 M HEPES in PBS). Cells were then washed with PBS and incubated for 20 min with WGA Alexa‐488 (Life Technologies) and mounted. Cells were imaged using LSM700 confocal microscope and serial Z‐stacks of 0.25 nm were acquired to image the whole cell volume. Three‐dimensional (3D) reconstruction was performed using the ICY software.
To image TNTs between donor and acceptor cells, cells were co‐cultured and then fixed as described above. In addition, cells were also stained with WGA‐350 (Life Technologies) for 30 min. Epifluorescence microscope was used to image the whole cell volume using Z‐stacks of 0.25 nm distance (Zeiss Axiovert 200M controlled by Axiovision software). Deconvolution and 3D reconstruction were obtained by using the Huygens Professional software and Huygens Essential software, respectively.
TNT quantification experiments
To determine whether internalized α‐synuclein fibrils affected TNT number, CAD cells were plated in culture inserts in μ‐Dish35 mm, high Ibidi (Biovalley, France). After 10 h, sub‐confluent cells were treated with 1 μM of ATTO‐550‐labelled sonicated α‐synuclein fibrils. After 16 h, cells were fixed, stained with WGA Alexa‐488 and mounted as described above. After imaging using fluorescence microscope as described above, the TNT structures connecting remote cells and not touching the substratum were manually counted for both α‐synuclein fibril‐loaded cells and the unloaded control cells. TNT quantification was also performed in cells untransfected and GFP‐myosin‐10‐transfected cells. Both cell populations were separately loaded with α‐synuclein fibrils for 16 h and then plated in μ‐Dish35 mm, high Ibidi (Biovalley, France) for an additional 16 h. Cells were fixed, stained with WGA Alexa‐488 and mounted. TNT quantification was performed as described above.
After 24‐h co‐culture (see co‐culture system described above), cells were fixed, stained with WGA Alexa‐633 and mounted as described above. Images were similarly acquired and the percentage of TNT‐connecting donor and acceptor cells was quantified in sub‐confluent and sparse conditions.
Statistical analysis
The statistical relevance of the bar graphs was obtained by calculating the P‐value using the paired two‐tailed Student's t‐test. The bar graphs showed in the figures are presented as mean ± s.e.m. The statistical relevance of the box‐and‐whisker plots was calculated with the Mann–Whitney U‐test. All column graphs, plots and statistical analyses were done using GraphPad Prism version 5 software.
Author contributions
CZ conceived the project and discussed the planning and execution of the experiments. SA planned and performed the majority of the experiments. FL prepared and performed all experiments in primary neurons. SZ established stable CAD cell lines and performed some experiments and quantitations. LP performed trap assay. LB generated α‐synuclein fibrils, established stable CAD cell lines and performed quantitative assessments for trap assay. FC devised the script for spot detection and co‐localization of the ICY software. JCOM and RM discussed the project with CZ and directed the research of FC and LB. SA, RM and CZ wrote the paper. All authors contributed to revising the manuscript.
Conflict of interest
The authors declare that they have no conflict of interest.
Supporting information
Appendix
Expanded View Figures PDF
Review Process File
Acknowledgements
The authors thank all laboratory members for discussion and IMAGIF facility for access to Electron Microscopes. SA is supported by PhD fellowships from the Ministère de l'Education Nationale (France) and from the Fondation pour la Recherche Médicale (FRM) (FDT20140931208). FL is the recipient of a Marie Skłodowska‐Curie Fellowship, and SZ is supported by a PhD fellowship from the China Scholarship Council (CSC). This work is supported by research grants from the MI CARNOT ICSA/PMI, Equipe FRM (Fondation pour la Recherche Médicale) 2014 (DEQ20140329557) and Agence Nationale de la Recherche (ANR‐14‐JPCD‐0002‐01) to CZ; and by the Agence Nationale de la Recherche (ANR‐14‐JPCD‐0002‐01), the Fondation de France (contract 2015‐00060936), the Centre National de la Recherche Scientifique and a “Coup d'Elan à la Recherche Française” award from Fondation Bettencourt‐Schueller to RM.
The EMBO Journal (2016) 35: 2120–2138
References
- Abounit S, Zurzolo C (2012) Wiring through tunneling nanotubes–from electrical signals to organelle transfer. J Cell Sci 125: 1089–1098 [DOI] [PubMed] [Google Scholar]
- Ady JW, Desir S, Thayanithy V, Vogel RI, Moreira AL, Downey RJ, Fong Y, Manova‐Todorova K, Moore MAS, Lou E (2014) Intercellular communication in malignant pleural mesothelioma: properties of tunneling nanotubes. Front Physiol 5: 400 [DOI] [PMC free article] [PubMed] [Google Scholar]
- Alvarez‐Erviti L, Seow Y, Schapira AH, Gardiner C, Sargent IL, Wood MJA, Cooper JM (2011) Lysosomal dysfunction increases exosome‐mediated alpha‐synuclein release and transmission. Neurobiol Dis 42: 360–367 [DOI] [PMC free article] [PubMed] [Google Scholar]
- Angot E, Steiner JA, Lema Tomé CM, Ekström P, Mattsson B, Björklund A, Brundin P (2012) Alpha‐synuclein cell‐to‐cell transfer and seeding in grafted dopaminergic neurons in vivo . PLoS ONE 7: e39465 [DOI] [PMC free article] [PubMed] [Google Scholar]
- Aulić S, Le TTN, Moda F, Abounit S, Corvaglia S, Casalis L, Gustincich S, Zurzolo C, Tagliavini F, Legname G (2014) Defined α‐synuclein prion‐like molecular assemblies spreading in cell culture. BMC Neurosci 15: 69 [DOI] [PMC free article] [PubMed] [Google Scholar]
- Austefjord MW, Gerdes HH, Wang X (2014) Tunneling nanotubes: diversity in morphology and structure. Commun Integr Biol 7: e27934 [DOI] [PMC free article] [PubMed] [Google Scholar]
- Bae E‐J, Yang N‐Y, Song M, Lee CS, Lee JS, Jung BC, Lee H‐J, Kim S, Masliah E, Sardi SP, Lee S‐J (2014) Glucocerebrosidase depletion enhances cell‐to‐cell transmission of α‐synuclein. Nat Commun 5: 4755 [DOI] [PMC free article] [PubMed] [Google Scholar]
- Bendor J, Logan T, Edwards R (2013) The function of α‐synuclein. Neuron 79: 1044–1066 [DOI] [PMC free article] [PubMed] [Google Scholar]
- Bourdenx M, Bezard E, Dehay B (2014) Lysosomes and α‐synuclein form a dangerous duet leading to neuronal cell death. Front Neuroanat 8: 83 [DOI] [PMC free article] [PubMed] [Google Scholar]
- Bousset L, Pieri L, Ruiz‐Arlandis G, Gath J, Jensen PH, Habenstein B, Madiona K, Olieric V, Böckmann A, Meier BH, Melki R (2013) Structural and functional characterization of two alpha‐synuclein strains. Nat Commun 4: 2575 [DOI] [PMC free article] [PubMed] [Google Scholar]
- Braak H, Del Tredici K, Rüb U, de Vos RA, Jansen Steur EN, Braak E (2003b) Staging of brain pathology related to sporadic Parkinson's disease. Neurobiol Aging 24: 197–211 [DOI] [PubMed] [Google Scholar]
- Braak H, Rüb U, Gai WP, Del Tredici K (2003a) Idiopathic Parkinson's disease: possible routes by which vulnerable neuronal types may be subject to neuroinvasion by an unknown pathogen. J Neural Transm 110: 517–536 [DOI] [PubMed] [Google Scholar]
- Brahic M, Bousset L, Bieri G, Melki R, Gitler AD (2016) Axonal transport and secretion of fibrillar forms of α‐synuclein, Aβ42 peptide and HTTExon 1. Acta Neuropathol 131: 539–548 [DOI] [PMC free article] [PubMed] [Google Scholar]
- Burré J, Vivona S, Diao J, Sharma M, Brunger AT, Südhof TC (2013) Properties of native brain α‐synuclein. Nature 498: E4–E6 [DOI] [PMC free article] [PubMed] [Google Scholar]
- Chinnery HR, Pearlman E, McMenamin PG (2008) Cutting edge: membrane nanotubes in vivo: a feature of MHC class II+ cells in the mouse cornea. J Immunol 180: 5779–5783 [DOI] [PMC free article] [PubMed] [Google Scholar]
- Chu Y, Dodiya H, Aebischer P, Olanow CW, Kordower JH (2009) Alterations in lysosomal and proteasomal markers in Parkinson's disease: relationship to alpha‐synuclein inclusions. Neurobiol Dis 35: 385–398 [DOI] [PubMed] [Google Scholar]
- Costanzo M, Abounit S, Marzo L, Danckaert A, Chamoun Z, Roux P, Zurzolo C (2013) Transfer of polyglutamine aggregates in neuronal cells occurs in tunneling nanotubes. J Cell Sci 126: 3678–3685 [DOI] [PubMed] [Google Scholar]
- Cuervo AM, Stefanis L, Fredenburg R, Lansbury PT, Sulzer D (2004) Impaired degradation of mutant alpha‐synuclein by chaperone‐mediated autophagy. Science 305: 1292–1295 [DOI] [PubMed] [Google Scholar]
- Danzer KM, Ruf WP, Putcha P, Joyner D, Hashimoto T, Glabe C, Hyman BT, McLean PJ (2011) Heat‐shock protein 70 modulates toxic extracellular α‐synuclein oligomers and rescues trans‐synaptic toxicity. FASEB J 25: 326–336 [DOI] [PMC free article] [PubMed] [Google Scholar]
- Dehay B, Bové J, Rodríguez‐Muela N, Perier C, Recasens A, Boya P, Vila M (2010) Pathogenic lysosomal depletion in Parkinson's disease. J Neurosci 30: 12535–12544 [DOI] [PMC free article] [PubMed] [Google Scholar]
- Desplats P, Lee H‐J, Bae E‐J, Patrick C, Rockenstein E, Crews L, Spencer B, Masliah E, Lee S‐J (2009) Inclusion formation and neuronal cell death through neuron‐to‐neuron transmission of alpha‐synuclein. Proc Natl Acad Sci USA 106: 13010–13015 [DOI] [PMC free article] [PubMed] [Google Scholar]
- Ding X, Ma M, Teng J, Teng RKF, Zhou S, Yin J, Fonkem E, Huang JH, Wu E, Wang X (2015) Exposure to ALS‐FTD‐CSF generates TDP‐43 aggregates in glioblastoma cells through exosomes and TNTs‐like structure. Oncotarget 6: 24178–24191 [DOI] [PMC free article] [PubMed] [Google Scholar]
- Freeman D, Cedillos R, Choyke S, Lukic Z, McGuire K, Marvin S, Burrage AM, Sudholt S, Rana A, O'Connor C, Wiethoff CM, Campbell EM (2013) Alpha‐synuclein induces lysosomal rupture and cathepsin dependent reactive oxygen species following endocytosis. PLoS ONE 8: e62143 [DOI] [PMC free article] [PubMed] [Google Scholar]
- Freundt EC, Maynard N, Clancy EK, Roy S, Bousset L, Sourigues Y, Covert M, Melki R, Kirkegaard K, Brahic M (2012) Neuron‐to‐neuron transmission of α‐synuclein fibrils through axonal transport. Ann Neurol 72: 517–524 [DOI] [PMC free article] [PubMed] [Google Scholar]
- Ghee M, Melki R, Michot N, Mallet J (2005) PA700, the regulatory complex of the 26S proteasome, interferes with alpha‐synuclein assembly. FEBS J 272: 4023–4033 [DOI] [PubMed] [Google Scholar]
- Gousset K, Zurzolo C (2009) Tunnelling nanotubes: a highway for prion spreading? Prion 3: 94–98 [DOI] [PMC free article] [PubMed] [Google Scholar]
- Gousset K, Schiff E, Langevin C, Marijanovic Z, Caputo A, Browman DT, Chenouard N, de Chaumont F, Martino A, Enninga J, Olivo‐Marin J‐C, Männel D, Zurzolo C (2009) Prions hijack tunnelling nanotubes for intercellular spread. Nat Cell Biol 11: 328–336 [DOI] [PubMed] [Google Scholar]
- Gousset K, Marzo L, Commere P‐H, Zurzolo C (2013) Myo10 is a key regulator of TNT formation in neuronal cells. J Cell Sci 126: 4424–4435 [DOI] [PubMed] [Google Scholar]
- Hansen C, Angot E, Bergström A‐L, Steiner JA, Pieri L, Paul G, Outeiro TF, Melki R, Kallunki P, Fog K, Li J‐Y, Brundin P (2011) α‐Synuclein propagates from mouse brain to grafted dopaminergic neurons and seeds aggregation in cultured human cells. J Clin Invest 121: 715–725 [DOI] [PMC free article] [PubMed] [Google Scholar]
- Hasegawa T, Konno M, Baba T, Sugeno N, Kikuchi A, Kobayashi M, Miura E, Tanaka N, Tamai K, Furukawa K, Arai H, Mori F, Wakabayashi K, Aoki M, Itoyama Y, Takeda A (2011) The AAA‐ATPase VPS4 regulates extracellular secretion and lysosomal targeting of α‐synuclein. PLoS ONE 6: e29460 [DOI] [PMC free article] [PubMed] [Google Scholar]
- Holmqvist S, Chutna O, Bousset L, Aldrin‐Kirk P, Li W, Björklund T, Wang ZY, Roybon L, Melki R, Li JY (2014) Direct evidence of Parkinson pathology spread from the gastrointestinal tract to the brain in rats. Acta Neuropathol 128: 805–820 [DOI] [PubMed] [Google Scholar]
- Kondo K, Obitsu S, Teshima R (2011) α‐Synuclein aggregation and transmission are enhanced by leucine‐rich repeat kinase 2 in human neuroblastoma SH‐SY5Y cells. Biol Pharm Bull 34: 1078–1083 [DOI] [PubMed] [Google Scholar]
- Konno M, Hasegawa T, Baba T, Miura E, Sugeno N, Kikuchi A, Fiesel FC, Sasaki T, Aoki M, Itoyama Y, Takeda A (2012) Suppression of dynamin GTPase decreases α‐synuclein uptake by neuronal and oligodendroglial cells: a potent therapeutic target for synucleinopathy. Mol Neurodegener 7: 38 [DOI] [PMC free article] [PubMed] [Google Scholar]
- Kordower JH, Chu Y, Hauser RA, Freeman TB, Olanow CW (2008) Lewy body‐like pathology in long‐term embryonic nigral transplants in Parkinson's disease. Nat Med 14: 504–506 [DOI] [PubMed] [Google Scholar]
- Kordower JH, Dodiya HB, Kordower AM, Terpstra B, Paumier K, Madhavan L, Sortwell C, Steece‐Collier K, Collier TJ (2011) Transfer of host‐derived α synuclein to grafted dopaminergic neurons in rat. Neurobiol Dis 43: 552–557 [DOI] [PMC free article] [PubMed] [Google Scholar]
- Lee HJ, Suk JE, Bae EJ, Lee JH, Paik SR, Lee SJ (2008) Assembly‐dependent endocytosis and clearance of extracellular α‐synuclein. Int J Biochem Cell Biol 40: 1835–1849 [DOI] [PubMed] [Google Scholar]
- Lee HJ, Suk JE, Patrick C, Bae EJ, Cho JH, Rho S, Hwang D, Masliah E, Lee SJ (2010) Direct transfer of Alpha ‐synuclein from neuron to astroglia causes inflammatory responses in synucleinopathies. J Biol Chem 285: 9262–9272 [DOI] [PMC free article] [PubMed] [Google Scholar]
- Lee H‐J, Cho E‐D, Lee KW, Kim J‐H, Cho S‐G, Lee S‐J (2013) Autophagic failure promotes the exocytosis and intercellular transfer of α‐synuclein. Exp Mol Med 45: e22 [DOI] [PMC free article] [PubMed] [Google Scholar]
- Li J‐Y, Englund E, Holton JL, Soulet D, Hagell P, Lees AJ, Lashley T, Quinn NP, Rehncrona S, Björklund A, Widner H, Revesz T, Lindvall O, Brundin P (2008) Lewy bodies in grafted neurons in subjects with Parkinson's disease suggest host‐to‐graft disease propagation. Nat Med 14: 501–503 [DOI] [PubMed] [Google Scholar]
- Liu J, Zhang J‐P, Shi M, Quinn T, Bradner J, Beyer R, Chen S, Zhang J (2009) Rab11a and HSP90 regulate recycling of extracellular alpha‐synuclein. J Neurosci 29: 1480–1485 [DOI] [PMC free article] [PubMed] [Google Scholar]
- Lou E, Fujisawa S, Morozov A, Barlas A, Romin Y, Dogan Y, Gholami S, Moreira AL, Manova‐Todorova K, Moore MAS (2012) Tunneling nanotubes provide a unique conduit for intercellular transfer of cellular contents in human malignant pleural mesothelioma. PLoS ONE 7: e33093 [DOI] [PMC free article] [PubMed] [Google Scholar]
- Luk KC, Kehm V, Carroll J, Zhang B, O'Brien P, Trojanowski JQ, Lee VM‐Y (2012b) Pathological α‐synuclein transmission initiates Parkinson‐like neurodegeneration in nontransgenic mice. Science 338: 949–953 [DOI] [PMC free article] [PubMed] [Google Scholar]
- Luk KC, Kehm VM, Zhang B, O'Brien P, Trojanowski JQ, Lee VMY (2012a) Intracerebral inoculation of pathological α‐synuclein initiates a rapidly progressive neurodegenerative α‐synucleinopathy in mice. J Exp Med 209: 975–986 [DOI] [PMC free article] [PubMed] [Google Scholar]
- Mak SK, McCormack AL, Manning‐Bog AB, Cuervo AM, Di Monte DA (2010) Lysosomal degradation of alpha‐synuclein in vivo . J Biol Chem 285: 13621–13629 [DOI] [PMC free article] [PubMed] [Google Scholar]
- Marzo L, Gousset K, Zurzolo C (2012) Multifaceted roles of tunneling nanotubes in intercellular communication. Front Physiol 3: 1–14 [DOI] [PMC free article] [PubMed] [Google Scholar]
- Masuda‐Suzukake M, Nonaka T, Hosokawa M, Oikawa T, Arai T, Akiyama H, Mann DMA, Hasegawa M (2013) Prion‐like spreading of pathological α‐synuclein in brain. Brain 136: 1128–1138 [DOI] [PMC free article] [PubMed] [Google Scholar]
- Masuda‐Suzukake M, Nonaka T, Hosokawa M, Kubo M, Shimozawa A, Akiyama H, Hasegawa M (2014) Pathological alpha‐synuclein propagates through neural networks. Acta Neuropathol Commun 2: 88 [DOI] [PMC free article] [PubMed] [Google Scholar]
- McCann H, Stevens CH, Cartwright H, Halliday GM (2014) α‐Synucleinopathy phenotypes. Park Relat Disord 20: S62–S67 [DOI] [PubMed] [Google Scholar]
- Mougenot AL, Nicot S, Bencsik A, Morignat E, Verchère J, Lakhdar L, Legastelois S, Baron T (2012) Prion‐like acceleration of a synucleinopathy in a transgenic mouse model. Neurobiol Aging 33: 2225–2228 [DOI] [PubMed] [Google Scholar]
- Naphade S, Sharma J, Gaide Chevronnay HP, Shook MA, Yeagy BA, Rocca CJ, Ur SN, Lau AJ, Courtoy PJ, Cherqui S (2015) Brief reports: lysosomal cross‐correction by hematopoietic stem cell‐derived macrophages via tunneling nanotubes. Stem Cells 33: 301–309 [DOI] [PMC free article] [PubMed] [Google Scholar]
- Nixon RA (2013) The role of autophagy in neurodegenerative disease. Nat Med 19: 983–997 [DOI] [PubMed] [Google Scholar]
- Onfelt B, Nedvetzki S, Yanagi K, Davis DM (2004) Cutting edge: membrane nanotubes connect immune cells. J Immunol 173: 1511–1513 [DOI] [PubMed] [Google Scholar]
- Osswald M, Jung E, Sahm F, Solecki G, Venkataramani V, Blaes J, Weil S, Horstman H, Wiestler B, Syed M, Huang L, Ratliff M, Karimian Jazi K, Kurz FT, Schmenger T, Lemke D, Gömmel M, Pauli M, Liao Y, Häring P et al (2015) Brain tumour cells interconnect to a functional and resistant network. Nature 528: 93–98 [DOI] [PubMed] [Google Scholar]
- Pasquier J, Galas L, Boulangé‐Lecomte C, Rioult D, Bultelle F, Magal P, Webb G, Le Foll F (2012) Different modalities of intercellular membrane exchanges mediate cell‐to‐cell P‐glycoprotein transfers in MCF‐7 breast cancer cells. J Biol Chem 287: 7374–7387 [DOI] [PMC free article] [PubMed] [Google Scholar]
- Peelaerts W, Bousset L, Van der Perren A, Moskalyuk A, Pulizzi R, Giugliano M, Van den Haute C, Melki R, Baekelandt V (2015) α‐Synuclein strains cause distinct synucleinopathies after local and systemic administration. Nature 522: 340–344 [DOI] [PubMed] [Google Scholar]
- Pieri L, Madiona K, Bousset L, Melki R (2012) Fibrillar α ‐synuclein and huntingtin exon 1 assemblies are toxic to the cells. Biophys J 102: 2894–2905 [DOI] [PMC free article] [PubMed] [Google Scholar]
- Recasens A, Dehay B, Bové J, Carballo‐Carbajal I, Dovero S, Pérez‐Villalba A, Fernagut PO, Blesa J, Parent A, Perier C, Fariñas I, Obeso JA, Bezard E, Vila M (2014) Lewy body extracts from Parkinson disease brains trigger α‐synuclein pathology and neurodegeneration in mice and monkeys. Ann Neurol 75: 351–362 [DOI] [PubMed] [Google Scholar]
- Rey NL, Petit GH, Bousset L, Melki R, Brundin P (2013) Transfer of human alpha‐synuclein from the olfactory bulb to interconnected brain regions in mice. Acta Neuropathol 126: 555–573 [DOI] [PMC free article] [PubMed] [Google Scholar]
- Reyes JF, Rey NL, Bousset L, Melki R, Brundin P, Angot E (2014) Alpha‐synuclein transfers from neurons to oligodendrocytes. Glia 62: 387–398 [DOI] [PubMed] [Google Scholar]
- Rustom A, Saffrich R, Markovic I, Walther P, Gerdes H‐H (2004) Nanotubular highways for intercellular organelle transport. Science 303: 1007–1010 [DOI] [PubMed] [Google Scholar]
- Seyed‐Razavi Y, Hickey MJ, Kuffova L, McMenamin PG, Chinnery HR (2013) Membrane nanotubes in myeloid cells in the adult mouse cornea represent a novel mode of immune cell interaction. Immunol Cell Biol 91: 89–95 [DOI] [PubMed] [Google Scholar]
- Sowinski S, Jolly C, Berninghausen O, Purbhoo MA, Chauveau A, Köhler K, Oddos S, Eissmann P, Brodsky FM, Hopkins C, Onfelt B, Sattentau Q, Davis DM (2008) Membrane nanotubes physically connect T cells over long distances presenting a novel route for HIV‐1 transmission. Nat Cell Biol 10: 211–219 [DOI] [PubMed] [Google Scholar]
- Spencer B, Potkar R, Trejo M, Rockenstein E, Patrick C, Gindi R, Adame A, Wyss‐Coray T, Masliah E (2009) Beclin 1 gene transfer activates autophagy and ameliorates the neurodegenerative pathology in alpha‐synuclein models of Parkinson's and Lewy body diseases. J Neurosci 29: 13578–13588 [DOI] [PMC free article] [PubMed] [Google Scholar]
- Sung JY, Kim J, Paik SR, Park JH, Ahn YS, Chung KC (2001) Induction of neuronal cell death by Rab5A‐dependent endocytosis of alpha‐synuclein. J Biol Chem 276: 27441–27448 [DOI] [PubMed] [Google Scholar]
- Tanik SA, Schultheiss CE, Volpicelli‐Daley LA, Brunden KR, Lee VMY (2013) Lewy body‐like alpha‐synuclein aggregates resist degradation and impair macroautophagy. J Biol Chem 288: 15194–15210 [DOI] [PMC free article] [PubMed] [Google Scholar]
- Tokuda T, Salem SA, Allsop D, Mizuno T, Nakagawa M, Qureshi MM, Locascio JJ, Schlossmacher MG, El‐Agnaf OMA (2006) Decreased alpha‐synuclein in cerebrospinal fluid of aged individuals and subjects with Parkinson's disease. Biochem Biophys Res Commun 349: 162–166 [DOI] [PubMed] [Google Scholar]
- Volpicelli‐Daley LA, Luk KC, Lee VM (2014) Addition of exogenous α‐synuclein preformed fibrils to primary neuronal cultures to seed recruitment of endogenous α‐synuclein to Lewy body and Lewy neurite‐like aggregates. Nat Protoc 9: 2135–2146 [DOI] [PMC free article] [PubMed] [Google Scholar]
- Wang Y, Cui J, Sun X, Zhang Y (2011) Tunneling‐nanotube development in astrocytes depends on p53 activation. Cell Death Differ 18: 732–742 [DOI] [PMC free article] [PubMed] [Google Scholar]
- Yasuda K, Khandare A, Burianovskyy L, Maruyama S, Zhang F, Nasjletti A, Goligorsky MS (2011) Tunneling nanotubes mediate rescue of prematurely senescent endothelial cells by endothelial progenitors: exchange of lysosomal pool. Aging 3: 597–608 [DOI] [PMC free article] [PubMed] [Google Scholar]
- Zhang L, Sheng R, Qin Z (2009) The lysosome and neurodegenerative diseases structure and function of lysosomes. Acta Biochim Biophys Sin 41: 437–445 [DOI] [PubMed] [Google Scholar]
- Zhu S, Victoria GS, Marzo L, Ghosh R, Zurzolo C (2015) Prion aggregates transfer through tunneling nanotubes in endocytic vesicles. Prion 9: 125–135 [DOI] [PMC free article] [PubMed] [Google Scholar]
Associated Data
This section collects any data citations, data availability statements, or supplementary materials included in this article.
Supplementary Materials
Appendix
Expanded View Figures PDF
Review Process File