

Abstract
A basic tenet of empirical research on cigarette smoking behavior is the systematic assessment of patterns of use. However, the large majority of extant research relies on smokers’ retrospective reports of their average number of cigarettes per day (CPD), a measure that may be variable in terms of reliability and validity. Using data from three previously published studies of non-treatment seeking daily smokers (combined N=89), this analysis examined the reliability of self-reported CPD, the consistency of returned cigarette butts each day over four consecutive 24-hour periods, the validity of self-reported CPD as compared to returned cigarette butts, and the relationship of CPD and returned cigarette butts to toxicant exposure. Results showed that self-reported CPD was reliable across telephone and in-person screening interviews (r = 0.87; p <.01). While average self-reported CPD and returned cigarette butt counts did not differ significantly [t(87) = −1.5 to 0.3; all n.s.], butt counts revealed a wider range of variability in daily smoking behavior. In addition, self-reported cigarette use exhibited substantial digit bias (Whipple’s Index = 413.8), meaning that participants tended to round their estimates to values ending in zero or five. Cigarette butt counts, but not self-reported CPD, were associated significantly with exposure to smoke toxicants. However, this former relationship was revealed to be linear, but not curvilinear, in nature. These findings have implications for both research and treatment efforts, as researchers often rely on accurate assessment of CPD to predict a variety of smoking-related outcomes.
Keywords: Tobacco, cigarettes per day, retrospective reports, reliability, validity, toxicants
A basic tenet of empirical research on tobacco smoking behavior is the accurate and reliable assessment of cigarette use patterns. The large majority of extant research relies on smokers’ retrospective reports of their average number of cigarettes per day (CPD). This measure is often used to assign individuals to specific treatment conditions (Mooney et al., 2005), to predict smoking cessation outcomes (Borland, Yong, O’Connor, Hyland, & Thompson, 2010), as a criterion for study inclusion (Breland, Bucchalter, Evans, & Eissenberg, 2002), and also as correlate of exposure to smoke toxicants (Khariwala et al., 2014). However, global self-report measures of CPD may suffer from errors in reliability and validity (Klesges, Debon, & Ray, 1995; Lewis-Esquerre et al., 2005). Smokers may over-exaggerate or under-report their average CPD due to stigmas or social influences (Harrison, 1997), or they may engage in a phenomenon known as heaping or digit bias, whereby responses cluster around values rounded to those ending in zero or five (Klesges et al., 1995; Pardeshi, 2010). For instance, among a sample of adult smokers in the United States (U.S.) asked to report their average number of CPD, over 70% provided a number divisible by 10 (Klesges et al., 1995). Consequently, this measure of smoking behavior may not accurately represent patterns of cigarette use.
Indeed, self-reported number of CPD has been observed to over- or under-estimate smokers’ exposure to carbon monoxide (CO), cotinine (metabolite of nicotine), and 4-(methylnitrosamino)-1-(3-pyridyl)-1-butanol (NNAL; tobacco-specific nitrosamine metabolite) (Joseph et al., 2005). These objective measures are more likely than self-report measures to reveal a normally distributed pattern of smoking (Klesges et al., 1995). A more accurate measure of smoking behavior, therefore, might involve the use of prospective data collection methods, such as ecological momentary assessment (EMA) which allows smokers to record their cigarette use in real-time and in their natural environment. For instance, smokers may be asked to record each cigarette as it is smoked via tally cards (Perkins, Jao, & Karelitz, 2012) or electronic diaries (e.g., mobile or web-based app; Shiffman, 2009). EMA not only prevents recall and digit bias, but also better predicts toxicant exposure (e.g., cotinine), relative to global self-reports of CPD (Perkins et al., 2012; Shiffman, 2009).
Another method of real-time smoking behavior measurement is cigarette butt collection, in which smokers store butts from each cigarette smoked for later return to the laboratory (Blank & Eissenberg, 2010). Smoking behavior as measured by cigarette butt collection has shown to differ significantly from that measured by global self-reports such that smokers overestimate their average number of CPD by approximately 2–3 cigarettes (Clark, Gautam, Hlaing, & Gerson, 1996; Etter & Perneger, 2001). Additionally, cigarette butt collection may be a more reliable measure of smoking behavior than a global self-report item (Clark et al., 1996). Still, none of this work has compared smokers’ returned cigarette butts to biochemical measures of smoke exposure.
The purpose of this study was to compare, across three similarly designed studies, two measures of cigarette use: global, self-reported CPD versus returned cigarette butts during a 5-day period of ad libitum smoking. Both of these measures were compared to smokers’ biochemical samples indicative of tobacco exposure: urinary cotinine and urinary 4-(methylnitrosamino)-1-(3-pyridyl)-1-butanol (NNAL; tobacco-specific nitrosamine metabolite). Using a non-treatment seeking sample of adult smokers, study goals were to assess the: (a) test-retest reliability of smokers’ self-reports of cigarette use, (b) consistency of smokers’ cigarette use across days as measured via returned cigarette butts, (c) validity of smokers’ self-reports of cigarette use relative to their returned cigarette butts, and (d) validity of self-reports and cigarette butts relative to biochemical exposure outcomes. Smokers’ self-reports of their average daily cigarette use were expected to be significantly reliable (as in Lewis-Esquerre et al., 2005; Shiffman, 2009). It was also expected that self-reports (Klesges et al., 1995), but not real-time collection method of returned cigarette butts (e.g., Perkins et al., 2012; Shiffman, 2009), would be affected by digit bias. Finally, cigarette butt counts were expected to be associated significantly with smokers’ exposure to tobacco as measured by biochemical indices.
Method
General Procedures
Data were pooled from three previously published studies (Blank & Eissenberg, 2010; Breland, Acosta & Eissenberg, 2003; Breland, Kleykamp & Eissenberg, 2006) that were approved by the university’s Institutional Review Board. For all three studies, cigarette smokers were recruited via word-of-mouth and community advertisements, and interested individuals contacted the laboratory to complete a telephone screening questionnaire. For smokers whose answers to these initial questions indicated that they would meet inclusion/exclusion criteria, an in-person screening visit was scheduled within one to two weeks. During both interviews, smokers were asked to report their global daily cigarette use.
All three within-subjects studies were designed to compare the effects of novel tobacco products to those of participants’ own brand of cigarettes and also a period of nicotine/tobacco abstinence. Latin-square ordered conditions in each study always included daily visits to the laboratory during five consecutive days (Monday–Friday) of product use or during tobacco/nicotine abstinence. However, only four 24-hour periods were covered during those five days for measurement of product use, and thus measurement periods are described as “Days 2–5” (Tuesday–Friday) for outcomes where appropriate. All condition-assigned products, including own brand of cigarettes, were provided to participants. For the own brand cigarette conditions, participants were required to collect the butts from all cigarettes smoked over a 24-hour period, and to return those butts and any cigarettes not yet smoked at the next visit. Participants were given small containers, labeled by day of the week, to use to store their cigarette butts. At all study visits (Monday–Friday), participants provided breath and urine samples for testing of expired air carbon monoxide (CO) and/or cotinine (both semi-quantitative and quantitative methods) and NNAL (quantitative methods).
Participants
The current analyses are based on a combined sample size of 89 participants across all three studies. This number reflects not only those participants included in the analyses reported in the respective published articles (Blank & Eissenberg, 2010; Breland et al., 2003; 2006), but also additional participants who were excluded from the original studies but completed the own brand cigarette condition. That is, a complete dataset was available for these latter participants for this secondary data analysis. Table 1 displays the sample sizes and participant characteristics for each of the three studies individually. Note that some inclusion/exclusion criteria differed between studies (see Blank & Eissenberg, 2010; Breland et al., 2003; Breland et al., 2006 for details). For the combined sample of 89 smokers, the majority was male (58%) and Caucasian (73%). Participants had an average (±SD) of 13.6±2.1 years of education and were 26.9±10.1 years of age. Smoking characteristics were as follows: telephone screening global CPD = 20.6±4.8, in-person screening global CPD = 20.5±5.0, years smoking = 6.1±5.8, expired air CO level = 24.4±8.1 parts per million (ppm), and number of previous quit attempts = 2.1±1.7. The level of nicotine dependence for Study 1 (Fagerström Tolerance Questionnaire; Fagerström, 1978) was 4.9±0.9, while it was 5.1±2.2 for Studies 2 and 3 combined (Fagerström Test for Nicotine Dependence; Heatherton, Kozlowski, Frecker, & Fagerström, 1991). Additionally, 71% reported smoking “light” or “ultra-light” cigarettes and 77% reporting smoking non-mentholated cigarettes (Note: Studies 1 and 2 excluded smokers of regular/full-flavor or mentholated cigarettes). Smokers in all three studies were excluded if they reported a history of chronic health problems or diagnosed psychiatric disorders, current illicit drug use, pregnancy (verified by urinalysis) or breastfeeding, or current attempts to quit or cut down cigarette use.
Table 1.
Demographic characteristics within each of three experimental studies
| Study 1 | Study 2 | Study 3 | χ2 or F test | |
|---|---|---|---|---|
| Total N | 14 | 41 | 34 | |
|
| ||||
| % Male | 29 | 78 | 47 | <.01 |
| % Caucasian | 86 | 95 | 41 | <.001 |
| Age | 23.4 (7.9) | 22.3 (3.2) | 33.6 (12.4) | <.001 |
| Years education | 14.1 (2.4) | 14.2 (2.0) | 12.6 (1.8) | <.01 |
| Telephone CPD | 19.8 (2.9) | 20.0 (4.5) | 21.6 (5.6) | n.s. |
| In-person CPD | 19.8 (2.6) | 20.6 (5.5) | 20.5 (5.0) | n.s. |
| Years smoking | 5.0 (3.6) | 4.5 (2.9) | 8.4 (8.1) | n.s. |
| Screening expired air CO level (ppm) | 25.2 (8.5) | 23.5 (7.5) | 25.0 (8.7) | n.s. |
| Number of previous quit attempts | 2.0 (1.7) | 2.5 (1.5) | 1.7 (1.9) | n.s. |
| % smoking “light”/“ultra-light” cigarettesa | 100 | 100 | 32 | <.001 |
| % smoking non-mentholated cigarettesa | 100 | 100 | 41 | <.001 |
| FTQb or FTNDc | 4.9 (0.9)b | 4.5 (2.2)c | 5.1 (2.0)c | N/A |
Studies 1 and 2 excluded smokers of full-flavor or mentholated cigarettes
FTQ = Fagerström Tolerance Questionnaire (score range 0–11)
FTND = Fagerström Test for Nicotine Dependence (score range 0–10)
Outcome Measures
Self-reported CPD
Participants reported on their daily cigarette use (“How many cigarettes per day, on average, do you smoke?”) during both a telephone screening interview and an in-person screening interview. Respondents provided verbal answers to an experimenter for the telephone screen and hand-written responses during the in-person screen.
Cigarette butt counts
At each visit on Days 2–5, participants returned butts from cigarettes smoked ad libitum during the previous 24 hours, as well as any cigarettes not yet smoked. The number of used and unused products was compared to the number of cigarettes provided to participants the day prior as a measure of compliance. Participants were removed from the study if the amount of cigarettes returned (used and unused combined) was notably different from the amount provided (i.e., more than 1–2 cigarettes) during the own brand cigarette condition. The total number of cigarette butts returned was recorded for each 24-hour period.
Urinary cotinine
On Days 1 through 5 (Blank & Eissenberg, 2010), or Days 1, 3, and 5 (Breland et al., 2003; Breland et al., 2006), urine samples were collected, stored at −70°C, and then later analyzed for cotinine (limit of quantitation = 1.0 ng/ml; adaptation of method reported in Naidong, Shou, Chen, & Jiang, 2001). Note, however, that only Days 1, 3, and 5 were used for analyses that included this outcome measure (i.e., growth curve modeling) for consistency across studies. That is, Days 2 and 4 from one study (Blank & Eissenberg, 2010) were excluded from those analyses.
Urinary NNAL
On Days 1, 3, and 5, urine samples were also analyzed for total NNAL (i.e., NNAL-T), a metabolite of the tobacco-specific nitrosamine 4-(methylnitrosamino)-1-(3-pyridyl)-1-butanone, or NNK. NNAL-T was analyzed using liquid chromatography–mass spectrometry/mass spectrometry (MDS Pharma Services, Lincoln, NE; method described in Roethig et al., 2007; limit of quantitation = 20 pg/ml).
Data Preparation and Statistical Analyses
Some participants self-reported a range of cigarettes smoked daily (e.g., “between 15 and 20 CPD”) at the telephone screening (n=9), in-person (n=13) screening, or both (n=9), thus precluding use of these data for some analyses described below.
Test-retest reliability of smokers’ self-reports of cigarette use
The Pearson product moment correlation coefficient was used to compare smokers’ reports of their general CPD at the initial telephone screening to that during the in-person screening (~1–2 weeks later). Note that because the two screening interviews generated highly correlated results, only the in-person screening visit reports were used for all other analyses described below.
Consistency of smokers’ cigarette use across days
To evaluate consistency, cigarette butt counts between pairs of consecutive days and across the 5-day period were examined using intra-class correlations (ICC; McGraw & Wong, 1996; Weir, 2005). Confidence intervals (CI; 95%) for these ICC’s of cigarette butt counts were compared to determine whether results differed between studies, as indicated by non-overlapping CI’s. Similarly, 95% CI’s for ICC’s were compared between groups based on gender (male, female) and race (Caucasian, Non-Caucasian) (as in Clark et al., 1996; Perkins et al., 2012).
Difference scores between butt counts for Days 2–5 (e.g., Day 2 vs. Day 3; Day 3 vs. Day 4, etc.) were calculated and analyzed in two ways. First, the percentage of participants whose returned butts differed across days by +/− 20% of their self-reported CPD is reported. Second, the day-to-day variability of smoking behavior as measured via butt counts was calculated using an instability index (e.g., Sánchez-Ortuño, Carney, Edinger, Wyatt, & Harris, 2011). Specifically, the difference value between consecutive daily cigarette butt counts for each participant was squared (e.g., [(Day 2 – Day 3)ˆ2]). This process was repeated for each pair of days, resulting in three measures of “instability” for each participant, and these values were averaged to obtain a mean instability index. Greater instability index values indicate greater day-to-day variability in cigarette use. Also, Pearson and Spearman correlations were run to ascertain the relation of the mean instability index to demographic (i.e., age, sex, education) and smoking variables (i.e., number of quit attempts, years smoking, cigarette yield, cigarette flavor), as well as whether demographic or smoking variables related to consistent or variable trends in instability.
Validity of smokers’ self-reported CPD versus their returned cigarette butts
Average self-reported CPD at screening was compared to average butt counts for Days 2–5 using a paired-samples t-test. Additionally, difference scores between self-reported CPD and butt counts for each day were calculated to determine the percentage of participants whose butt counts differed from their self-reports by +/− 20% CPD. Chi-square analyses and Pearson and Spearman correlations were conducted to examine the relation of participants’ demographic (i.e., age, sex, amount of education) and smoking variables (i.e., number of quit attempts, years smoking, yield and flavor of cigarette) to their over- or under-estimation of their smoking behavior based on butt counts.
Finally, Whipple’s index (Shryock & Siegel, 1976) was used to determine the proportion of participants with a preference for reporting numbers that are rounded to “0” or “5”. The observed proportion of rounded numbers is compared to the expected proportion as assumed from a random distribution of values (see Denic, Khatib & Saadi, 2004 for more details). Scores range from 100 (no rounding) to 500 (all numbers rounded), and those <100 indicate a preference for a number different from “0” or “5” (Shiffman, 2009; Shryock & Siegel, 1976; Talib, Ali, Hamid, & Zin, 2007; United Nations, 1990). For comparison purposes, this index was calculated for smokers’ self-reported CPD, as well as for butt counts on each day.
Validity of smokers’ self-reported CPD and returned cigarette butts versus biochemical measures
Growth curve modeling was used to examine associations among self-reported CPD, cigarette butt count, and biomarkers of cigarette use (i.e., urinary cotinine and NNAL) across time. In each model, the individual biomarker, and linear and curvilinear terms for daily butt count, were nested within individual participants, and self-reported CPD was included as a subject-level variable. Both models treated study day as a continuous, linear and quadratic predictor (e.g., Days 1, 2, 3, 4, 5). Thus, these growth models directly tested the degree to which change in the biological markers was associated with linear and curvilinear change in butt count, how self-reported CPD was associated with change in both biological markers and change in butt count, and the degree to which self-reported CPD affected associations among change in butt count and change in biological markers.
Results
Test-retest reliability of smokers’ self-reports of cigarette use
Mean (±SD) self-reported CPD for telephone (20.5±5.0) and in-person (20.6±4.8) interviews were significantly correlated as indicated by Pearson r = 0.86 (p < .001; n = 56).
Consistency of smokers’ cigarette use across days
ICC’s (95% CI) for butt counts across Days 2–5 were 0.61 (0.35–0.83; Cronbach’s alpha = 0.86) for Study 1, 0.76 (0.65–0.85; Cronbach’s alpha = 0.93) for Study 2, and 0.49 (0.32–0.67; Cronbach’s alpha = 0.79) for Study 3. Given that the CI’s for the three studies were overlapping, and therefore not significantly different, smokers’ butt counts were collapsed across studies for further analyses regarding consistency [overall ICC = 0.66 (0.58–0.67; Cronbach’s alpha = 0.89)].
Difference scores revealed that butt counts differed across days by +/− 20% of the self-reported CPD for 92% of smokers. Additionally, butt counts were not significantly different as a function of gender or race, as determined by overlapping CI’s.
The mean instability index for butt counts between Days 2 and 3 was greatest (44.2±104.2), compared to instability indices for Days 3 and 4 (38.4±75.2) and Days 4 and 5 (41.6±77.4). Note that butt counts on any given day represent the number of cigarettes smoked the day prior. For instance, butt counts on Day 2 represent the number of cigarettes smoked on Day 1 of the week. No significant differences were revealed between demographic or smoking characteristics and mean instability across all four days (p’s = .10 to .95), or between demographic or smoking characteristics and the instability trend for each participant (p’s = .16 to .99).
Validity of smokers’ self-reported CPD versus returned cigarette butts
Mean self-reported CPD was not significantly different from mean butt counts on each day (t(56 to 57) = −0.84 to 0.46 for Days 2–5; all n.s.). Butt counts on at least one day of the 4-day collection period (Days 2–5) differed from self-reports by +/− 20% CPD for 92% of smokers. Additionally, 24.1% smokers consistently over-estimated their CPD (butt counts were lower than self-reports on all 4 days of collection) and 22.4% smokers consistently under-estimated their CPD (butt counts were higher than self-reports on all 4 days of collection). The remaining 53.4% of smokers returned a number of cigarette butts that were higher than their self-reports on some days, lower than their self-reports on some days, and/or equal to the number provided the day before on some days. Over- and under-estimations of CPD were not correlated significantly with any demographic or smoking characteristic (p’s = .24 to .95).
Table 2 reveals that average scores were similar for self-reports versus butt count measures of cigarette use, though butt counts were more widely distributed. As is apparent in Figure 1, for example, the most frequently self-reported number of CPD was 20, but the most frequently returned number of cigarette butts ranged from 13 to 18 across study days. Using Whipple’s Index, smokers’ reports of CPD were rounded to “5” or “0” more than four times greater than expected, while butt counts fit the expected distribution of values.
Table 2.
Descriptive characteristics of self-reported cigarette use versus returned cigarette butts
| Mean | SD | Median | Mode | Whipple’s Index | % Heaping | |
|---|---|---|---|---|---|---|
| Self-reports | ||||||
| In-person | 20.5 | 5.0 | 20 | 20 | 413.8 | 82.8 |
| Butt Counts | ||||||
| Day 2 | 20.2 | 8.6 | 19 | 13 | 94.8 | 19.0 |
| Day 3 | 20.8 | 7.4 | 19 | 18 | 131.6 | 26.3 |
| Day 4 | 20.3 | 7.6 | 18 | 13 | 94.8 | 19.0 |
| Day 5 | 21.7 | 8.3 | 20 | 15 | 129.3 | 25.9 |
Figure 1.
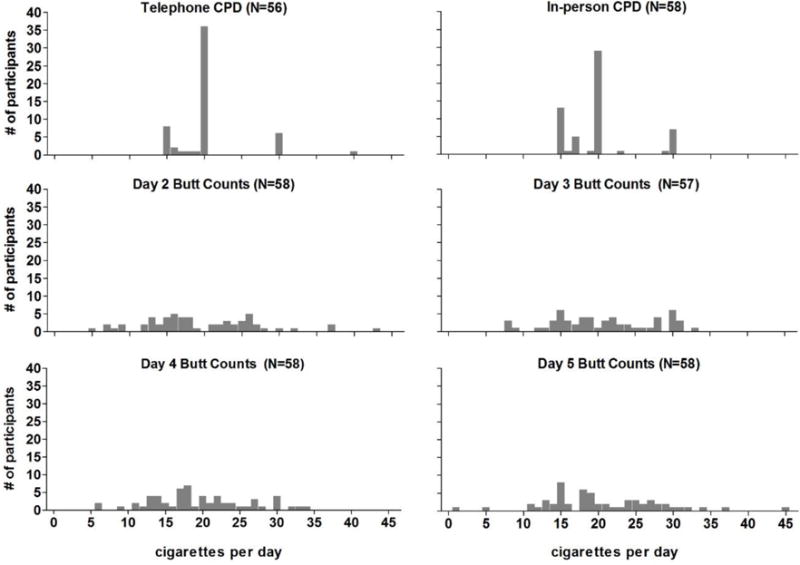
Frequency distribution of daily cigarette use as measured via telephone and in-person screening self-reports (top panels) and via returned cigarette butts over a five-day period of use (middle and bottom panels).
Associations among returned cigarette butts and biological markers
Cotinine and butt count
First, a growth curve model was run with returned cigarette butt count entered as a linear predictor. Self-reported CPD was not associated with either baseline cotinine levels (B = 23.61, SE = 18.31, p = .20) or change in cotinine levels across the study week (B = −46.62, SE = 32.05, p = .15). However, there was a statistically significant linear (B = 39.89, SE = 13.24, p = .004) association between cotinine levels and daily butt count across the week. Next, a quadratic term for daily butt count was entered to test for a curvilinear association between daily butt count and cotinine. Results indicated that there was not a curvilinear association between cotinine levels and daily butt count across the week (B = 1.36, SE = 1.25, p = .28).
NNAL and butt count
In the first model, daily butt count was entered as a linear predictor of NNAL. Similar to the results for cotinine, self-reported CPD was not significantly associated with either baseline NNAL level (B = 5.12, SE = 3.67, p = .17) or change in NNAL levels across the week (B = −10.88, SE = 10.95, p = .32). There was a statistically significant association between daily butt count and NNAL levels across the week (B = 11.16, SE = 3.84, p = .01). Next, daily butt count was entered as a quadratic term to test for a curvilinear association between daily butt count and NNAL. There was not a curvilinear association between daily butt count and levels of NNAL across the week (B = −0.41, SE = 0.28, p = .16).
Discussion
Self-reported number of CPD is often used as a measure of smokers’ daily patterns of use (Breland et al., 2002), as well as a correlate of exposure to tobacco toxicants (Khariwala et al., 2014). While convenient, this subjective measure is likely subject to bias and may not capture smokers’ variability in cigarette consumption across days. Thus, the purpose of this secondary data analysis was to examine the consistency, reliability, and validity of self-reported CPD by comparing this subjective measure to more objective indices, specifically total count of returned cigarette butts and tobacco smoke toxicant levels.
Smokers’ self-reports of their average daily cigarette use were highly reliable between telephone and in-person screening interviews, as has been reported previously (Gariti et al., 1998; Lewis-Esquerre et al., 2005; Shiffman, 2009). However, these self-reports also exhibited substantial digit bias (Clark et al., 1996; Lewis-Esquerre et al., 2005; Perkins et al., 2012; Shiffman, 2009); approximately 83% of participants provided values at the in-person screening visit that were rounded to “5” or “0”. The most frequently reported value during the telephone (62.1% of participants) and in-person (48.3% of participants) interviews was 20 CPD, or one pack of cigarettes (similar to Perkins et al., 2012; Shiffman, 2009). In contrast, returned butt counts showed virtually no evidence of digit bias. Only 19.0 to 26.3% of returned butts across the four collection days were divisible by five, a pattern similar to that observed for other real-time measurement methods such as tally cards (17.8–20.7%; Perkins et al., 2012) and electronic devices (20%; Shiffman, 2009). Additionally, of the possible 232 collection days across all participants, exactly 20 cigarette butts were returned on only seven days.
Despite these observed rates of digit bias, average number of self-reported CPD was not significantly different from average number of returned cigarette butts on each study day. Yet, over 92% of smokers returned butts on at least one collection day that differed from their CPD reported at the screening interview by 20% or more. Instability analyses further confirmed the large day-to-day variation in smoking behavior for the majority of participants. In fact, only one participant showed no change in the number of cigarette butts returned across study days. Additionally, the mean instability index was similar between each pair of consecutive days, though the greatest index was observed for butt counts between Days 2 and 3. This pattern of results may suggest that participants, who were given free packs of cigarettes for this study, slightly increased their cigarette use at the start of the study and then returned to normal smoking as the study progressed.
The rates of inconsistency observed here are substantially higher than that reported when self-reports are compared to tallies recorded via cards (Perkins et al., 2012). We assume that smokers store their cigarette butts immediately after smoking, which presumably requires less effort than finding discarded cigarette butts at a later time for storage. In contrast, tally cards may be more easily completed retrospectively in that participants could record multiple cigarettes smoked previously at one time later in the day. Indeed, previous work shows that compliance is relatively low when paper-and-pencil diaries are used (Palermo, Valenzuela, & Stork, 2004; Stone, Shiffman, Schwartz, Broderick, & Hufford, 2003). In one study (Stone et al., 2003), participants were required to use a paper-and-pencil diary that, unbeknownst to the participants, provided a time- and date-stamp of each opening of the diary. The majority of participants were observed to falsify compliance by back-filling their responses; paper-and-pencil entries were present for times and dates when electronic data indicated that the diaries had not been opened (Stone et al., 2003). Such evidence may indicate that returned cigarettes butt would be a less biased method for recording smoking behavior than paper-and-pencil diaries.
Previous work suggests that the relationship between cigarette consumption and biomarkers of smoke exposure is linear up to around 20 cigarettes per day (Etter & Perneger, 2001; Law, Morris, Watt, & Wald, 1997; Lubin, Caporaso, Hatsukami, Joseph, & Hecht, 2007). In this study, self-reports of average CPD showed no association with NNAL or cotinine levels, while cigarette butt counts showed a linear but not curvilinear relationship with levels of these toxicants. Notable is that the range of self-reported CPD was narrow in our study (i.e., 15–30 CPD, with only 15% reporting >20 CPD) relative to other work (e.g., 1–100 CPD, with 48% reporting >20 CPD; Joseph et al., 2005), and of course heavily subject to digit bias. Also notable is that previous examinations of the relationship between smoking behavior and toxicant exposure have relied primarily on self-reports of CPD (Joseph et al., 2005), and thus more work that uses prospective methods for measurement of cigarette use (e.g., cigarette butt collection) is warranted.
Limitations
Study results must be interpreted in the context of several limitations. Smokers included in these studies were those who reported smoking at least 15 cigarettes per day for at least one year (Blank et al., 2010; Breland et al., 2003, 2006); thus, study results may not generalize to smokers with a more intermittent pattern of use. The majority of participants smoked king-sized (94.4%), non-mentholated (84.3%), and “light” or “ultra-light” (87.6%) cigarettes, a pattern that appears to be consistent with the U.S. smoker population. For instance, as of 2012, market share data reveal that king-sized (56%), non-mentholated (69%), and filtered (e.g., “light” and “ultralight”; nearly 100%) cigarettes are those most commonly sold (Federal Trade Commission, 2015). Still, participants who smoked cigarettes of other types may reveal a different pattern of results. Participants in all studies were provided with their own brand of cigarettes at each visit, and the number provided was based on their self-reports during the in-person interview. Consequently, smokers’ pattern of cigarette use may have differed if they had to purchase their own cigarettes. Their pattern of use may have also been influenced by the Hawthorne effect, or a change in smoking behavior as a result of being observed (Wickstrom & Bendix, 2000). Additionally, the number of cigarette butts returned does not necessarily indicate the number of cigarettes smoked; participants may have given away or bought/received extra cigarettes, or simply not stored the butts of some cigarettes smoked. However, participants who were inconsistent with the number of butts returned (e.g., +/− >2 cigarettes), relative the number of cigarettes provided, were disqualified from the study, and thus not included in these analyses. As mentioned above, the observed pattern of smoking behavior may also have been influenced by various environmental factors not measured here (Chapman et al., 1997; Cooper et al., 2012; Hatsukami et al., 1990; Henningfield & Griffiths, 1981). For instance, butt counts were measured only during weekdays (Tuesday–Friday), and smoking behavior has shown to differ during the weekends (Bailey et al., 2012). Also notable is that the half-life for cotinine is 16–19 hours (Jarvis, Russell, Benowitz, & Feyerabend, 1988) and for NNAL is many days (Hecht, Carmella, Chen, Koch, Miller et al., 1999). Thus, exposure to these toxicants may not be best represented by cigarette butts returned over only 24 hours. Finally, study results may also have been influenced by the prospective data collection window of only four days. Indeed, other works has shown considerably less variability in smoking behavior when self-reports are compared to cigarette butt counts across seven days of use (Clark et al., 1996).
Conclusions and Future Directions
In this study, retrospective self-reports of average daily cigarette use among non-treatment seeking smokers were reliable across screening interviews, and not significantly different from daily average of returned cigarette butts during a subsequent 4-day period. Thus, smokers may be relatively accurate in their ability to estimate their average number of cigarettes smoked daily. Still, these self-reports are clearly subject to digit bias and do not accurately reflect the considerable variability in day-to-day smoking patterns (Perkins et al., 2012; Shiffman, 2009). Consequently, verbal reports of average daily cigarette use may be a viable measure for some purposes, while other work may need to capture this variation across time to determine exposure to toxicants and risk of tobacco-related disease.
Also notable is that, compared to some real-time measurement methods (e.g., electronic diaries), the collection of cigarette butts offers a cost-effective and convenient method for evaluating patterns of cigarette use over time. For instance, participants can be given a supply of relatively cheap plastic bags, small plastic containers, or even empty candy tins that are pre-labeled according to study day (e.g., “Monday”, “Tuesday”, etc.) (e.g., Clark et al., 1996). This procedure does not appear to place a burden on participants, as evidenced by the fact that only 2% of those in the combined sample included here were disqualified due to failure to return cigarette butts. Indeed, our laboratory has used this procedure successfully for over a decade (Buchhalter et al., 2005). Researchers may consider using this method in future work when a primary goal is to characterize behavioral variability or to predict toxicant exposure.
Public Health Significance.
Smokers are relatively accurate when reporting their average number of cigarettes smoked per day. However, self-reported smoking behavior may not reflect changes in cigarette use across days, and thus smokers’ exposure to tobacco chemicals. A better way to measure smoking behavior may be the collection of cigarette butts.
Footnotes
Note: All laboratory work conducted at Virginia Commonwealth University
Contributor Information
Melissa D. Blank, Email: mdblank@mail.wvu.edu, West Virginia University; Department of Psychology; 53 Campus Drive; 2214 Life Sciences Building; Morgantown, WV 26506-6040; Office: 304-293-8341; Fax: 304-293-6606.
Alison Breland, Email: abbrelan@vcu.edu, Virginia Commonwealth University, Department of Psychology; McGuire Hall, Suite B-08; 1112 East Clay Street; Richmond, VA 23219; Office: 804-628-2300; Fax: 804-828-7862.
Paul T. Enlow, Email: paenlow@mail.wvu.edu, West Virginia University; Department of Psychology; 53 Campus Drive; 1212 Life Sciences Building; Morgantown, WV 26506-6040; Fax: 304-293-6606.
Christina Duncan, Email: christina.duncan@mail.wvu.edu, West Virginia University; Department of Psychology; 53 Campus Drive; 2232 Life Sciences Building; Morgantown, WV 26506-6040; Office: 304-293-1289; Fax: 304-293-6606.
Aaron Metzger, Email: aaron.metzger@mail.wvu.edu, West Virginia University; Department of Psychology; 53 Campus Drive; 1218 Life Sciences Building; Morgantown, WV 26506-6040; Office: 304-293-1672; Fax: 304-293-6606.
Caroline O. Cobb, Email: cobbco@vcu.edu, Virginia Commonwealth University, Department of Psychology; 808 West Franklin Street, Room 304; Richmond, VA 23219; Office: 804-828-8687; Fax: 804-828-2237.
References
- Bailey SR, Jeffery CJ, Hammer SA, Bryson SW, Killen DT, Ammerman S, Killen JD. Assessing teen smoking patterns: The weekend phenomenon. Drug and Alcohol Dependence. 2012;120(1–3):242–245. doi: 10.1016/j.drugalcdep.2011.07.014. [DOI] [PMC free article] [PubMed] [Google Scholar]
- Blank MD, Eissenberg T. Evaluating oral noncombustible potential-reduced exposure products for smokers. Nicotine & Tobacco Research. 2010;12(4):336–343. doi: 10.1093/ntr/ntq003. [DOI] [PMC free article] [PubMed] [Google Scholar]
- Borland R, Yong HH, O’Connor RJ, Hyland A, Thompson ME. The reliability and predictive validity of the Heaviness of Smoking Index and its two components: findings from the International Tobacco Control Four Country study. Nicotine & Tobacco Research. 2010;12(suppl 1):S45–S50. doi: 10.1093/ntr/ntq038. [DOI] [PMC free article] [PubMed] [Google Scholar]
- Breland AB, Acosta MC, Eissenberg T. Tobacco-specific nitrosamines and potential reduced exposure products for smokers: a preliminary evaluation of Advance™. Tobacco Control. 2003;12:317–321. doi: 10.1136/tc.12.3.317. Retrieved from: http://tobaccocontrol.bmj.com/ [DOI] [PMC free article] [PubMed] [Google Scholar]
- Breland AB, Buchhalter AR, Evans SE, Eissenberg T. Evaluating acute effects of potential reduced-exposure products for smokers: clinical laboratory methodology. Nicotine & Tobacco Research. 2002;4(Suppl 2):S131–S140. doi: 10.1080/1462220021000032780. Retrieved from: http://ntr.oxfordjournals.org/ [DOI] [PubMed] [Google Scholar]
- Buchhalter AR, Acosta MC, Evans SE, Breland AB, Eissenberg T. Tobacco abstinence symptom suppression: the role played by the smoking-related stimuli that are delivered by denicotinized cigarettes. Addiction. 2005;100(4):550–559. doi: 10.1111/j.1360-0443.2005.01030.x. [DOI] [PubMed] [Google Scholar]
- Clark PI, Gautam SP, Hlaing WM, Gerson LW. Response error in self-reported current smoking frequency by black and white established smokers. Annals of Epidemiology. 1996;6(6):483–489. doi: 10.1016/s1047-2797(96)00049-x. Retrieved from: http://www.journals.elsevier.com/annals-of-epidemiology/ [DOI] [PubMed] [Google Scholar]
- Chandra S, Shiffman S, Sharf DM, Dang Q, Shadel WG. Daily smoking patterns, their determinants, and implications for quitting. Experimental and Clinical Psychopharmacology. 2007;15:67–80. doi: 10.1037/1064-1297.15.1.67. Retrieved from: http://www.apa.org/pubs/journals/pha/index.aspx. [DOI] [PubMed] [Google Scholar]
- Chapman S, Haddad S, Sindhusake D. Do work-place smoking bans cause smokers to smoke “harder”? Results from a naturalistic observational study. Addiction. 1997;92(5):607–610. Retrieved from: http://addictionjournal.org/ [PubMed] [Google Scholar]
- Collins RL, Kashdan TB, Gollnisch G. The feasibility of using cellular phones to collect ecological momentary assessment data: Application to alcohol consumption. Experimental and Clinical Psychopharmacology. 2003;11(1):73–79. doi: 10.1037/1064-1297.11.1.73. [DOI] [PubMed] [Google Scholar]
- Cooper J, Borland R, Yong HH, Hyland A, Cummings KM. Variations in daily cigarette consumption on work days compared with non-work days and associations with quitting: findings from the international tobacco control four-country survey. Nicotine & Tobacco Research. 2013;15(1):192–198. doi: 10.1093/ntr/nts110. [DOI] [PMC free article] [PubMed] [Google Scholar]
- Denic S, Saadi H, Khatib F. Quality of age data in patients from developing countries. Journal of Public Health. 2004;26(2):168–171. doi: 10.1093/pubmed/fdh131. Retrieved from: http://jpubhealth.oxfordjournals.org/ [DOI] [PubMed] [Google Scholar]
- Dolcini MM, Adler NE, Lee P, Bauman KE. An assessment of the validity of adolescent self-reported smoking using three biological indicators. Nicotine & Tobacco Research. 2003;5(4):473–483. Retrieved from: http://ntr.oxfordjournals.org/ [PubMed] [Google Scholar]
- Duhig AM, Cavallo DA, McKee SA, George TP, Krishnan-Sarin S. Daily patterns of alcohol, cigarette, and marijuana use in adolescent smokers and nonsmokers. Addictive Behaviors. 2005;30(2):271–283. doi: 10.1016/j.addbeh.2004.05.016. Retrieved from: http://www.journals.elsevier.com/addictive-behaviors/ [DOI] [PubMed] [Google Scholar]
- Etter JF, Perenger TV. Measurement of self-reported active exposure to cigarette smoke. Journal of Epidemiology and Community Health. 2001;55(9):674–80. doi: 10.1136/jech.55.9.674. Retrieved from: http://www.journals.elsevier.com/journal-of-epidemiology-and-global-health/ [DOI] [PMC free article] [PubMed] [Google Scholar]
- Federal Trade Commission. Federal Trade Commission Cigarette Report for 2012. Washington: Federal Trade Commission; 2015. [accessed 2015 Aug 11] [Google Scholar]
- Gariti PW, Alterman AI, Ehrman RN, Pettinati HM. Reliability and validity of the aggregate method of determining number of cigarettes smoked per day. The American Journal on Addictions. 1998;7(4):283–287. Retrieved from: http://onlinelibrary.wiley.com/journal/10.1111/(ISSN)1521-0391. [PubMed] [Google Scholar]
- Gorber SC, Schofield-Hurwitz S, Hardt J, Levasseur G, Tremblay M. The accuracy of self-reported smoking: a systematic review of the relationship between self-reported and cotinine-assessed smoking status. Nicotine & Tobacco Research. 2009;11(1):12–24. doi: 10.1093/ntr/ntn010. [DOI] [PubMed] [Google Scholar]
- Hammersley R. A digest of memory phenomena for addiction research. Addiction. 1994;89:283–293. doi: 10.1111/j.1360-0443.1994.tb00890.x. Retrieved from: http://addictionjournal.org/ [DOI] [PubMed] [Google Scholar]
- Heatherton TF, Kozlowski LT, Frecker RC, Fagerström KO. The Fagerström Test for Nicotine Dependence: A revision of the Fagerström Tolerance Questionnaire. British Journal of Addiction. 1991;86:1119–1127. doi: 10.1111/j.1360-0443.1991.tb01879.x. Retrieved from: http://addictionjournal.org/ [DOI] [PubMed] [Google Scholar]
- Hassan E. Recall bias can be a threat to retrospective and prospective research designs. The Internet Journal of Epidemiology. 2006;3(2):339–412. [Google Scholar]
- Hecht SS, Carmella SG, Chen M, Dor Koch JF, Miller AT, Murphy SE, Jensen JA, Zimmerman CL, Hatsukami DK. Quantification of urinary metabolites of a tobacco specific lung carcinogen after smoking cessation. Cancer Research. 1999;59(3):590–596. [PubMed] [Google Scholar]
- Henningfield JE, Griffiths RR. Cigarette smoking and subjective response: effects of d-amphetamine. Clinical Pharmacology & Therapeutics. 1981;30(4):497–505. doi: 10.1038/clpt.1981.194. Retrieved from: http://onlinelibrary.wiley.com/journal/10.1002/(ISSN)1532-6535. [DOI] [PubMed] [Google Scholar]
- Harris KJ, Golbeck AL, Cronk NJ, Catley D, Conway K, Williams KB. Timeline follow-back versus global self-reports of tobacco smoking: A comparison of findings with nondaily smokers. Psychology of Addictive Behaviors. 2009;23(2):368. doi: 10.1037/a0015270. [DOI] [PMC free article] [PubMed] [Google Scholar]
- Harrison L. The validity of self-reported drug use in survey research: an overview and critique of research methods. NIDA Research Monograph. 1997;167:17–36. Retrieved from: http://archives.drugabuse.gov/pdf/monographs/ [PubMed] [Google Scholar]
- Hatsukami DK, Morgan SF, Pickens RW, Champagne SE. Situational factors in cigarette smoking. Addictive Behaviors. 1990;15(1):1–12. doi: 10.1016/0306-4603(90)90002-f. Retrieved from: http://www.journals.elsevier.com/addictive-behaviors/ [DOI] [PubMed] [Google Scholar]
- Jarvis MJ, Russell MA, Benowitz NL, Feyerabend C. Elimination of cotinine from body fluids: implications for noninvasive measurement of tobacco smoke exposure. American Journal of Public Health. 1988;78(6):696–698. doi: 10.2105/ajph.78.6.696. [DOI] [PMC free article] [PubMed] [Google Scholar]
- Joseph AM, Hecht SS, Murphy SE, Carmella SG, Le CT, Zhang Y, Hatsukami DK. Relationships between cigarette consumption and biomarkers of tobacco toxin exposure. Cancer Epidemiology, Biomarkers, & Prevention. 2005;14(12):2963–2968. doi: 10.1158/1055-9965.EPI-04-0768. [DOI] [PubMed] [Google Scholar]
- Johannes CB, Woods J, Crawford S, Cochran H, Tran D, Schuth B. Electronic versus paper instruments for daily data collection. Annals of Epidemiology. 2000;10(7):457. doi: 10.1016/s1047-2797(00)00141-1. Retrieved from: http://www.journals.elsevier.com/annals-of-epidemiology/ [DOI] [PubMed] [Google Scholar]
- Klesges RC, Debon M, Ray JW. Are self-reports of smoking rate biased? Evidence from the Second National Health and Nutrition Examination Survey. Journal of Clinical Epidemiology. 1995;48(10):1225–1233. doi: 10.1016/0895-4356(95)00020-5. Retrieved from: http://www.journals.elsevier.com/journal-of-clinical-epidemiology/ [DOI] [PubMed] [Google Scholar]
- Law MR, Morris JK, Watt HC, Wald NJ. The dose-response relationship between cigarette consumption, biochemical markers and risk of lung cancer. British Journal of Cancer. 1997;75(11):1690–1693. doi: 10.1038/bjc.1997.287. [DOI] [PMC free article] [PubMed] [Google Scholar]
- Lewis-Esquerre JM, Colby SM, Tevyaw TOL, Eaton CA, Kahler CW, Monti PM. Validation of the timeline follow-back in the assessment of adolescent smoking. Drug and Alcohol Dependence. 2005;79(1):33–43. doi: 10.1016/j.drugalcdep.2004.12.007. Retrieved from: http://www.journals.elsevier.com/drug-and-alcohol-dependence/ [DOI] [PubMed] [Google Scholar]
- Lubin JH, Caporaso N, Hatsukami DK, Joseph AM, Hecht SS. The association of a tobacco-specific biomarker and cigarette consumption and its dependence on host characteristics. Cancer Epidemiology, Biomarkers, & Prevention. 2007;16:1852–1857. doi: 10.1158/1055-9965.EPI-07-0018. [DOI] [PubMed] [Google Scholar]
- McGraw KO, Wong SP. Forming inferences about some intraclass correlation coefficients. Psychological Methods. 1996;1(1):30. Retrieved from: http://www.apa.org/pubs/journals/met/index.aspx. [Google Scholar]
- Mooney LA, Madsen AM, Tang D, Orjuela MA, Tsai WY, Garduno ER, Perera FP. Antioxidant vitamin supplementation reduces benzo (a) pyrene-DNA adducts and potential cancer risk in female smokers. Cancer Epidemiology Biomarkers & Prevention. 2005;14(1):237–242. Retrieved from: http://cebp.aacrjournals.org/ [PubMed] [Google Scholar]
- Morabia A, Bernstein MS, Curtin F, Berode M. Validation of self-reported smoking status by simultaneous measurement of carbon monoxide and salivary thiocyanate. Preventive Medicine. 2001;32(1):82–88. doi: 10.1006/pmed.2000.0779. Retrieved from: http://www.journals.elsevier.com/preventive-medicine/ [DOI] [PubMed] [Google Scholar]
- Naidong W, Shou W, Chen YL, Jiang X. Novel liquid chromatographic-tandem mass spectrometric methods using silica columns and aqueous-organic mobile phases for quantitative analysis of polar ionic analytes in biological fluids. Journal of Chromatography B. 2001;754:387–399. doi: 10.1016/s0378-4347(01)00021-4. [DOI] [PubMed] [Google Scholar]
- Palermo TM, Valenzuela D, Stork PP. A randomized trial of electronic versus paper pain diaries in children: impact on compliance, accuracy, and acceptability. Pain. 2004;107(3):213–219. doi: 10.1016/j.pain.2003.10.005. [DOI] [PubMed] [Google Scholar]
- Pardeshi GS. Age heaping and accuracy of age data collected during a community survey in the Yavatmal district, Maharashtra. Indian Journal of Community Medicine. 2010;35(3):391. doi: 10.4103/0970-0218.69256. [DOI] [PMC free article] [PubMed] [Google Scholar]
- Pearce MS, Hayes L. Self-reported smoking status and exhaled carbon monoxide results from two population-based epidemiologic studies in the north of England. CHEST Journal. 2005;128(3):1233–1238. doi: 10.1378/chest.128.3.1233. Retrieved from: http://journal.publications.chestnet.org/ [DOI] [PubMed] [Google Scholar]
- Perkins KA, Jao NC, Karelitz JL. Consistency of daily cigarette smoking amount in dependent adults. Psychology of Addictive Behaviors. 2013;27(3):723–729. doi: 10.1037/a0030287. [DOI] [PMC free article] [PubMed] [Google Scholar]
- Roethig HJ, Zedler BK, Kinser RD, Feng S, Nelson BL, Lian Q. Short-term clinical exposure evaluation of a second generation electrically heated cigarette smoking system. Journal of Clinical Pharmacology. 2007;47:518–530. doi: 10.1177/0091270006297686. [DOI] [PubMed] [Google Scholar]
- Rosel J, Elósegui E. Daily and weekly smoking habits: A Box-Jenkins analysis. Psychological Reports. 1994;75(3f):1639–1648. doi: 10.2466/pr0.1994.75.3f.1639. Retrieved from: http://www.amsci.com/psychological-reports/ [DOI] [PubMed] [Google Scholar]
- Sánchez-Ortuño MM, Carney CE, Edinger JD, Wyatt JK, Harris A. Moving beyond average values: Assessing the night-to-night instability of sleep and arousal in DSM-IV-TR insomnia subtypes. Sleep. 2011;34(4):531–539. doi: 10.1093/sleep/34.4.531. Retrieved from: http://journalsleep.org/ [DOI] [PMC free article] [PubMed] [Google Scholar]
- Shiffman S. How many cigarettes did you smoke? Assessing cigarette consumption by global report, Time-Line Follow-Back, and ecological momentary assessment. Health Psychology. 2009;28(5):519. doi: 10.1037/a0015197. [DOI] [PMC free article] [PubMed] [Google Scholar]
- Shryock Henry S, Siegel JS. The Methods and Materials of Demography. New York: Academic Press; 1976. [Google Scholar]
- Stone AA, Shiffman S, Schwartz JE, Broderick JE, Hufford MR. Patient compliance with paper and electronic diaries. Controlled clinical trials. 2003;24(2):182–199. doi: 10.1016/s0197-2456(02)00320-3. [DOI] [PubMed] [Google Scholar]
- Talib AL, Ali MS, Hamid MS, Zin KM. Age Reporting Behaviour: A Case Study of 1991 and 2000 Population and Housing Censuses, Malaysia 2007 [Google Scholar]
- Townsend N, Rutter H, Foster C. Variations in data collection can influence outcome measures of BMI measuring programmes. International Journal of Pediatric Obesity. 2011;6(5–6):491–498. doi: 10.3109/17477166.2011.605897. [DOI] [PubMed] [Google Scholar]
- United Nations. 1998 Demographic Yearbook. New York, NY: United Nations; 2000. [Google Scholar]
- Weir JP. Quantifying test-retest reliability using the intraclass correlation coefficient and the SEM. The Journal of Strength & Conditioning Research. 2005;19(1):231–240. doi: 10.1519/15184.1. http://journals.lww.com/nsca-jscr/pages/default.aspx. [DOI] [PubMed] [Google Scholar]
- Wickstrom G, Bendix T. The “Hawthorne effect” – what did the original Hawthorne studies actually show? Scandinavian Journal of Work, Environment, & Health. 2000;26(4):363–367. [PubMed] [Google Scholar]