Abstract
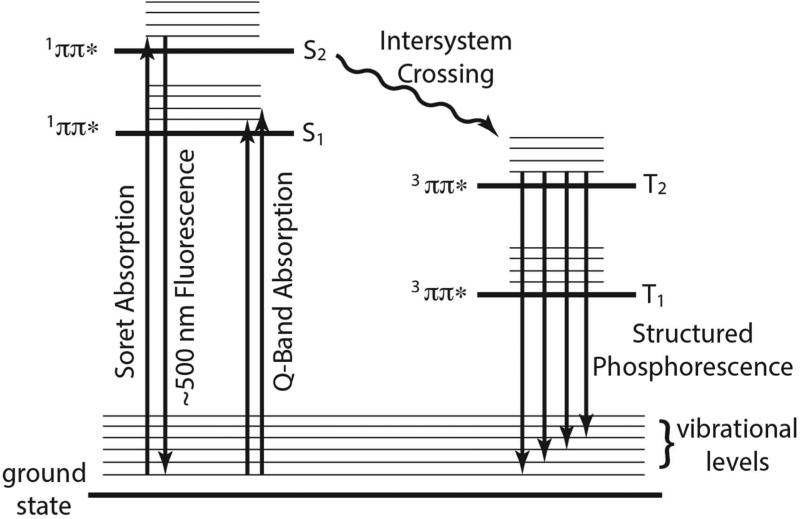
Metalloporphyrin containing proteins, such as cytochrome P450, play a key role in biological systems. The spectroscopic properties of metalloporphyrins have been a subject of intense interest and intense debate for over 50 years. Iron-porphyrins are usually believed to be non-fluorescent. Herein we report that contrary to this belief, cytochrome P450 heme groups luminesce with enough intensity to be of use in the characterization of these enzymes. To confirm that the emission is from the heme we destroyed the heme by titration with cumene hydroperoxide and measured the changes in emission upon titration with compounds known to bind to the distal face of the heme in two human cytochrome P450 enzymes, known as CYP3A4 and CYP2C9. The titration curves gave spectral dissociation constants that were not significantly different than those reported using the Soret UV/vis absorbance changes. We have tentatively assigned the broad luminescence at ~500 nm to a 1ππ*→gs fluorescence and the structured luminescence above 600 nm to a 3ππ*→gs phosphorescence. These assignments are not associated with the Q band, and are in violation of Kasha's rule. To illustrate the utility of the emission, we measured spectral dissociation constants for testosterone binding to P450 3A4 in bilayers formed on glass cover slips, a measurement that would be very difficult to make using absorption spectroscopy. Complementary experiments were carried out with water soluble P450cam.
Keywords: Cytochrome P450, CYP3A4, CYP2C9, porphyrin luminescence, fluorescence spectroscopy
Graphical Abstract
1. Introduction
Cytochrome P450 enzymes (CYPs) constitute a very large family of membrane bound enzymes found in all eukaryotic organisms (animals, plants, and fungi) as well as some prokaryotes. They are responsible for a wide variety of oxidative transformations essential in detoxification, drug metabolism, and in biosynthetic processes requiring an oxidative step.1-2 All CYPs contain an essential heme prosthetic group as a key component of the active site. CYPs in the ferric state will bind substrates, get reduced to the ferrous form by an electron provided by NADPH, complex with dioxygen at the heme, and reduce the second oxygen atom using a second electron also provided by NADPH. The heterolytic cleavage of the O-O bond leads to the formation of water and an iron(IV)oxo species (known as Compound I), which is responsible of inserting an oxygen atom into the substrate.2 Because of their ability to transfer a single oxygen atom to a bound substrate, they are broadly categorized as monooxygenases. Of the large number of P450 isoforms, CYP3A4 and CYP2C9 are responsible for about 65% of all oxidative drug metabolism in humans.1 They are found on the cytoplasmic side of the endoplasmic reticulum and are mainly located in hepatocytes (CYP3A4 and CYP2C9) and intestinal cells (CYP3A4). The main redox partner for CYP3A4 and CYP2C9 is cytochrome P450 reductase (POR), which acts as an electron shuttle between NADPH and the enzymes. Cytochrome b5 (b5) also plays a role in the shuttling of electrons to both CYP3A4 and CYP2C9, however its function is much less understood.1, 3
The spectroscopic properties of metalloporphyrins have been a subject of intense interest and debate for over 50 years. The two lowest 1ππ* states of a porphyrin molecule are the Q-band (1S1) and the higher laying Soret (1S2). It is well known that porphyrins containing metals that (1) have a low atomic weight, (2) are diamagnetic, and (3) have a d0 or d10 orbital configurations can be highly fluorescent and display anomalous emission from the 1S2 →gs in violation of Kasha's rule (such as Mg2+ and Zn2+).4-12 Anomalous emission from porphyrins containing open shell transition metals such as Ni(II), Co(II), Cu(II), Mn(II), Cr(III), and Fe(III) is usually absent or extremely weak because 1dd* and 1MLCT states are often interleaved between the 1S1 and 1S2 states of the porphyrins and provide a radiationless deactivation pathway. 11-12 In general, iron-porphyrins are usually considered to be non-fluorescent, but there are a few heme-containing proteins that do fluoresce; albeit weakly (i.e. ferrocytochrome c and ferrocytochrome b5).13-15 In fact, Champion et al. have reported weak anomalous emission at 550 nm when ferrocytochrome c is excited into the 1S2 state, though emission from 1S1→gs is greater than that observed from 1S2 →gs.14-15
While fluorescent probes and substrates have been extensively used to monitor CYP3A4 and CYP2C9 reactions,16-17 there is no mention of native luminescence from these isoforms. Here we describe the native luminescence from CYP3A4 and CYP2C9 and present arguments for tentative state assignments for the observed luminescence transitions. We also describe the dependence of the luminescence on ligand binding and the oxidation state of the heme. Finally, protocols are described that use the native fluorescence to determine ligand binding constants in solubilized proteins and proteins incorporated in a supported lipid bilayer.
2. Materials and Methods
2.1 Materials
All reagents were obtained from Sigma-Aldrich / Fluka (St. Louis, MO). N-(naphthalene-2-yl)-2-(pyridine-4-yl)quinoline-4-carboxamide (QC) was synthesized according to the synthetic procedure described by Peng et al.18 1,2-dioleoyl-sn-glycero-3-phosphocholine (DOPC), 1,2-dilauroyl-sn-glycero-3-phosphocholine (DLPC), and 1,2-dilauroyl-sn-glycero-3-phospho-L-serine (DLPS) were purchased from Avanti Polar Lipids (Alabaster, AL) and used as received. Flurbiprofen, testosterone, and QC stock solutions were prepared in DMSO; camphor stock solution was prepared in methanol.
2.2 Enzyme expression and purification
CYP2C9 was expressed in E. coli and purified as described previously.19 CYP3A4 was expressed in E. coli and purified as described by Roberts.20 P450cam was expressed and purified as described by French et al. 21 For the purification step, CYP3A4 and CYP2C9 are first solubilized with 1% emulgen and loaded onto a Ni2+ column eluted with 100 mM KPi (pH 7.4), 20% glycerol, 500 mM imidazole, and 0.05% cholate. P450cam was solubilized and loaded onto a Ni2+ column as described above for CYPs, and eluted with 20 mM KPi (pH 7.4), 500 mM imidazole, and 500 mM NaCl. The purified proteins were then dialyzed overnight at 4 °C against 100 mM KPi (pH 7.4) and 20% glycerol (v/v) using a 15 kDa MEDI tube-O-dialyzer (G-Biosciences, St. Louis, MO) and stored at −80 °C. The concentration of the purified CYP3A4 and CYP2C9 was kept below 25 μM to avoid protein aggregation and precipitation. The purity of both CYP2C9 and CYP3A4, as well as P450cam was >95% as determined by SDS–PAGE analysis and CO bound UV/Vis absorption. The protein isolates had an Rz value (A280/A418) between 0.75-1.05; fresh protein did not contain appreciable amount of P420, as determined by CO bound UV-Vis absorption. Protein concentration was determined by absorbance at 450 nm using an extinction coefficient of 91 mM−1cm−1 for the CO bound protein.22
2.3 Sample preparation for solution phase spectroscopy
Solution phase UV/Vis absorption and laser-induced steady state emission experiments were carried out with purified full-length CYP3A4, CYP2C9 and P450cam at room temperature. The working CYP concentrations were 9.7 μM for CYP3A4, 3.5 μM for CYP2C9 and 30.1 μM for P450cam in phosphate buffer (100 mM KPi (pH 7.4), 20% glycerol (v/v)); the solutions were stored on ice until used. Each sample contained 100 μL of CYP solution pipetted into a glass emission tube that was mounted in a fixed sample holder and allowed to warm to room temperature (17 °C). Blank samples containing phosphate buffer (described above) were handled in the same fashion as those containing CYP.
2.4 Reduction of heme with dithionite
UV/Vis absorption and luminescence spectra were also collected from CYP2C9 and CYP3A4 samples in which the heme was reduced by a small amount of dithionite in aerobic conditions. For these experiments, the samples were prepared as described above, but a few grains of dithionite were added to the emission tube and allowed to react for 5 minutes prior to any spectroscopic measurements.
2.5 Degradation of heme with cumene hydroperoxide
It is known that cumene hydroperoxide (CuOOH) will degrade the heme in CYPs into mono- and dipyrroles.23 UV/Vis absorption and luminescence spectra were obtained from CYP2C9 and CYP3A4 after oxidative degradation of their heme prosthetic by CuOOH. These samples were prepared as described above, except 1 μL of a 100 mM CuOOH stock solution in phosphate buffer was added to the emission tube and incubated at 37 °C for 15 minutes prior to UV/Vis and steady state emission measurements.
2.6 UV/Vis absorption measurements
All UV/Vis absorption spectra were carried out with a split-beam Olis upgraded Aminco DW-2000 spectrophotometer (Olis, Inc., Bogart, GA) equipped with a Quantum Northwest TLC50™ temperature-controlled cuvette holder (Quantum Northwest Inc., USA, Liberty Lake, WA). Each spectrum was collected over a wavelength range of 350-600 nm with 1 nm steps. Each reported spectra was an average of 10 scans. All spectra were plotted and analyzed with Igor Pro (version 6.34, WaveMetrics Inc.).
2.7 Laser induced emission and excitation spectroscopy
All laser-induced steady state emission spectra were collected with a home-built luminescence spectrometer that utilized either a cw-diode laser (408 nm, ~2mW, Coherent Model 0222-583-00) or a doubled cw-Nd:YAG laser (532 nm, ~5 mW, BWTEK Inc.). The sample holder was fixed at the focal point of the collection optics and light emitted by the samples was collected at a 90° angle from the excitation beam. Unlike CYP3A4 and CYP2C9, the luminescence intensity of P450cam decreased over time when excited at 408 nm. Therefore, it was necessary to collect P450cam spectra while stirring to minimize the effects of photodecomposition. Depending on the excitation wavelength, scatter from the laser beam into the monochromator was removed with a 33 M KNO2 water filter (λex= 408 nm) or a Corning colored glass filter (λex= 532 nm). The emitted light was then dispersed by an Acton 500i monochromator and detected with a thermoelectrically cooled Hamamatsu R943-02 photomultiplier tube. The detector signal was then passed through a wide-band preamplifier (SRS model SR445) and fed to a photon counter (SRS model SR400). Data was transferred to a PC for further manipulation using Igor Pro software (version 6.34, WaveMetrics Inc.). All spectra were an average of a least three scans, corrected against an Ocean Optics calibrated light source (model HL3-INT-CAL, spectral irradiance standard), background subtracted, and Gaussian smoothed (see supplementary material for unsmoothed spectra).
Laser induced excitation spectra were measured with a tunable femtosecond Ti:Sapphire laser (Spectra Physics Mai Tai) that was frequency doubled using a BBO crystal (Eksma Optics).
This configuration afforded laser excitation from 400 nm to 434 nm in two nanometer steps. Spectra were attained by measuring the fluorescence intensity at 497 nm for CYP3A4, 511 nm for CYP2C9, and 624 nm for both CYP3A4 and CYP2C9 vs. excitation wavelength. The laser power was monitored with a laser power meter (Standard Power Sensor S120B, Thorlabs Inc.) and all spectra were corrected for changes in laser power. The spectra were also corrected against an actinometer placed in the identical optical path as the sample. A saturated solution of Rhodamine B served as the actinometer and gave identical results as spectra corrected against the laser power meter. For the excitation experiments, a small amount of the laser beam was scattered through the KNO2 filter of the spectrometer and its wavelength was measured directly.
2.8 Determination of relative quantum yields
Relative quantum yields were measured against tris(2,2'-bipyridyl)ruthenium(II) dichloride (Ru(bpy)3Cl2). The relative quantum yields were determined by:
where Φ is the quantum yield from CYP3A4 or CYP2C9, ΦR is the quantum yield from Ru(bpy)3Cl2 (ΦR = 0.043 in nitrogen degassed water at 17 °C),24 I is the integrated intensity of CYP3A4 or CYP2C9, IR is the integrated intensity of Ru(bpy)3Cl2, ODR is the optical density of Ru(bpy)3Cl2 at 408 nm, OD is the optical density of CYP3A4 or CYP2C9 at 408 nm, nR is the index of refraction of water and n is the index of refraction of the buffer (taken to be approximately equal).
2.9 Titrations of CYP2C9 and CYP3A4 with type I and type II ligands
The luminescence from CYP2C9 and CYP3A4 was measured in the presence of increasing concentrations of type I and type II ligands. These experiments were carried out at room temperature and the concentrations of the enzymes were held constant (9.7 μM for CYP3A4 and 3.5 μM for CYP2C9). The details concerning the ligand concentrations are given in the captions of Figures 5 and 6. The luminescence collection was carried out as described in section 2.7. Type I ligands displace water to alter the spin state of the heme resulting in an increase in absorbance around 390 nm and a decrease in the low spin absorbance at 420 nm, while type II ligands coordinate to the heme in place of water resulting in an increase and red shift of the 420 nm absorption. Testosterone was used as the type I ligand for CYP3A4 and flurbiprofen was used as the type I ligand for CYP2C9. The type II ligand 2-(pyridine-4-yl)quinoline-4-carboxamide (QC) was used for both CYP3A4 and CYP2C9.18, 25 The dependence of the phosphorescence band intensity on ligand concentration was determined by subtracting each steady state emission spectrum from the initial spectrum containing no substrate and integrating the intensity from 600 nm to 800 nm. The absolute value of the change in integrated intensity (ΔI) was plotted against substrate concentration and the spectroscopic dissociation constants (KS) were determined by the tight binding model below (Enzyme Kinetics, Segel, p 73, Eq. (II-53))26:
Where ΔImax is the absolute value of the maximum change in integrated intensity, [E] is the enzyme concentration and [L] is the concentration of the ligand. The analysis was performed with IgorPro software (version 6.34, WaveMetrics Inc.).
Figure 5.
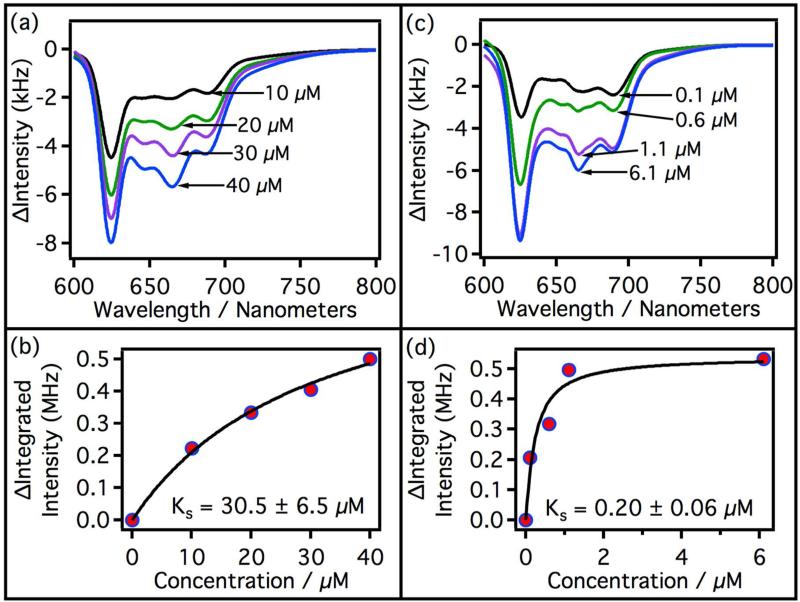
Difference spectra of substrate-bound and substrate-free CYP3A4. CYP3A4 concentration was held constant at 9.7 μM for all experiments. Titration curves were derived from luminescence spectra integrated from 616 nm to 702 nm. (a) Difference spectra with increasing testosterone concentration. Black = 10 μM, green = 20 μM, purple = 30 μM, and blue = 40 μM. (b) Titration curve of CYP3A4 with testosterone. ΔI is the difference in the luminescence intensity integrated from 616 nm to 702 nm. The black line is a fit of the data using the equation given in section 2.9. (c) Difference spectra of CYP3A4 with increasing concentration of QC. Black = 0.1 μM, green = 0.6 μM, purple = 1.1 μM, and blue = 6.1 μM. (d) Titration curve of CYP3A4 with QC, black line is a fit of the data with the equation given in section 2.9.
Figure 6.
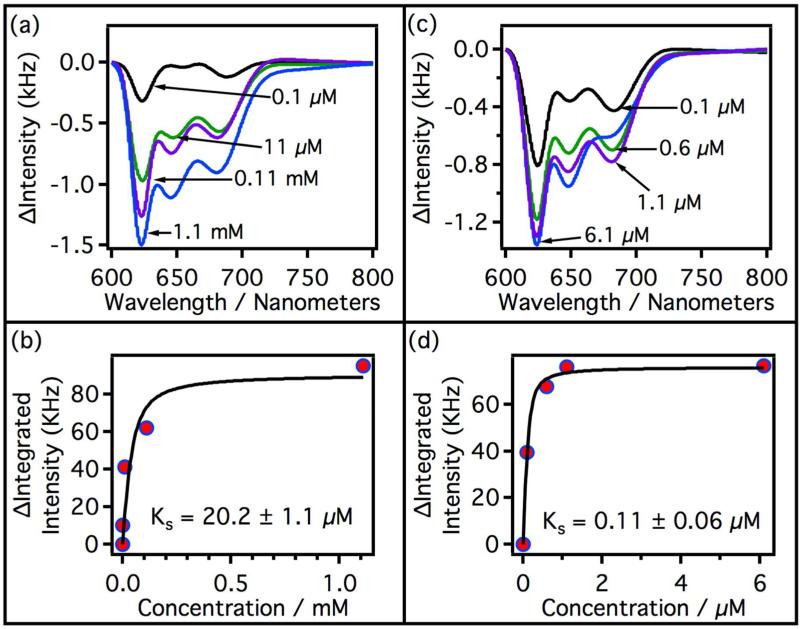
Difference spectra of substrate-bound and substrate-free CYP2C9. CYP2C9 concentration was held constant at 3.5 μM for all experiments. Titration curves were derived from luminescence spectra integrated from 616 nm to 702 nm. (a) Difference spectra with increasing flurbiprofen concentration. Black = 0.1 μM, green = 11 μM, purple = 0.11 mM, and blue = 1.1 mM. (b) Spectroscopic titration curve of CYP2C9 with flurbiprofen. The black line is a fit of the data using the equation given in section 2.9. (c) Difference spectra of CYP2C9 with increasing concentration of QC. Black = 0.1 μM, green = 0.6 μM, purple = 1.1 μM, and blue = 6.1 μM. (d) Titration curve of CYP2C9 with QC. The black line is a fit of the data using equation given in section 2.9.
2.10 Titration of P450cam with camphor
The titration of P450cam against its natural substrate camphor was accomplished in the same manner as described in section 2.9. Since P450cam was less photostable than CYP3A4 and CYP2C9, it was necessary to titrate P450cam (2.5 μM) while stirring.
2.11 Heavy element effect on the luminescence spectrum of P450cam
Luminescence spectra were collected as a function of a heavy element (I−) known to increase phosphorescence intensity due to the enhanced spin-orbit coupling it provides. Potassium iodide was added to P450cam (2.5 μM) at three final concentrations (50, 100, and 200 μM) and luminescence spectra were taken while stirring. At each concentration of KI, fresh enzyme was used and the ionic strength of the solution buffer was kept constant.
2.12 Preparation of small unilamellar vesicles
Small unilamellar vesicles (SUVs) were prepared from a 2.5 mM total lipid solution of DOPC, DLPC, and DLPS in a ratio of 1:1:1 (w/w/w) in chloroform:methanol 1:0.12 (v/v) at a total volume of 1 mL. This solution was added to a 5 mL round bottom flask and dried under a slow stream of pre-purified nitrogen for at least 2.5 hours. After drying, LMVs (large multilamellar vesicles) were formed by hydrating the lipid cake in 1 mL 5X buffer (0.5 mg/mL CHAPS, 200 mM potassium HEPES (pH 7.4) and 150 mM MgCl2) for 1 hour at 60 °C followed by gentle vortexing for 10 minutes, resulting in a turbid solution. This protocol was developed by Shaw et al.,27 and is the most prevalent protocol for the reconstitution of purified CYPs in vesicles. The suspension of LMVs was placed in a bath sonicator at 60 °C for 30 minutes upon which the turbid solution became translucent, indicating the formation of SUVs (small unilamellar vesicles). The solution containing the SUVs was centrifuged for 30 minutes at 100,000 × g and the supernatant (containing the SUVs) was transferred to a 1 mL Eppendorf tube and used the same day.
2.13 Formation of planar supported lipid bilayers
Lipid bilayers were prepared according to a protocol recently described by our group.28 Briefly, 25 mm round borosilicate glass coverslips were first hydrophilically treated in a solution of water, concentrated nitric acid, and 30% hydrogen peroxide (1:1:1 by volume) at 80 °C for 45 minutes, with gentle agitation to separate the coverslips. The coverslips were then rinsed with a copious amount of purified water and dried under a gentle stream of pre-purified nitrogen. A single coverslip was then placed onto a sample holder and fitted with a parafilm® gasket containing an 8 mm hole cut into its center. 50 μL of the SUV solution was then placed in the center hole and allowed to incubate at 37 °C for 45 minutes during which the SUVs fuse to the glass substrate, rupture, and form a continuous bilayer. After incubation the SUV solution was carefully removed and gently rinsed 6 times with 5X buffer.
2.14 Incorporation of CYP3A4 into lipid bilayers
CYP3A4 was incorporated into the lipid bilayers described above by first removing (by pipette) the buffer above the bilayer and replacing it with 50 μL of a 9.7 μM solution of CYP3A4 in 5X buffer and allowing the protein to insert into the bilayer by incubating it for 30 minutes at 37 °C. After incubation, the solution was carefully removed and the membrane with CYP3A4 incorporated into it was gently washed 6 times with 5X buffer to remove any unincorporated enzyme. Measurements were made immediately after sample preparation.
2.15 Fluorescence microscopy
All fluorescence imaging measurements were made using an Olympus IX71 inverted fluorescence microscope fitted with a Hg:Xe lamp. Light from the lamp was passed through a 420 nm bandpass filter (40 nm FWHM; Chroma Technologies; AT420/40X), reflected through a microscope objective (Olympus Apo 100x 1.45 N/A) with a dichroic mirror (Chroma Technologies; AT455DC) and focused onto the sample. The emitted light was collected by the objective, passed through the dichroic mirror, and then passed through either a 517 nm bandpass filter (30 nm FWHM Chroma Technologies; S517/30m) or a 647 nm bandpass filter (26 nm FWHM Chroma Technologies; S647/26x) before being imaged onto a Hamamatsu ORCAII CCD camera. All data was collected using the Advanced MetaMorph software suite (Olympus, Inc).
2.16 Titration of membrane incorporated CYP3A4 with testosterone
The change in luminescence intensities from CYP3A4 was measured as a function of increasing testosterone concentration. The phosphorescence intensity was monitored with a 634 nm – 660 nm bandpass filter and the fluorescence intensity was monitored with 502 nm – 532 nm bandpass filter. Spectroscopic dissociation constants (KS1 and KS2) were determined by fitting the data to a consecutive two-site ligand binding model given below 29:
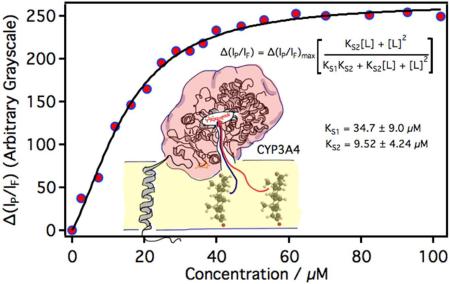
where Δ(IP/IF)max is the maximum change in the ratio of phosphorescence to fluorescence intensity and [L] is the testosterone concentration. The analysis was performed with IgorPro software (version 6.34, WaveMetrics Inc.). Fresh samples were prepared for each point in the titration of membrane bound CYP3A4 with testosterone. Care was taken to prepare each sample under identical conditions, but the exact amount of P450 incorporated into the membrane did vary from sample to sample. Unlike solution phase experiments, this resulted in a small but measureable sample variance in the overall luminescence intensities. It was also noted, from solution phase experiments, that while the overall luminescence intensity (both fluorescence and phosphorescence) decreased with the addition of a ligand, the phosphorescence intensity was much more sensitive to substrate binding. For this reason, the change in the ratio of the phosphorescence intensity (IP) to the fluorescence intensity (IF) was plotted vs. testosterone concentration, instead of ΔIP vs. testosterone as described in section 2.9. Note: Δ(IP/IF) was taken relative to samples free of testosterone. Both methods, ΔIP vs. [L] and Δ(IP/IF) vs. [L], gave statistically identical KS values when measured in solution, where the CYP concentrations are better controlled. But the later method proved to be a better choice for samples that display a measureable sample variance---which was the case for membrane samples.
3. Results
3.1 Laser induced luminescence properties of CYP3A4 and CYP2C9
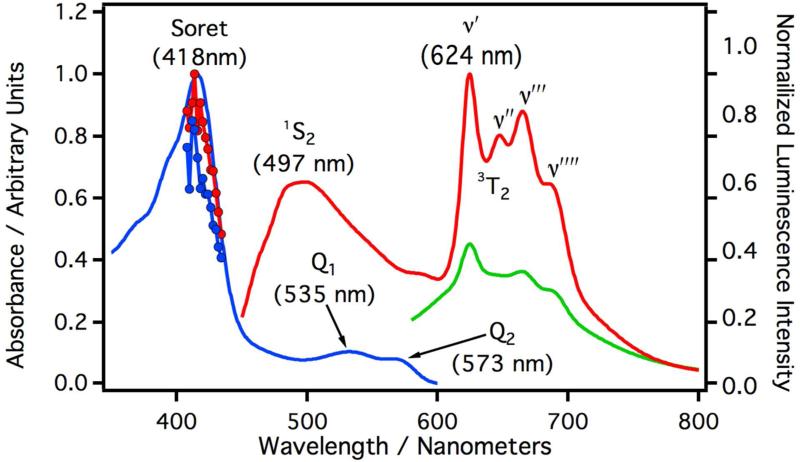
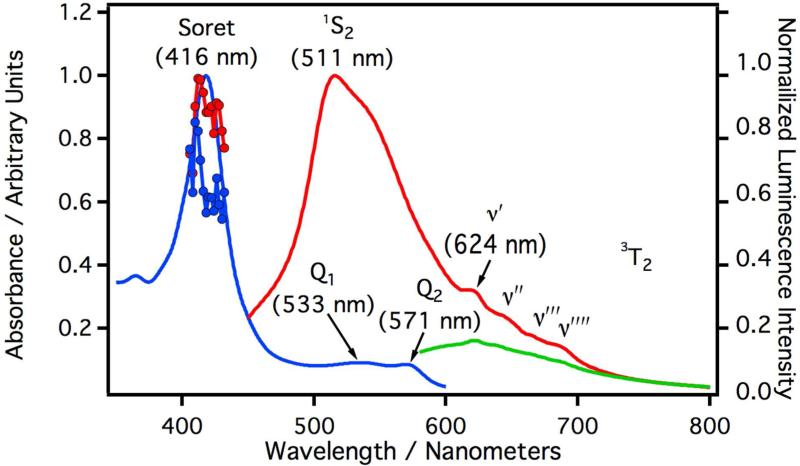
Figure 1 depicts the absorption, laser induced excitation, and laser induced luminescence spectra of CYP3A4 solubilized in 5X buffer at 17 °C. The blue curve is the UV/Vis absorption spectrum and the red curve is the luminescence spectrum for samples excited with a 408 nm laser. The red line with circles is the excitation spectrum monitored at 497 nm and the blue line with circles is the excitation spectrum monitored at 624 nm. The luminescence spectrum displays two bands, a broad luminescence centered at 497 nm and a highly structured luminescence starting at 624 nm. The relative quantum yields were measured against a degassed aqueous solution of [Ru(bpy)3]Cl2 and revealed a relatively weak overall luminescence (Φrel≈ 1.8×10⁻⁴). The green spectrum in Figure 1 depicts the laser induced luminescence spectrum of CYP3A4 excited with a 532 nm laser. Upon excitation at 532 nm, the luminescence intensity is much lower but the underlying vibrational progression beginning at 624 nm is still discernable. The excitation profiles from 408 nm – 434 nm roughly follow the absorption spectrum and are approximately independent of the monitoring wavelength. Full luminescence spectra excited at 400, 409, 418, 425, and 432 nm are presented as supplementary information (Figure S3A). The minor changes observed in these spectra as a function of wavelength are consistent with endogenous conformational / electronic states known to exist in CYP3A4. All spectroscopic parameters are listed in Table I.
Figure 1.
Absorption and luminescence spectra of CYP3A4 in phosphate buffer (9.7 μM). The blue curve is the absorption spectrum and the absorption maxima are given parenthesis. The maximum of the Soret absorption is labeled as such. Q1, and Q2 are peaks in the Q-band absorption. The red line with circles is the laser induced excitation spectrum monitored at 497 nm and the blue line with circles is the laser induced excitation spectrum monitored at 624 nm. The red curve is the luminescence spectrum of CYP3A4 excited at 408 nm and the luminescence maxima are given in parenthesis. 1S2 is the maximum luminescence intensity from the fluorescence band. υ′, υ″, υ‴, and υ″″ are the peaks of the vibrational progression from the phosphorescence band originating from 3T2 (see Figure 8). The green curve is the luminescence spectrum of CYP3A4 excited at 532 nm.
Table I.
Spectroscopic parameters measured for CYP3A4 and CYP2C9. All absorption and luminescence maxima were determined by taking the second derivative of the spectra in Figures 1 and 2. Quantum yields were measured relative to [Ru(bpy)3]Cl2 in deoxygenated water. Spectroscopic assignments are depicted in Figure 8.
| Absorption (nm) | Luminescence (nm) | Quantum Yield | |||||||
|---|---|---|---|---|---|---|---|---|---|
| Soret | Q1 | Q2 | 1S2 → gs | 3T2 → gs | Φ rel | ||||
| υ ′ | υ ″ | υ ‴ | υ ″ ″ | ||||||
| 3A4 | 418 | 535 | 573 | 497 | 624 | 645 | 668 | 692 | 1.79×10⁻⁴ |
| 2C9 | 416 | 533 | 571 | 511(543sh) | 624 | 645 | 665 | 688 | 1.21×10⁻⁴ |
Plotted in Figure 2 is the absorption spectrum (blue), laser induced excitation spectra (dotted lines), laser induced luminescence spectrum excited at 408 (red), and laser induced luminescence spectrum excited at 532 nm (green) of CYP2C9 in 5X buffer at 17 °C. The broad band is noticeably red shifted (maximum at 511 nm) in comparison to CYP3A4 (maximum at 497 nm) with a shoulder at 543 nm. The overall luminescence intensity is only marginally smaller (Φrel ≈ 1.2×10⁻⁴) than that observed for CYP3A4, with the broad band noticeably brighter and the structured band starting at 624 nm is noticeable weaker than observed for CYP3A4. The excitation profiles again roughly follow the absorption spectrum and are approximately independent of the wavelength in which the luminescence is monitored. Full luminescence spectra excited at 400, 409, 418, 425, and 432 nm are presented as supplementary information (Figure S3B). As with CYP3A4, the minor changes observed in CYP2C9 spectra as a function of wavelength are also consistent with endogenous conformational / electronic states known to exist.
Figure 2.
Absorption and luminescence spectra of CYP2C9 in phosphate buffer (3.5 μM). The blue curve is the absorption spectrum and the absorption maxima are given parenthesis. The maximum of the Soret absorptions is labeled as such. Q1, and Q2 are peaks in the Q-band absorption. The red line with circles is the laser induced excitation spectrum monitored at 511 nm and the blue line with circles is the laser induced excitation spectrum monitored at 624 nm. The red curve is the luminescence spectrum of CYP2C9 and the luminescence maxima are given in parenthesis. 1S2 is the maximum luminescence intensity from the fluorescence band. υ′, υ″, υ‴, and υ″″ are the peaks of the vibrational progression from the phosphorescence band originating from 3T2 (see Figure 8). The green curve is the luminescence spectrum of CYP2C9 excited at 532 nm.
3.2 Luminescence after reduction to Fe(II) by dithionite and heme degradation by CuOOH
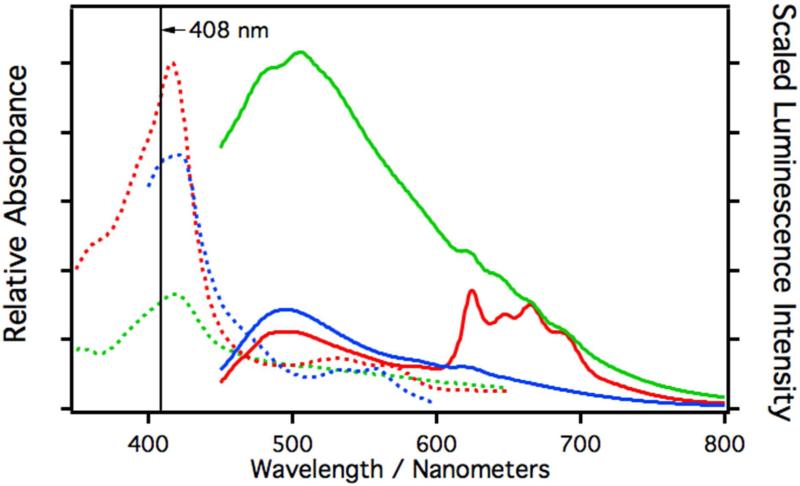
The resting state of iron in CYP3A4 and CYP2C9 is Fe(III). It is well known that small amounts of dithionite will reduce the heme iron to Fe(II).22 Reduction of ferric iron to ferrous iron will dramatically change the nature of any dd and MLCT states that lay close to the emitting ππ* states. This in turn will lead to changes in intersystem crossing and phosphorescence rates. If the blue luminescence arises from a 1ππ*→gs fluorescence and the structured luminescence from a 3ππ*→gs phosphorescence (both spin-orbit perturbed), then reduction of the heme will result in a change in the population of these two states. Depicted in Figure 3 is the absorption (dotted lines) and laser induced luminescence (solid) spectra of dithionite (blue) treated CYP3A4. In the ferrous state, the blue fluorescence is clearly enhanced in comparison with the structured luminescence, which was virtually eliminated. This is consistent with the assignment stated above. It is noted that the extinction coefficient at 408 nm (the excitation wavelength) is reduced by 21% in dithionite treated samples and the overall luminescence quantum yield was estimated to be Φrel≈1.4×10⁻⁴, which is close to the value measured for untreated CYP3A4 (Φrel≈1.8×10⁻⁴).
Figure 3.
Relative absorption and scaled luminescence spectra of CYP3A4 in phosphate buffer (9.7 μM). The luminescence spectra are scaled with respect to their measured relative quantum yields. The dashed curves are the absorption spectra and the solid curves are the luminescence spectra. The red curves are spectra of native CYP3A4, the blue curves are spectra of samples reduced with a small amount of dithionite, and the green curves are spectra of samples treated with CuOOH. All luminescence spectra were excited at 408 nm.
It is also well known that cumene hydroperoxide (CuOOH) will degrade the prosthetic heme into mono- and dipyrroles, which can irreversibly bind to the protein at the active site.23 Mono- and dipyrroles are highly fluorescent. If the luminescence originates from the heme moiety, it is expected that CuOOH degradation would result in the elimination of the native fluorescence with a concomitant grow-in of pyrrole fluorescence. CYP3A4 treated with CuOOH (green) results in a reduction of the absorption at 408 nm by about 66% but a 3-fold increase in the overall quantum yield to Φrel≈5.7×10⁻⁴ is also observed. Moreover, the blue luminescence broadens with a shoulder appearing at 483 nm and the structured luminescence is greatly reduced. This is consistent with the explanation that the luminescence originates from the heme moiety.
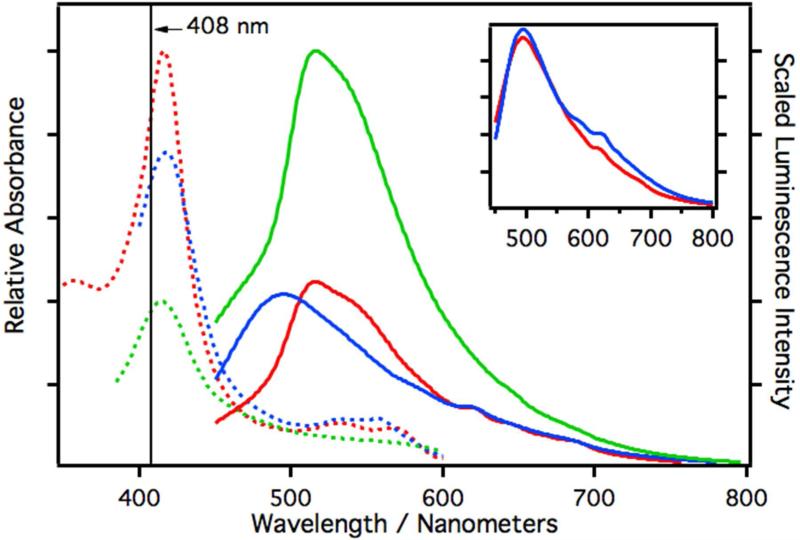
Similar trends are observed with CYP2C9 (Figure 4). The extinction coefficient at 408 nm is reduced by 19% in dithionite (blue) treated CYP2C9 samples and by 56% in CuOOH (green) treated samples. The relative quantum yield for dithionite treated samples was estimated to be Φrel≈1.3×10⁻⁴, which is close to that measured for untreated CYP2C9 (Φrel≈1.2×10⁻⁴). The relative quantum yield of CuOOH treated samples increases more than 2-fold to Φrel≈2.7×10⁻⁴. In reduced CYP2C9 samples the broad luminescence is shifted dramatically from 516 nm to 495 nm and the structured luminescence is visible but less pronounced. The inset in Figure 4 is an overlay of reduced CYP3A4 (red) and reduced CYP2C9 and shows that both give nearly identical luminescence spectra after reduction.
Figure 4.
Relative absorption and scaled luminescence spectra of CYP2C9 in phosphate buffer (3.5 μM). The luminescence spectra are scaled with respect to their measured relative quantum yields. The dashed curves are the absorption spectra and the solid curves are the luminescence spectra. The red curves are spectra of native CYP2C9, the blue curves are spectra of samples reduced with a small amount of dithionite, and the green curves are spectra of samples treated with CuOOH. All luminescence spectra were excited at 408 nm. The inset is an overlay of the scaled luminescence spectra of reduced CYP3A4 (red) and reduced CYP2C9 (blue).
3.3 Luminescence properties upon ligand binding in solubilized protein solutions
The structured luminescence in both CYP3A4 and CYP2C9 decreases with increasing ligand concentration. Plotted in Figure 5a are a series of difference spectra (luminescence) of CYP3A4 from 600 nm to 800 nm as a function of testosterone concentration. The integrated area under the difference spectra was determined and plotted vs. testosterone concentration to generate a non-saturating titration curve (Figure 5b). The results of this experiment agrees with the generally accepted model that multiple testosterones can bind to CYP3A4.29 Even though the curve was non-saturating and CYP3A4 is known to bind multiple testosterone molecules, the data was fit to a single-site binding equation (section 2.9) in order to compare the KS value to earlier KS values from absorption studies. The measured KS = 30.5 ± 6.5 μM compares well to the values measured by other authors.20, 30 Also depicted in Figure 5 are the difference spectra and titration curve vs. QC concentration. QC is a CYP3A4 and CYP2C9 inhibitor in the nanomolar range, but strong visible absorbance prevents spectral characterization.18, 25 QC saturates CYP3A4 above 1 μM and the curve fits well to a single-site ligand-binding model. The spectroscopic binding constant of QC on CYP3A4 is much stronger (KS = 0.20 ± 0.6 μM) than that observed with testosterone, and is close to the reported Ki (0.70 μM) using testosterone as substrate at saturating concentrations.25
Titrations of CYP2C9 with flurbiprofen and QC are depicted in Figure 6. The difference spectra show trends similar to that observed for CYP3A4. Both titration curves saturate and fit well to a single-site binding model as expected for CYP2C9. KS = 20.2 ± 1.1 μM for flurbiprofen associating with CYP2C9, which is similar to the value reported by Hutzler et al. (14.1 μM).31 The titration of CYP2C9 with QC gives a spectroscopic binding constant of KS = 0.11 ± 0.06 μM, which is close to the estimated Ki (0.03 μM) using diclofenac as substrate at saturating concentrations.18
3.4 Titration of CYP3A4 with testosterone within a lipid bilayer
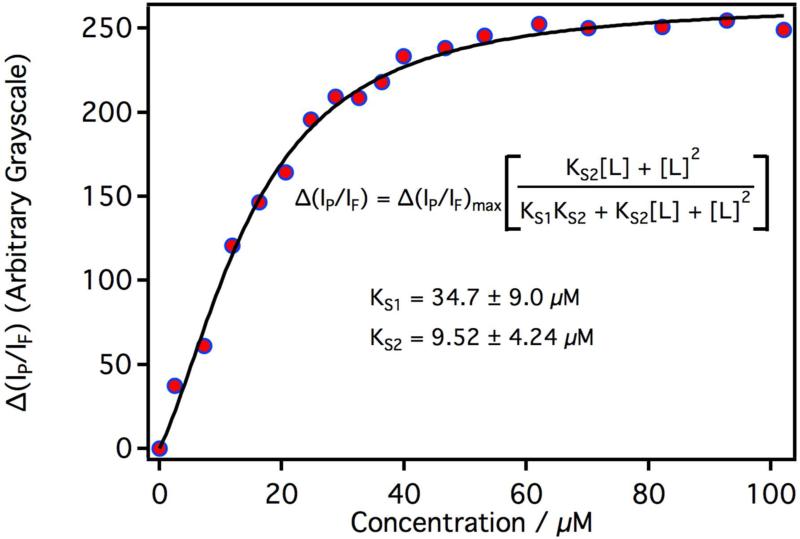
Plotted in Figure 7 is the titration curve of membrane bound CYP3A4 with testosterone. The data fits well to the consecutive two-site ligand binding model described in section 2.16. The first KS1 = 34.7 ± 9.0 μM, which is similar to that observed for solubilized CYP3A4 (sec 3.3). The second KS2 = 9.52 ± 4.24 μM and is close to that measured by Denisov et al. in nanodiscs.30 Attempts to fit the data to a single site model (sec 2.9), the multi-state Hill equation, or a model for testosterone independently binding to membrane bound and solubilized CYP3A4s were unsuccessful.
Figure 7.
Spectroscopic titration curve of CYP3A4 in a 1:1:1 DOPC:DLPC:DLPS (by wt.) planar lipid bilayer with increasing concentrations of testosterone.
4. Discussion
4.1 Dual anomalous luminescence assigned to a 1ππ*→gs and a 3ππ*→gs from the heme and intact protein
The results presented in this paper establish for the first time the native luminescence of two of the major human isoforms of Cytochrome P450; namely CYP3A4 and CYP2C9. The potential applications of this finding range from measuring the kinetics of substrate binding and turnover to the mapping of CYPs in membranes. The usefulness of the luminescence from CYP3A4 and CYP2C9 is demonstrated by the variation of their spectroscopic properties with substrate, and our ability to determine spectral dissociation constants both in solution and in lipid bilayers. While it is surprising that this luminescence has not been reported earlier, this can be explained by the relatively low observed quantum yields.
The luminescence properties of metalloporphyrins have been characterized since the 1960's by Gouterman and coworkers.32 In general, the luminescence spectra for porphyrins show two bands; a fluorescence that is Stokes shifted from the Q-bands (1S1→gs), and a weaker phosphorescence that is shifted further to the red and often displays a pronounced vibrational progression (3T1→gs). The excited state energy diagram for porphyrins and metalloporphyrins is fairly simple. The lowest excited singlet and triplet states are mostly ππ* in nature.32 In most open-shell metalloporphyrins, there is a high degree of spin orbital coupling resulting in the rapid conversion of the lowest 1ππ*excited state to a lower lying 3ππ* excited state through intersystem crossing. This causes a quenching of fluorescence and an increase in phosphorescence intensity.13, 33-34 An extreme example of this phenomenon is paramagnetic Ni(II) mesoporphyrin, which displays an intense phosphorescence between 680 and 725 nm, and no fluorescence.34 The fine structure of Ni(II) mesoporphyrin is similar to the one observed for the CYPs in this study.
Contrary to many metalloporphyrins, luminescence from an iron-porphyrin is controversial. Fe(II) and Fe(III)-porphyrins have been generally considered as “non-radiative”, since their luminescence is not detectable by ordinary means and they show mostly weak emissions with total quantum yields less than 10−4.13, 32 Harriman reported a quantum yield < 7×10⁻⁵ for Fe(III) mesoporphyrin at 77 K, whereas the reduced form is practically radiationless (< 10−5).35 The different electronic configurations, as well as the presence of high and low spin iron, offer the possibility of several non-radiative decay pathways.36 Despite these findings, some fluorescence yields (~4×10⁻⁶) have been reported for ferrocytochromes, such as Fe(II) cytochrome b5 and c.13,6 For example, upon excitation into the Soret absorption bands (416 nm and 425 nm) of ferrocytochrome c a broad emission is observed in the red region, which is Stokes shifted and roughly mirrors the Q-band absorption. This luminescence has been assigned to a 1S1→gs fluorescence. A second weak luminescence that is Stokes shifted from the Soret and lays at higher energy than the 1S1→gs fluorescence has also been observed in cytochrome c. This luminescence has been assigned to an anomalous 1S2→gs fluorescence in violation of Kasha's rule.14-15 While studying the mass transport properties of cytochrome P450 in lipid bilayers we noticed a long wavelength emission and set out to determine if the emission was from the protein and if it could be used for characterization of the protein.
Upon photoexcitation into the Soret or Q-band of the heme, CYP3A4 and CYP2C9 display two luminescence bands upon relaxation; one with a peak ~500 nm and a second structured luminescence from ~620-690 nm (see table I). Photoexcitation at 532 nm does not change the wavelength of the luminescence, although a decrease of both luminescence intensity and bandwidth is observed. Also the excitation spectra are independent of monitoring wavelength, which indicated that both broad and structured luminescence originate from the same molecular species (Figures 1 and 2).
A number of lines of evidence indicate that the observed luminescence results from the heme embedded in the intact protein and is not an artifact or emission from a different source. First, the excitation wavelengths for the fluorescent amino acids phenylalanine, tyrosine and tryptophan are at 257 nm, 275 nm and 280 nm respectively, thus the observed luminescence cannot be associated with intrinsic protein fluorescence. Second, the luminescence does not correspond to free protoporphyrin phosphorescence, which is located at much higher wavelengths (~785 nm).33 In addition, heat denaturation of the CYP3A4 and CYP2C9 at 50 °C leads to an order of magnitude reduction of the overall luminescence and the complete loss of the structured luminescence (data not shown) indicating a dependence on intact protein structure for the luminescence. Furthermore, both reduction and degradation of the heme significantly alter the emission spectra (Figure 3 & 4). Finally, the luminescence is altered by substrate binding to the heme. This leads to the conclusion that the heme luminescence is intrinsically linked to the structure of the protein surrounding it, its ligation, and suggests that the heme is in a protected environment.
In the CYP resting state, Fe(III) is hexacoordinated, with four nitrogens from the porphyrin, a sulfur from a cysteine on the proximal side of the heme, and a water on the distal side.1 Additionally, the heme is buried inside the protein globule which results in a more rigid electrostatic environment than a heme free in solution.1, 37 Thus, inside the protein globule, radiationless deactivation pathways are reduced and quantum yields become large enough for luminescence to be observed with laser excitation and single photon counting detectors. For example, inside the protein there is no solvent rearrangement upon photoexcitation and there is reduced vibrational coupling with water. Moreover, fluorescence photobleaching is greatly reduced in CYP3A4 and CYP2C9 even after 1 hour of light exposure (data not shown).
Thus the protected environment of the heme coupled with sensitive instrumentation allow for the assignment of the luminescence. The broad luminescence centered at ~500 nm is Stokes shifted from the Soret and is at lower wavelengths than the Q-band absorptions (see Table I). The structured luminescence does not mirror the Q-band absorption, but displays a structured luminescence that is typically observed from a 3ππ* phosphorescence. Given these spectral characteristics, along with other published spectral observations for cytochrome c and cytochrome b5, and the fact that Fe(III) will enhance intersystem crossing rates, we have tentatively assigned the broad luminescence at ~500 nm to a 1ππ*→gs fluorescence and the structured luminescence above 600 nm to a 3ππ*→gs phosphorescence; neither of which are associated with the Q-band and are in violation of Kasha's rule (1S2→gs and 3T2→gs respectively). At first this seems highly unlikely, however, there are a few cases in which porphyrins are known to violate Kasha's rule and the data best fits this assertion.38-39 Though not observed in this study, it is likely that there is a weak fluorescence that is Stokes shifted from the Q-band as observed for cytochrome c and cytochrome b5, but it would have to be weak in comparison with the anomalous fluorescence and phosphorescence observed in this study. A phenomenological state diagram is depicted in Figure 8.
Figure 8.
Proposed phenomenological excited state diagram and spectroscopic assignments for CYP3A4 and CYP2C9 excited a 408 nm. At 408 nm absorption is into the Soret band. The luminescence at about 500 nm is assigned to a 1ππ*→gs fluorescence from the Soret in violation of Kasha's rule. The structured luminescence is assigned to a 3ππ*→gs phosphorescence with the same orbital parentage as the Soret.
4.2 Changes in phosphorescence with ligand binding give titration curves
The addition of a substrate will quench the phosphorescence. This is the most convincing evidence for heme luminescence and exemplifies the utility of native luminescence for the study of CYP3A4 and CYP2C9. Titration curves generated from changes in phosphorescence intensity vs. substrate concentration give KS values statistically identical to literature values using heme absorption data (monitored evaluating the high spin/low spin shift in the Soret). Interestingly, this work shows that both type I and II binders decrease the phosphorescence intensity presumably by radiationless quenching. The advantages of using P450 native luminescence are well exemplified by titration with QC, a P450 inhibitor, which has strong absorbance in the visible region that prevents spectral characterization.18, 25
It is very difficult to measure absorption spectra within lipid bilayers, but it is relatively straightforward to measure changes in luminescence intensity using a standard fluorescence microscope and a CCD camera. The native fluorescence and phosphorescence from CYP3A4 were easily measured using luminescence microscopy and produced a convincing sequential two state binding curve for testosterone with KS values in close agreement with published studies using lipid nanodiscs.40 Further studies using an intensified CCD camera and luminescence spectral imaging are underway in order to fully explore the luminescence properties of CYP3A4 and CYP2C9 incorporated into lipid bilayers.
4.3 Alternate assignments for the observed luminescence
Protein Associated Flavin
While excitation spectra suggest that both the structured and broad blue luminescence bands originate from the same species, it is possible that the blue band may originate from a minor impurity that possesses a high fluorescent quantum yield. In fact, it has been suggested that the broad blue luminescence may come from a protein associated flavin contaminate. This is a reasonable assertion because flavins are well known to fluoresce strongly in the 520 nm region (~10 – 20 nm further in the red than observed for the CYPs in this study).41
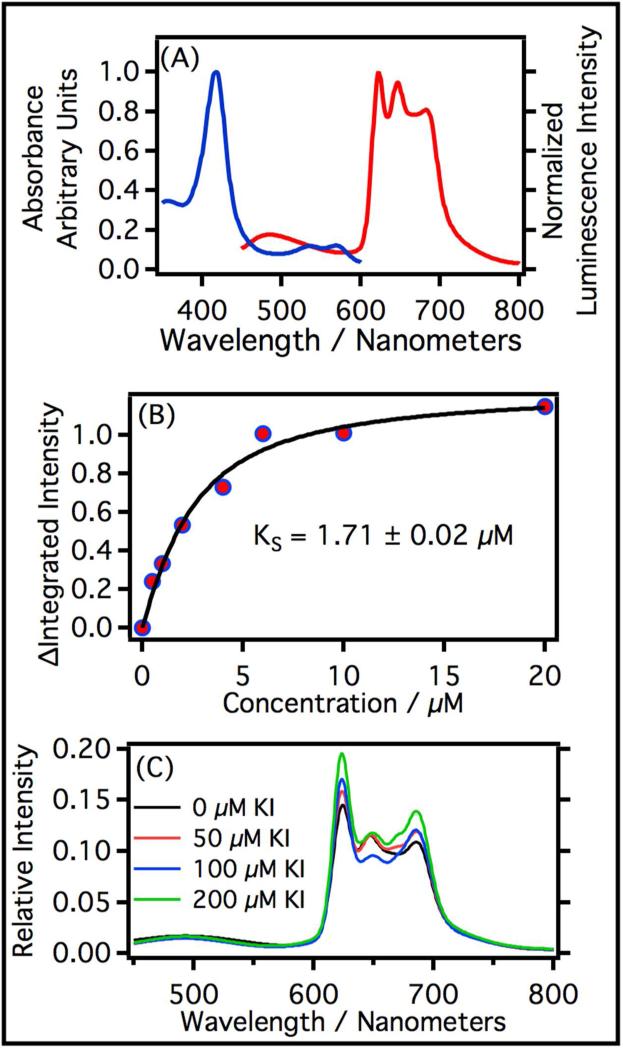
In order to test the hypothesis that protein associated flavins could be the origin of the broad blue fluorescence, an analogous control experiment using P450cam was carried out. P450cam is a water-soluble P450 enzyme that has much less propensity for flavin association in comparison to membrane bound CYP3A4 and CYP2C9 proteins. The luminescence spectrum of P450cam is depicted in Figure 9(a) and clearly shows both the broad fluorescence and structured phosphorescence seen in CYP3A4 and CYP2C9; the spectrum remains unchanged even after 24 hours of dialysis. Moreover, the change in luminescence intensity as a function of camphor concentration gave a value for KS = 1.7 μM (Figure 9(b)) which is consistent with literature values (KS = 1.6 – 2.6 μM, depending on the stereoisomer used). 42 Note: Camphor is the natural substrate for P450cam. This evidence along with the excitation spectra suggesting that the luminescence in all regions of the spectrum originates from a single heme species (Figures 1 and 2) leads us to conclude that both the broad blue luminescence and structured red luminescence originates from the same heme moiety embedded inside the protein.
Figure 9.
(a) Absorption and luminescence spectra of P450cam in phosphate buffer (30.1 μM). The blue curve is the absorption spectrum. The red curve is the luminescence spectrum of P450cam excited at 408 nm. (b) Spectroscopic titration curve of P450cam with camphor. The black line is a fit of the data using the equation given in section 2.9. (c) Heavy element effect on phosphorescence. Spectra of P450cam at increasing concentrations of KI (0 μM, 50 μM, 100 μM, and 200 μM).
Possible Assignment of the Structure Red Luminescence as being a 1S1→gs Fluorescence
The structured luminescence beginning at 624 nm has been tentatively assigned to a 3T2→gs phosphorescence. This assignment was made based on the fact that it does not mirror the Q-band absorption and it possesses vibrational structure that is similar to that observed in other metal-porphyrins phosphorescence measurements. But it is possible that the structured luminescence is a 1S1→gs fluorescence originating from the lowest-lying singlet excited state in accordance with Kasha's rule. The main argument against this assignment has been that the 0-0 band in the absorption spectra (Q2) and the 0-0 band in the luminescence spectra (ν′) are shifted 1426 cm−1 -1490 cm−1 from one another. This is quite large for a 1ππ*→gs fluorescence but too small of a shift to be a phosphorescence from the Q-band. A more convincing argument for assigning the 624 nm band to a phosphorescence comes from the introduction of a heavy atom such as I−. It is well known that the addition of heavy atoms increase spin-orbit coupling in a system and enhances phosphorescence quantum yields. With this in mind, KI was added to P450cam samples while holding the ionic strength constant. The structured luminescence of P450cam increased with increasing KI concentration giving strong evidence for triplet state emission (Figure 9C). These observations along with the well-resolved nature of the red luminescence makes it likely that it is a phosphorescence rather than a fluorescence and that it originates from the 3T2 excited state.
5. Conclusions
The major conclusion from this study is that CYP3A4, CYP2C9, and P450cam all luminesce from excited states centered on the heme when in solution and when incorporated into lipid bilayers. The data show at least two luminescence bands; both of which violate Kasha's rule. The first has been tentatively assigned to a fluorescence that is Stokes shifted from the Soret-band. The second is assigned to a phosphorescence band based on the fact that it displays a highly resolved vibrational fine structure that is not the mirror image of the Q-band absorption, but does resemble the phosphorescence vibrational fine structure of other metalloporphyrins. It was also observed that the phosphorescence band is quenched by ligands that will complex to the heme and produces binding curves and KS values that are statistically identical to those reported in the literature. The phosphorescence properties of CYP3A4 were measured in a lipid bilayer and the change in phosphorescence intensity as a function of testosterone concentration gave a binding curve that could only be fit with a sequential two ligand-binding model with KS values, consistent with what is known for CYP3A4 in lipid nanodiscs.
Supplementary Material
ACKNOWLEDGMENTS
This work was supported in part by NIH grant NIGMS grant GM110790 (jpj).
Footnotes
Author Contributions
The manuscript was written through contributions of all authors. All authors have given approval to the final version of the manuscript.
Supporting Information. Included is membrane characterization data, including fluorescence recovery after photo bleaching and data from fluorescence correlation spectroscopy. Also included is raw luminescence data before manipulation such as background subtraction. This material is available free of charge via the Internet at http://pubs.acs.org.
References
- 1.De Montellano PRO. Cytochrome P450: Structure, Mechanism, and Biochemistry. Springer; 2005. [Google Scholar]
- 2.Denisov IG, Makris TM, Sligar SG, Schlichting I. Structure and Chemistry of Cytochrome P450. Chem. Rev. 2005;105:2253–2278. doi: 10.1021/cr0307143. [DOI] [PubMed] [Google Scholar]
- 3.Porter TD. The Roles of Cytochrome B5 in Cytochrome P450 Reactions. J. Biochem. Mol. Toxicol. 2002;16:311–316. doi: 10.1002/jbt.10052. [DOI] [PubMed] [Google Scholar]
- 4.Kurabayashi Y, Kikuchi K, Kokubun H, Kaizu Y, Kobayashi H. S2 -> S0 Fluorescence of Some Metallotetraphenylporphyrins. J. Phys. Chem. 1984;88:1308–1310. [Google Scholar]
- 5.Liu X, Yeow EK, Velate S, Steer RP. Photophysics and Spectroscopy of the Higher Electronic States of Zinc Metalloporphyrins: A Theoretical and Experimental Study. Phys. Chem. Chem. Phys. 2006;8:1298–1309. doi: 10.1039/b516042a. [DOI] [PubMed] [Google Scholar]
- 6.Velate S, Liu X, Steer RP. Does the Radiationless Relaxation of Soret-Excited Metalloporphyrins Follow the Energy Gap Law? Chem. Phys. Lett. 2006;427:295–299. [Google Scholar]
- 7.Tripathy U, Kowalska D, Liu X, Velate S, Steer RP. Photophysics of Soret-Excited Tetrapyrroles in Solution. I. Metalloporphyrins: Mgtpp, Zntpp, and Cdtpp. J. Phys. Chem. A. 2008;112:5824–5833. doi: 10.1021/jp801395h. [DOI] [PubMed] [Google Scholar]
- 8.Liu X, Tripathy U, Bhosale SV, Langford SJ, Steer RP. Photophysics of Soret-Excited Tetrapyrroles in Solution. Ii. Effects of Perdeuteration, Substituent Nature and Position, and Macrocycle Structure and Conformation in Zinc (Ii) Porphyrins. J. Phys. Chem. A. 2008;112:8986–8998. doi: 10.1021/jp804792x. [DOI] [PubMed] [Google Scholar]
- 9.Maiti M, Danger BR, Steer RP. Photophysics of Soret-Excited Tetrapyrroles in Solution. Iv. Radiationless Decay and Triplet– Triplet Annihilation Investigated Using Tetraphenylporphinato Sn (Iv). J. Phys. Chem. A. 2009;113:11318–11326. doi: 10.1021/jp906966h. [DOI] [PubMed] [Google Scholar]
- 10.Ghiggino KP, Giri NK, Hanrieder J, Martell JD, Müller J, Paige MF, Robotham B, Szmytkowski J, Steer RP. Photophysics of Soret-Excited Tin (Iv) Porphyrins in Solution. J. Phys. Chem. A. 2013;117:7833–7840. doi: 10.1021/jp406025j. [DOI] [PubMed] [Google Scholar]
- 11.Strickler S, Berg RA. Relationship between Absorption Intensity and Fluorescence Lifetime of Molecules. J. Chem. Phys. 1962;37:814–822. [Google Scholar]
- 12.Sorgues S, Poisson L, Raffael K, Krim L, Soep B, Shafizadeh N. Femtosecond Electronic Relaxation of Excited Metalloporphyrins in the Gas Phase. J. Chem. Phys. 2006;124:114302–114302. doi: 10.1063/1.2176612. [DOI] [PubMed] [Google Scholar]
- 13.Adar F, Gouterman M, Aronowitz S. Fluorescence, Resonance Raman, and Radiationless Decay in Several Hemoproteins. J. Phys. Chem. 1976;80:2184–2191. [Google Scholar]
- 14.Champion PM, Lange R. On the Quantitation of Light Emission from Cytochrome C in the Low Quantum Yield Limit. J. Chem. Phys. 1980;73:5947–5957. [Google Scholar]
- 15.Champion PM, Perreault G. Observation and Quantitation of Light Emission from Cytochrome C Using Soret Band Laser Excitation. J. Chem. Phys. 1981;75:490–491. [Google Scholar]
- 16.Davydov DR, Davydova NY, Sineva EV, Kufareva I, Halpert JR. Pivotal Role of P450-P450 Interactions in Cyp3a4 Allostery: The Case of Alpha-Naphthoflavone. Biochem. J. 2013;453:219–230. doi: 10.1042/BJ20130398. [DOI] [PMC free article] [PubMed] [Google Scholar]
- 17.Reed JR, Connick JP, Cheng D, Cawley GF, Backes WL. Effect of Homomeric P450-P450 Complexes on P450 Function. Biochem. J. 2012;446:489–497. doi: 10.1042/BJ20120636. [DOI] [PMC free article] [PubMed] [Google Scholar]
- 18.Peng C-C, Cape JL, Rushmore T, Crouch GJ, Jones JP. Cytochrome P450 2C9 Type II Binding Studies on Quinoline-4-Carboxamide Analogues. J. Med. Chem. 2008;51:8000–8011. doi: 10.1021/jm8011257. [DOI] [PMC free article] [PubMed] [Google Scholar]
- 19.Shimoji M, Yin HQ, Higgins LA, Jones JP. Design of a Novel P450: A Functional Bacterial-Human Cytochrome P450 Chimera. Biochemistry. 1998;37:8848–8852. doi: 10.1021/bi972775z. [DOI] [PubMed] [Google Scholar]
- 20.Roberts AG, Campbell AP, Atkins WM. The Thermodynamic Landscape of Testosterone Binding to Cytochrome P450 3A4: Ligand Binding and Spin State Equilibria. Biochemistry. 2005;44:1353–1366. doi: 10.1021/bi0481390. [DOI] [PubMed] [Google Scholar]
- 21.French KJ, Strickler MD, Rock DA, Rock DA, Bennett GA, Wahlstrom JL, Goldstein BM, Jones JP. Benign Synthesis of 2-Ethylhexanoic Acid by Cytochrome P450cam: Enzymatic, Crystallographic, and Theoretical Studies. Biochemistry. 2001;40:9532–9538. doi: 10.1021/bi010063+. [DOI] [PubMed] [Google Scholar]
- 22.Schenkman JB, Jansson I. Spectral Analyses of Cytochromes P450. Methods Mol. Biol. 2006;320:11–18. doi: 10.1385/1-59259-998-2:11. [DOI] [PubMed] [Google Scholar]
- 23.He K, Bornheim LM, Falick AM, Maltby D, Yin H, Correia MA. Identification of the Heme-Modified Peptides from Cumene Hydroperoxide-Inactivated Cytochrome P450 3A4. Biochemistry. 1998;37:17448–17457. doi: 10.1021/bi9808464. [DOI] [PubMed] [Google Scholar]
- 24.Van Houten J, Watts R. Temperature Dependence of the Photophysical and Photochemical Properties of the Tris (2, 2'-Bipyridyl) Ruthenium (Ii) Ion in Aqueous Solution. J. Am. Chem. Soc. 1976;98:4853–4858. [Google Scholar]
- 25.Dahal UP, Joswig-Jones C, Jones JP. Comparative Study of the Affinity and Metabolism of Type I and Type Ii Binding Quinoline Carboxamide Analogues by Cytochrome P450 3A4. J. Med. Chem. 2012;55:280–290. doi: 10.1021/jm201207h. [DOI] [PMC free article] [PubMed] [Google Scholar]
- 26.Segel IH. Enzyme Kinetics. Vol. 360. Wiley; New York: 1975. [Google Scholar]
- 27.Shaw PM, Hosea NA, Thompson DV, Lenius JM, Guengerich FP. Reconstitution Premixes for Assays Using Purified Recombinant Human Cytochrome P450, Nadph-Cytochrome P450 Reductase, and Cytochrome B5. Arch. Biochem. Biophys. 1997;348:107–115. doi: 10.1006/abbi.1997.0378. [DOI] [PubMed] [Google Scholar]
- 28.Kumud RP, Jeffrey PJ, James AB. Lipid-Proteins Interactions. Vol. 974. Humana Press; 2013. A Guide to Tracking Single Transmembrane Proteins in Supported Lipid Bilayers. pp. 233–252. [DOI] [PubMed] [Google Scholar]
- 29.Korzekwa KR, Krishnamachary N, Shou M, Ogai A, Parise RA, Rettie AE, Gonzalez FJ, Tracy TS. Evaluation of Atypical Cytochrome P450 Kinetics with Two-Substrate Models: Evidence That Multiple Substrates Can Simultaneously Bind to Cytochrome P450 Active Sites. Biochemistry. 1998;37:4137–4147. doi: 10.1021/bi9715627. [DOI] [PubMed] [Google Scholar]
- 30.Denisov IG, Baas BJ, Grinkova YV, Sligar SG. Cooperativity in Cytochrome P450 3A4. Linkages in Substrate Binding, Spin State, Uncoupling, and Product Formation. J. Biol. Chem. 2007;282:7066–7076. doi: 10.1074/jbc.M609589200. [DOI] [PubMed] [Google Scholar]
- 31.Hutzler JM, Wienkers LC, Wahlstrom JL, Carlson TJ, Tracy TS. Activation of Cytochrome P4502c9-Mediated Metabolism: Mechanistic Evidence in Support of Kinetic Observations. Arch. Biochem. Biophys. 2003;410:16–24. doi: 10.1016/s0003-9861(02)00665-3. [DOI] [PubMed] [Google Scholar]
- 32.Gouterman M. Spectra of Porphyrins. J. Mol. Spectrosc. 1961;6:138–163. [Google Scholar]
- 33.Gouterman M, Khalil G-E. Porphyrin Free Base Phosphorescence. J. Mol. Spectrosc. 1974;53:88–100. [Google Scholar]
- 34.Allison JB, Becker RS. Effect of Metal Atom Perturbations on the Luminescent Spectra of Porphyrins. J. Chem. Phys. 1960;32:1410–1417. [Google Scholar]
- 35.Harriman A. Luminescence of Porphyrins and Metalloporphyrins. Part 2.—Copper (Ii), Chromium (Iii), Manganese (Iii), Iron (Ii) and Iron (Iii) Porphyrins. J. Chem. Soc., Faraday Trans. 1981;77:369–377. [Google Scholar]
- 36.Gouterman M, Rentzepis P, Straub K. ACS Symp. Ser. ACS; Washington: 1986. In Porphyrins: Excited States and Dynamics. [Google Scholar]
- 37.Denisov IG, Shih AY, Sligar SG. Structural Differences between Soluble and Membrane Bound Cytochrome P450s. J. Inorg. Biochem. 2012;108:150–158. doi: 10.1016/j.jinorgbio.2011.11.026. [DOI] [PMC free article] [PubMed] [Google Scholar]
- 38.Steer RP. Concerning Correct and Incorrect Assignments of Soret (S 2–S 0) Fluorescence in Porphyrinoids: A Short Critical Review. Photochem. Photobiol. Sci. 2014;13:1117–1122. doi: 10.1039/c4pp00122b. [DOI] [PubMed] [Google Scholar]
- 39.Kurabayashi Y, Kikuchi K, Kokubun H, Kaizu Y, Kobayashi H. S2. Fwdarw. S0 Fluorescence of Some Metallotetraphenylporphyrins. J. Phys. Chem. 1984;88:1308–1310. [Google Scholar]
- 40.Denisov IG, Sligar SG. Cytochromes P450 in Nanodiscs. Biochim. Biophys. Acta: Proteins Proteomics. 2011;1814:223–229. doi: 10.1016/j.bbapap.2010.05.017. [DOI] [PMC free article] [PubMed] [Google Scholar]
- 41.Shumyantseva VV, Bulko TV, Petushkova NA, Samenkova NF, Kuznetsova GP, Archakov AI. Fluorescent Assay for Riboflavin Binding to Cytochrome P4502b4. J. Inorg. Biochem. 2004;98:365–370. doi: 10.1016/j.jinorgbio.2003.10.024. [DOI] [PubMed] [Google Scholar]
- 42.Kadkhodayan S, Coulter ED, Maryniak DM, Bryson TA, Dawson JH. Uncoupling Oxygen Transfer and Electron Transfer in the Oxygenation of Camphor Analogues by Cytochrome P450-Cam Direct Observation of an Intermolecular Isotope Effect for Substrate Ch Activation. J. Biol. Chem. 1995;270:28042–28048. doi: 10.1074/jbc.270.47.28042. [DOI] [PubMed] [Google Scholar]
Associated Data
This section collects any data citations, data availability statements, or supplementary materials included in this article.


