

Abstract
Cancer surveillance data are collected every year in the United States via the National Program of Cancer Registries (NPCR) and the Surveillance, Epidemiology and End Results (SEER) Program of the National Cancer Institute (NCI). General trends are closely monitored to measure the nation's progress against cancer. The objective of this study was to apply a novel web informatics approach for enabling fully automated monitoring of cancer mortality trends. The approach involves automated collection and text mining of online obituaries to derive the age distribution, geospatial, and temporal trends of cancer deaths in the US. Using breast and lung cancer as examples, we mined 23,850 cancer-related and 413,024 general online obituaries spanning the timeframe 2008–2012. There was high correlation between the web-derived mortality trends and the official surveillance statistics reported by NCI with respect to the age distribution (ρ = 0.981 for breast; ρ = 0.994 for lung), the geospatial distribution (ρ = 0.939 for breast; ρ = 0.881 for lung), and the annual rates of cancer deaths (ρ = 0.661 for breast; ρ = 0.839 for lung). Additional experiments investigated the effect of sample size on the consistency of the web-based findings. Overall, our study findings support web informatics as a promising, cost-effective way to dynamically monitor spatiotemporal cancer mortality trends.
Keywords: Web informatics, Web mining, Digital epidemiology, Cancer mortality, Breast cancer, Lung cancer
1. Introduction
Cancer is considered a major public health concern and cancer-related statistics are monitored closely by the Centers for Disease Control and Prevention (CDC) via its National Program of Cancer Registries (NPCR) and the National Center for Health Statistics (NCHS) [1]. Every year cancer incidence, prevalence, and mortality rates are examined carefully for each cancer type. Cancer statistics are typically reported by state, gender, race/ethnicity, and age in a Report to the Nation on the Status of Cancer that is produced annually by the CDC and the National Cancer Institute (NCI), in collaboration with the North American Association of Central Cancer Registries (NAACCR) [2]. Careful collection and analysis of such data are critical since observed trends can be used to measure the impact of new screening and treatment discoveries and cancer control policies across all segments of the US population. For example, a steady decline in cancer mortality would support existing cancer prevention policies while increases in cancer prevalence would suggest that new prevention policies maybe necessary. Surveillance statistics are published with 3–4 years delay due to the manual effort required for careful aggregation and analysis of the high quality data collected from all cancer registries across the US. Therefore, the numbers of new cancer cases and deaths estimated annually by the American Cancer Society are based on somewhat outdated surveillance data. For example, the 2015 estimates used surveillance data from 2007–2011 [2].
We propose to study whether changes in cancer statistics such as mortality rates can be captured reliably in a time- and cost-efficient way by mining content that is openly available on the Internet. Mining of online content has led to a wide range of health applications such as disease outbreak prediction and surveillance (e.g. influenza), personalized dissemination of health information, assessment of disparities in health information availability, effectiveness monitoring of health marketing campaigns, and better understanding of interactions among physicians, patients, and clinical researchers (e.g. [3–7]). Aggregating and exploring publicly accessible content on the Internet has emerged as an alternative yet powerful way of data collection and analytics that drives much innovation in public health surveillance (“info-veillance”) and epidemiology (“info-demiology”) for both infectious and chronic conditions (e.g. [8–14]). Several studies on researching and analyzing online contents for health-related applications show that this emerging approach can lead to valuable information and produce reliable findings similar to those derived from traditional methods such as observational studies, randomized controlled trials or clinical reporting [15–18]. Web 1.0 and Web 2.0 have been steadily transforming the landscape of clinical and epidemiological research with respect to monitoring disease trends, health behaviors, practices, and outcomes.
This new approach of information acquisition can be particularly advantageous for epidemiological discoveries that require time-consuming data collection and curation, such as in cancer, a long latency disease [19,20]. In this study we aimed to harness the World-Wide Web for cancer deaths surveillance and evaluate to what extent the discovered trends are consistent with official cancer statistics. The paper is organized as follows. The data sources and methods are discussed in Section 2, including the overall approach (Section 2.1), data collection (Section 2.2), text mining (Section 2.3), and statistical analysis (Section 2.4). Detailed results are presented in Section 3 for two use cases, namely breast (Section 3.1) and lung cancer (Section 3.2). This section also compares and contrasts the discovered trends with the official CDC reports. The effect of sample size on the reliability of discovered trends is discussed in Section 3.3. Study findings, broader implications, and limitations are discussed in Section 4.
2. Data sources and methods
2.1. Overview
The main objective of this study was to derive cancer mortality trends using web mining. Mortality describes the number of individuals who died from the disease at a given time frame. Cancer mortality is usually expressed as the number of deaths due to cancer per 100,000 population. For instance, between 2005 and 2009 the age-adjusted mortality rates among females in the US was 23 for breast cancer and 39.6 for lung cancer respectively [21]. The reported cancer mortality rates varied substantially among the states; from 17.8 (Hawaii) to 26.3 (Louisiana) for breast cancer and from 16.1 (Utah) to 55.5 (Kentucky) for lung cancer [21].
To study cancer mortality trends from online content, we mined openly available obituary announcements and articles from digital sources such as the websites of US newspapers, funeral homes, and social media sites. Such material is widely available on the Internet. Typically obituaries include content regarding a person's place, time, and often cause of death. Furthermore, the standardized language of obituary announcements enables automatic text parsing. By collecting such online data through web crawling technology and then applying tailored natural language processing techniques, we derived the age distribution and spatiotemporal variations of cancer deaths in the US and compared them with the official cancer surveillance reports. Since breast cancer and lung cancer are two very common cancers [2], they served as our case studies.
2.2. Data collection
The Oak Ridge Site-Wide Institutional Review Board (IRB) performed expedited review and deemed the study exempt.
To collect suitable online obituaries, we used an advanced web crawler developed in our laboratory [22]. The crawling phase targeted obituaries and death announcements published between 2008 and 2012, the most recent timeframe for which official US cancer mortality statistics are available [21]. Although the technical details of our web crawler are provided in [22] and the crawling process for obituary collection has been described in a separate study published previously by our investigation team [18], the following is a brief description of the general workflow.
The crawler employs an intelligent, self-adaptive mechanism to search the broad Internet for relevant obituary articles. For this study, the search focused on obituaries including the keywords “breast cancer” and “lung cancer”. In its startup phase, the web crawler executes a collection of seed queries using a third-party commercial search engine to initialize its running. The seed query searched for obituaries of a given cancer type and US state, e.g., “lung cancer obituaries, New York.” In total, 100 such queries (2 cancer types × 50 US States) were executed and the URL search results of the queries served as the initial crawling seeds for our adaptive crawler. In the subsequent execution phase, the web crawler dynamically and selectively acquires online content matching the given information collection need. Meanwhile, the crawler continuously measures the relevance of each crawled web-page or URL embedded in the webpage with respect to the information collection need. For relevance verification the crawler uses a two-step ranking process.
The second step involved relevance verification of the crawled webpages and URLs embedded in these webpages. For relevance verification the crawler uses a two-step classification process. First, an autonomous utility score estimator is applied to eliminate unrelated webpages. The utility score estimator is developed based on a supervised machine learning method, which is trained with manually selected positive and negative training examples. Specifically, 600 webpages with cancer-related obituaries constituted the positive examples while 1820 unrelated webpages constituted negative examples for the training phase. Then, a second relevance verification step is applied to identify crawled webpages that represent full-length obituaries. This step also employed a supervised classification algorithm to remove irrelevant content such as obituaries index pages or obituary snippets. For this step, the classifier is trained with 100 manually selected positive examples (i.e., full-length obituaries and death notices) and 417 manually selected negative examples (i.e., obituary lists and snippets). Both relevance verification classifiers were implemented leveraging the Gaussian Random Processes provided by the WEKA package [23]. The classifiers were optimized empirically using 10-fold cross-validation sampling on the manually labeled data available for each classifier (i.e., in total 2420 examples for the first one and 517 examples for the second one). The first classifier achieved an F-score of 0.87 (precision = 0.99, recall = 0.77) and the second verification classifier achieved an F-score of 0.88 (precision = 0.80, recall = 0.99) based on 10-fold cross-validation on their respective development set. Upon completion of the optimization stage, both classifiers were trained using the full dataset available for each one respectively.
The crawling process was performed on a dedicated PC with 16 GB of RAM and 4 TB hard drive connected through a full-duplex gigabit Ethernet. It lasted for 8 weeks and it was terminated when the harvest rate for both cancer types declined significantly. The collected data included 107,772 obituaries, 57,293 with “breast cancer” and 50,429 with “lung cancer”.
2.3. Text parsing
We applied the Stanford Natural Language Processing (NLP) Library [24] with additional heuristic rules to analyze the text content of the collected obituaries and extract the necessary pieces of information: gender, age at death, cause of death, and location at death of the deceased person. Specifically, we applied the sentence splitting module to identify breaking sentences, the part-of-speech tagging module to identify gender-related pronouns, and the named entity recognition and co-reference resolution modules to identify people's names, geographical locations, and expressions of date and time. Then, we selected all obituaries for which the gender, age at death, cause of death, and location at death of the deceased person could be inferred.
Gender was inferred according to the prevalence of gender-related pronouns in the obituary. Age was derived either from explicit statements or inferred from dates of birth and death that are often provided in an obituary. Breast or lung cancer was considered the cause of death if there was an explicit statement such as “She passed away after a lengthy battle with breast cancer…”. If such statement did not appear in the text content, we followed a three-step process. First, we filtered out obituary text that included the keyword “cancer” along with statements related to donations such as “In lieu of flowers,…”, “Donations of sympathy…”. Second, we filtered out text with phrases implying that the deceased person was a cancer survivor (e.g., “she was a breast cancer survivor”, or “surviving breast cancer”). If the remaining text contained the keyword “breast cancer” or “lung cancer”, the cause of death was considered to be the cancer type of interest. The location of death was derived either from explicit statements (e.g., “She passed away at Columbus, OH…”) or inferred from the location of the funeral home which is often provided in an obituary. Obituaries for which age, gender, cause, or location of death could not be inferred were excluded from the study. Since obituaries of the same individual may appear on several online publications, we implemented an additional analysis step to eliminate duplicates. The matching criterion applied for this elimination step was based on the deceased's name and age. For each obituary, the year was derived firstly from date of death, or from date of funeral if the date of death was not explicitly stated. Obituaries with inferred year of death before 2008 or after 2012, or for which the year of death could not be inferred were excluded from the study.
Text parsing was executed on the Titan supercomputer of the Oak Ridge Leadership Computing Facility utilizing approximately 13,490 core hours. Fig. 1 provides a schematic illustration of the obituary collection process and relevant statistics at each stage of the process. In total, 23,850 obituaries were collected with all necessary pieces of information. Of those, there were 12,716 with breast cancer (all females) and 11,134 with lung cancer (4529 females and 6605 males).
Fig. 1.
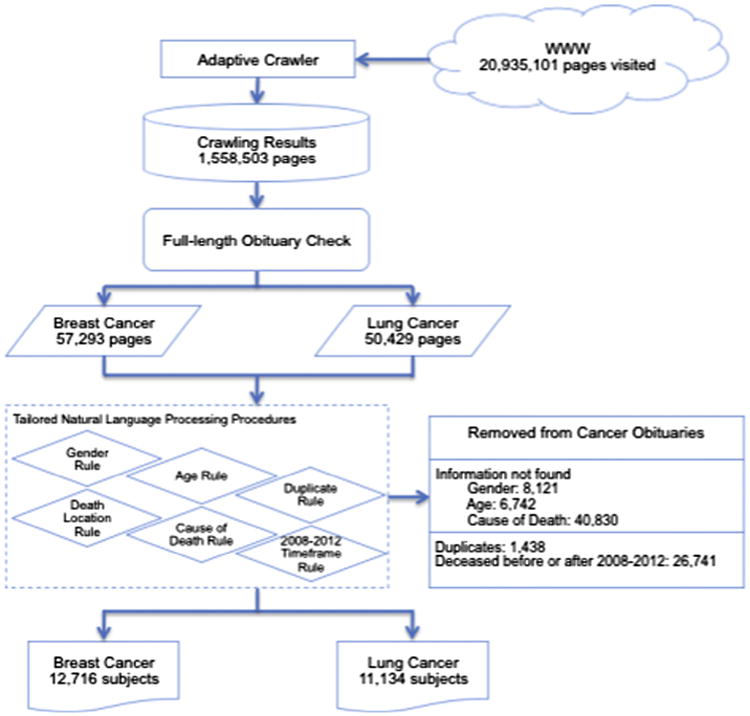
Workflow illustration of the obituary collection process.
In addition, separate crawling and text parsing were conducted to collect general (non-cancer) obituaries for the same timeframe 2008–2012. There were 413,024 general obituaries collected (203,915 females, 209,109 males). These obituaries were used to derive temporal trends related to the cancer death rates in the US.
2.4. Statistical analysis
The data analysis step generated three types of statistical reports, namely the distribution of cancer deaths by (i) age, (ii) state, and (iii) year. The same analysis was done for breast cancer and lung cancer separately. For breast cancer, the analysis was done for females strictly, due to lack of obituaries mentioning breast cancer for males. For lung cancer, statistical reports were prepared separately for males and females. Age distributions of breast and lung cancer deaths were derived for the 5-year time-frame 2008–2012 and compared with the official US mortality statistics provided in [21]. Age was binned in 8 groups (<20, 20–34, 35–44, 45–54, 55–64, 65–74, 75–84, and >85) similar to the official reports. Geospatial distributions of cancer deaths were derived for the same 5-year period for each US state. Annual rates of cancer-related deaths were also derived for the period 2008–2012 and compared with the official breast and lung cancer mortality rates provided in [21]. Web-derived trends were compared to official surveillance statistics using Spearman's correlation coefficient.
3. Results
3.1. Breast cancer case study
According to Table 1.14 in the SEER report [21], the median age of breast cancer patients at death was 68 years. Based on the obituary data, the median age at death was 65 years, notably lower than the official statistic. Fig. 2 shows the age distribution of the obituary subjects and compares it to the age distribution of reported female breast cancer deaths in the US, as provided by NCI's SEER program for the same period (Table 1.13 in [21]). The obituary-based approach appears to overestimate the prevalence of female breast cancer deaths for women younger than 65 years of age and underestimate it for older women. Still, Spearman's correlation coefficient between the obituary-based and SEER-based distributions was 0.981.
Fig. 2.
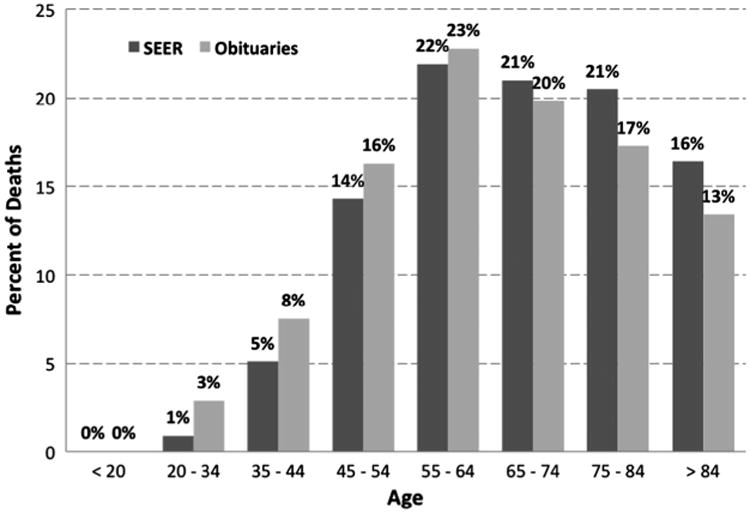
Percent of female breast cancer deaths per age group based on SEER data and obituaries.
We also compared the geospatial distribution of female breast cancer deaths estimated by the American Cancer Society (ACS) [21] with the geospatial distribution of the collected obituaries for the same time period. Fig. 3 shows the proportion of breast cancer obituaries from each US State over the total number of breast cancer obituaries collected across the US as well as the proportion of estimated breast cancer deaths per state over the total number of breast cancer deaths in the US for 2008–2012. The two distributions show very similar trends with correlation coefficient ρ = 0.939.
Fig. 3.
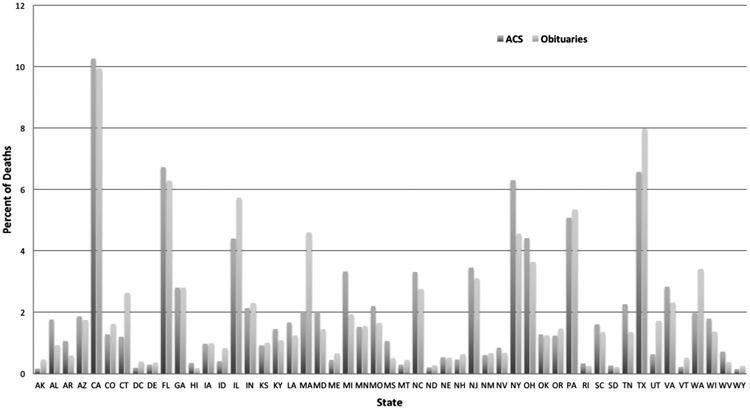
Percent of female breast cancer deaths per US State based on ACS estimates and obituaries.
Finally, we studied the annual trends of female breast cancer deaths. The proportion of reported breast cancer deaths over all deaths for females for the 5-year period 2008–2012 is shown in Table 1. The annual proportions are based on official death statistics [25–29]. Obituary-based proportions were derived by taking the ratio of the number of breast cancer obituaries over the total number of female obituaries collected for a particular year (Fig. 4). The correlation coefficient between the annual obituary-derived proportions and those derived from official death statistics was ρ = 0.611. Please note that obituary-based breast cancer death rates depend on the number of general obituaries collected. Since the purpose of our investigation was to capture only the general trends, the crawling process for general obituaries was not meant to be exhaustive but rather rich enough to collect a sufficiently large number of general obituaries. Since we did not deploy an exhaustive crawling process to collect all online obituaries the crawler could find, direct comparison of obituary-based proportions with official statistics is not relevant but annual change trends are.
Table 1.
Number of obituaries collected per year and obituary-based proportions of female breast cancer deaths for 2008–2012; official death statistics and proportions of female breast cancer deaths for 2008–2012.
| Year | Breast cancer obituaries | General obituaries | Obituary-based proportion of breast cancer deaths | Breast cancer deaths | All deaths | Official proportion of breast cancer deaths |
|---|---|---|---|---|---|---|
| 2008 | 2398 | 34,585 | 0.0693 | 41,026 | 1,245,787 | 0.0319 |
| 2009 | 2432 | 36,708 | 0.0663 | 41,078 | 1,219,784 | 0.0326 |
| 2010 | 2660 | 39,797 | 0.0668 | 41,435 | 1,236,003 | 0.0324 |
| 2011 | 2736 | 45,744 | 0.0598 | 41,374 | 1,260,480 | 0.0318 |
| 2012 | 2490 | 47,081 | 0.0529 | 41,557 | 1,269,557 | 0.0317 |
Fig. 4.
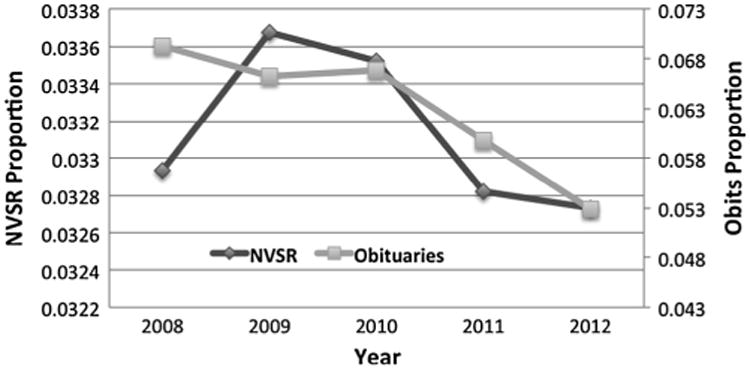
Annual female breast cancer death rates based on obituaries and on National Vital Statistics Report (NVSR) for 2008–2012.
3.2. Lung cancer case study
We repeated the study using the lung cancer obituaries for males and females. Similar consistency of trends was observed with the SEER data for the age distribution (Fig. 5, Spearman's correlation coefficient ρ = 0.994 for both genders, ρ = 0.997 for males, ρ = 0.990 for females), for the geospatial distribution (Fig. 6, ρ = 0.881), and the temporal distribution (Fig. 7, ρ = 0.839 for both genders, ρ = 0.673 for males, ρ = 0.455 for females). Table 2 reports details on the collected obituaries and derived lung cancer death rates per year.
Fig. 5.
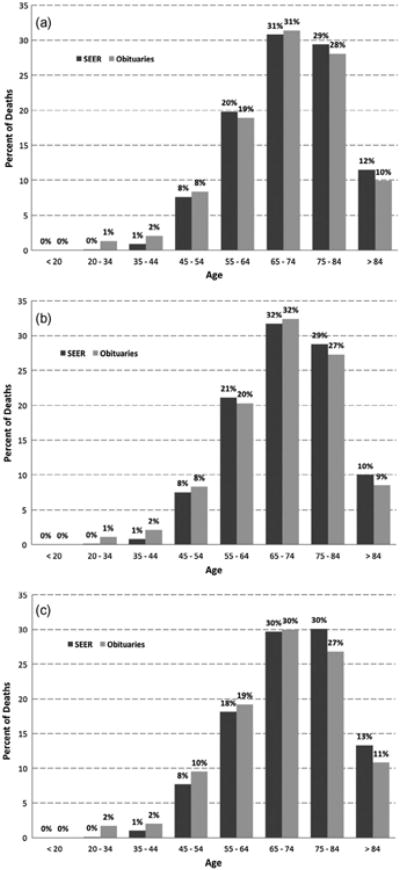
Percent of lung cancer deaths per age group based on SEER data and obituaries for (a) both genders, (b) males only, and (c) females only.
Fig. 6.
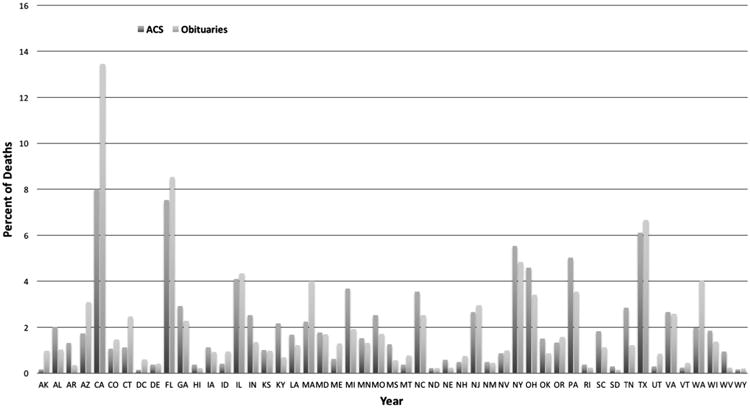
Percent of lung cancer deaths per US State based on ACS estimates and obituaries.
Fig. 7.

Annual lung cancer death rates based on obituaries and on National Vital Statistics Report (NVSR) for 2008–2012: (a) both genders, (b) males, and (c) females.
Table 2.
Number of obituaries collected per year and obituary-based proportions of lung cancer deaths for 2008–2012; official death statistics and proportions of lung cancer deaths for 2008–2012.
| Year | Lung cancer obituaries | General obituaries | Obituary-based proportion of lung cancer deaths | Lung cancer deaths | All deaths | Official proportion of lung cancer deaths |
|---|---|---|---|---|---|---|
| 2008 | 1966 | 70,215 | 0.0280 | 158,656 | 2,471,984 | 0.0642 |
| 2009 | 2027 | 74,494 | 0.0272 | 158,158 | 2,437,163 | 0.0649 |
| 2010 | 2224 | 80,760 | 0.0275 | 158,318 | 2,468,435 | 0.0641 |
| 2011 | 2467 | 92,860 | 0.0266 | 157,017 | 2,515,458 | 0.0624 |
| 2012 | 2450 | 94,695 | 0.0259 | 157,499 | 2,543,279 | 0.0619 |
Similar to breast cancer, the collection phase of online obituaries was not intended to be exhaustive but rather sufficiently large to derive general ascending or descending trends of lung cancer death rates. Therefore, the web-based and official proportions listed in Table 2 should be only compared based on the general trend they convey.
3.3. Impact of sample size
To further assess the reliability of web mining for deriving cancer mortality trends, we repeated the analysis by using smaller subsets of the crawled results; namely the first 2500 and 5000 retrieved obituaries. Table 3 shows the correlation coefficients between the official statistics and the obituary-based statistics data for breast cancer and lung cancer respectively.
Table 3.
Correlation coefficients between the official cancer surveillance statistics and the obituary-based statistics.
| Age distribution | Geospatial distribution | Temporal distribution | |
|---|---|---|---|
| Breast cancer | |||
| All (12,716) obituaries | 0.981 | 0.939 | 0.611 |
| 5000 obituaries | 0.979 | 0.932 | 0.839 |
| 2500 obituaries | 0.956 | 0.926 | 0.648 |
| Lung cancer | |||
| All (11,134) obituaries | 0.994 | 0.881 | 0.839 |
| 5000 obituaries | 0.982 | 0.814 | 0.479 |
| 2500 obituaries | 0.964 | 0.846 | 0.812 |
Overall, study findings remained fairly consistent even when derived from fewer obituaries. Notable inconsistencies were observed for the temporal trends. For breast cancer, using fewer obituaries appeared to capture yearly changes better than when using the full obituary set (ρ = 0.839 vs. ρ = 0.611). For lung cancer however, the opposite was observed. The temporal trends captured using 5000 obituaries were notably less consistent with official statistics (ρ = 0.839 vs. ρ = 0.479).
4. Discussion
Cancer is a disease under national public health surveillance in the US via a number of coordinated Government programs such as CDC's NPCR and NCI's SEER. Different programs cover different segments of the US population. These surveillance programs collect patient-level information regarding cancer incidence, treatment, survival, and death in the geographical regions they cover. Public health officials use the information to track trends over time and understand how different screening and prevention strategies impact cancer incidence and death rates in different geographical regions and population segments. Due to significant manual effort involved for local registries to collect information on an individual case basis and the time needed for data quality assurance, there is typically a three-year lag between the date of diagnosis or death and the posting of information. As the number of cancer patients is expected to increase dramatically due to the aging population [30], the manual effort model is neither cost-effective nor easily scalable.
In this study we tested the hypothesis that data mining of online content is an efficient and reliable approach for automated surveillance of cancer mortality trends. For the initial investigation we focused on breast and lung cancer since these two cancer types are associated with the highest death numbers in the US [2]. Our online information sources were limited only to openly available obituaries. The cause of death is not always listed in obituaries particularly due to the social stigma associated with some causes (e.g., drug addiction, suicide, HIV/AIDS) [31] or due to differences in the privacy needs of individual families. In contrast, cancer carries less of a social stigma and families are less reluctant to mention it openly as the cause of death, particularly for young people. By deploying an intelligent web crawler, we were able to collect automatically a large number of cancer-related obituaries in a few short weeks. For example, we collected almost 13,000 obituaries of women for whom breast cancer was the stated or inferred cause of death for 2008–2012. For the same time period, the national cancer surveillance programs reported approximately 200,000 breast cancer deaths. Although the collected obituaries represent less than 7% of the reported deaths, the sample size was still large enough to capture reliably general mortality trends.
The percent of female breast cancer deaths was highest among women aged 55–64 based on both official statistics as well as obituary-derived estimates. Although obituaries overestimated the percent of breast cancer deaths among younger women and underestimated the percent of breast cancer deaths among older women, the overall distribution was highly correlated with the official statistics (Fig. 2, ρ = 0.981). Similarly high correlation was observed for lung cancer (Fig. 5a, ρ = 0.994), although we did not observe any over- or underestimation trends depending on age when both genders were analyzed together. For female lung cancer deaths however, we observed a similar trend of over-estimation among younger women (Fig. 5c) as with breast cancer when using obituaries as the source of surveillance information. Although this overestimation trend was not as strong for lung cancer as it was for breast cancer, the trend suggests an expected cultural phenomenon; cancer is mentioned more often as the cause of death among middle-aged or young females for whom death is considered premature.
The geographical distribution of breast and lung cancer deaths captured from obituaries was also highly correlated with official reports (ρ > 0.88 for both cancers). Finally, the trend of annual cancer death rates captured via web mining was found to be highly correlated with official statistics although somewhat less consistently for breast cancer (Table 3, ρ = 0.611) than lung cancer (Table 3, ρ = 0.839). Still, in both cases our approach captured the same downward trend in cancer death rate reduction over time as reported by official sources.
In terms of weaknesses of this study, we acknowledge that the presented web informatics approach depends on the societal and cultural trends of publishing online obituary articles. This is particularly true for disclosing the cause of death, an important piece of information that may be disclosed with different consistency for different geographic regions, age groups, and genders. For example, in our study the proportion of cancer deaths captured by our web crawler relative to the number deaths reported by ACS varied dramatically across US states as well as cancer types. For example, for breast cancer the proportion varied from 10% (for Mississippi and Hawaii) to 58% (for Utah and Alaska) with average 23% across the 50 states. For lung cancer, the proportion of deaths captured by the web crawler compared to those reported by ACS was dramatically lower, only 2.67% on average. The number ranged from only 0.5% (for West Virginia, Arkansas, and Kentucky) to 14% (for Alaska). This geographical sampling bias did not appear to be related to geographical regions (i.e., Northeast vs. South vs. West vs. Midwest). Although the general geospatial trends captured with web mining correlated highly with the official reports, this topic deserves further investigation in terms of developing mitigation strategies and adjustment factors to reduce the risk of information and selection bias. Another potential weakness of the proposed approach lies in the inherent limitations of natural language processing (NLP) for automated information extraction. Based on internal validation studies, our rule-based information extraction system has high accuracy for inferring the age (F-score = 0.96) and the gender (F-score = 0.98) of the deceased person. The accuracy of inferring the cause of death is somewhat lower (F-score = 0.88). We are currently exploring advanced NLP approaches based on deep learning to further improve upon the accuracy if the information extraction stage. Finally, additional investigation of the effect of sample size on the observed trends suggested that sampling bias is a potential risk when using web mining for data collection. The agreement between the discovered trends and official statistics fluctuated as the sample size increased for both breast and lung cancers. To mitigate the risk of sampling bias when using web informatics for automated cancer surveillance, the recommended approach is to progressively include more samples until the results safely stabilize.
As cultural trends evolve, we expect our proposed approach to gain broad acceptance as a supplemental source of information for epidemiological discovery and dynamic monitoring of general trends. In addition, as advanced language processing algorithms are developed to infer racial or ethnic background, the same approach could be deployed to study cancer mortality and population demographic trends across the US, as national cancer surveillance programs typically do.
In conclusion, the proposed web informatics method is a novel and promising way to use a non-traditional, openly available, big data source to enhance national cancer surveillance programs in a cost-effective manner.
Acknowledgments
This manuscript has been authored by UT-Battelle, LLC under Contract No. DE-AC05-00OR22725 with the U.S. Department of Energy (DOE). The United States Government retains and the publisher, by accepting the article for publication, acknowledges that the United States Government retains a non-exclusive, paid-up, irrevocable, world-wide license to publish or reproduce the published form of this manuscript, or allow others to do so, for United States Government purposes. The Department of Energy will provide public access to these results of federally sponsored research in accordance with the DOE Public Access Plan (http://en-ergy.gov/downloads/doe-public-access-plan).
This research used resources of the Oak Ridge Leadership Computing Facility, which is a DOE Office of Science User Facility supported under Contract DE-AC05-00OR22725.
The study was supported by the National Cancer Institute at the National Institutes of Health (Grant No. 1R01-CA170508).
Footnotes
This manuscript has been authored by UT-Battelle, LLC under Contract No. DE-AC05-00OR22725 with the U.S. Department of Energy. The United States Government retains and the publisher, by accepting the article for publication, acknowledges that the United States Government retains a non-exclusive, paid-up, irrevocable, world-wide license to publish or reproduce the published form of this manuscript, or allow others to do so, for United States Government purposes. The Department of Energy will provide public access to these results of federally sponsored research in accordance with the DOE Public Access Plan (http://energy.gov/downloads/doe-public-access-plan).
Conflict of interest: The authors declared that there is no conflict of interest.
References
- 1.National Center for Health Statistics, Division of Vital Statistics, Centers for Disease Control. [accessed June 3, 2015]; http://www.cdc.gov/nchs/nvss.htm.
- 2.Siegel R, Miller K, Jemal A. Cancer statistics, 2015. CA: Cancer J Clin. 2015;65(1):5–29. doi: 10.3322/caac.21254. [DOI] [PubMed] [Google Scholar]
- 3.Eysenbach G. Medicine 2.0: social networking, collaboration, participation, apomediation, and openness. J Med Internet Res. 2008;10(3):e22. doi: 10.2196/jmir.1030. [DOI] [PMC free article] [PubMed] [Google Scholar]
- 4.Eysenbach G. Infodemiology and infoveillance tracking online health information and cyberbehavior for public health. Am J Prev Med. 2011;40(5 (Suppl. 2)):S154–S158. doi: 10.1016/j.amepre.2011.02.006. [DOI] [PubMed] [Google Scholar]
- 5.Bernardo TM, Rajic A, Young I, Robiadek K, Pham MT, Funk JA. Scoping review on search queries and social media for disease surveillance: a chronology of innovation. J Med Internet Res. 2013;15(7):e147. doi: 10.2196/jmir.2740. [DOI] [PMC free article] [PubMed] [Google Scholar]
- 6.Steele R. Pervasive and Mobile Sensing and Computing for Healthcare. Springer; Berlin, Heidelberg: 2013. Utilizing Social Media, Mobile Devices and Sensors for Consumer Health Communication: A Framework for Categorizing Emerging Technologies and Techniques; pp. 233–249. [Google Scholar]
- 7.Miller AR, Tucker C. Active social media management: the case of health care. Inform Syst Res. 2013;24(1):52–70. [Google Scholar]
- 8.Brownstein JS, Freifeld CC, Madoff LC. Digital disease detection—harnessing the web for public health surveillance. N Engl J Med. 2009;360(21):2153–2157. doi: 10.1056/NEJMp0900702. [DOI] [PMC free article] [PubMed] [Google Scholar]
- 9.Althouse BM, Scarpino SV, Meyers LA, Ayers JW, Bargsten M, Baumbach J, Brownstein JS, Castro L, Clapham H, Cummings DA, Del Valle S. Enhancing disease surveillance with novel data streams: challenges and opportunities. EPJ Data Sci. 2015;4(1):1–8. doi: 10.1140/epjds/s13688-015-0054-0. [DOI] [PMC free article] [PubMed] [Google Scholar]
- 10.Charles-Smith LE, Reynolds TL, Cameron MA, Conway M, Lau EH, Olsen JM, Pavlin JA, Shigematsu M, Streichert LC, Suda KJ, Corley CD. Using social media for actionable disease surveillance and outbreak management: a systematic literature review. PLoS ONE. 2015;10(10):e0139701. doi: 10.1371/journal.pone.0139701. [DOI] [PMC free article] [PubMed] [Google Scholar]
- 11.Salathe M, Bengtsson L, Bodnar TJ, Brewer DD, Brownstein JS, Buckee C, Campbell EM, Cattuto C, Khandelwal S, Mabry PL, Vespignani A. Digital epidemiology. PLoS Comput Biol. 2012;8(7):e1002616. doi: 10.1371/journal.pcbi.1002616. [DOI] [PMC free article] [PubMed] [Google Scholar]
- 12.Gittelman S, Lange V, Crawford CAG, Okoro CA, Lieb E, Dhingra SS, Trimarchi E. A new source of data for public health surveillance: Facebook likes. J Med Internet Res. 2015;17(4) doi: 10.2196/jmir.3970. [DOI] [PMC free article] [PubMed] [Google Scholar]
- 13.Kass-Hout TA, Alhinnawi H. Social media in public health. Brit Med Bull. 2013;108(1):5–24. doi: 10.1093/bmb/ldt028. [DOI] [PubMed] [Google Scholar]
- 14.Paul MJ, Sarker A, Brownstein JS, Nikfarjam A, Scotch M, Smith KL, Gonzalez G. Social mining for public health monitoring and surveillance. Pacif Symp Biocomput. 2016;21:468–479. [Google Scholar]
- 15.Wicks P, Vaughan TE, Massagli MP, Heywood J. Accelerated clinical discovery using self-reported patient data collected online and a patient-matching algorithm. Nat Biotechnol. 2011;29:411–414. doi: 10.1038/nbt.1837. [DOI] [PubMed] [Google Scholar]
- 16.Yang CC, Jiang L, Yang H, Tang X. Proceedings of ACM SIGKDD Workshop on Health Informatics. Beijing, China: 2012. Detecting signals of adverse drug reactions from health consumer contributed content in social media. [Google Scholar]
- 17.Frost J, Okun S, Vaughan T, Heywood J, Wick P. Patient-reported outcomes as a source of evidence in off-label prescribing: analysis of data from PatientsLikeMe. J Med Internet Res. 2011;13(1):e6. doi: 10.2196/jmir.1643. [DOI] [PMC free article] [PubMed] [Google Scholar]
- 18.Tourassi GD, Yoon HJ, Xu S, Han X. The utility of web mining for epidemiological research: studying the association between parity and cancer risk. J Am Med Inform Assoc. 2015 doi: 10.1093/jamia/ocv141. ocv141. [DOI] [PMC free article] [PubMed] [Google Scholar]
- 19.Khoury MJ, Lam TK, Ioannidis JP, Hartge P, Spitz MR, Buring JE, Chanock SJ, Croyle RT, Goddard KA, Ginsburg GS, Herceg Z. Transforming epidemiology for 21st century medicine and public health. Cancer Epidemiol Biomark Prev. 2013;22(4):508–516. doi: 10.1158/1055-9965.EPI-13-0146. [DOI] [PMC free article] [PubMed] [Google Scholar]
- 20.Lam TK, Spitz M, Schully SD, Khoury MJ. “Drivers” of translational cancer epidemiology in the 21st century: needs and opportunities. Cancer Epidemiol Biomark Prev. 2013;22(2):181–188. doi: 10.1158/1055-9965.EPI-12-1262. [DOI] [PMC free article] [PubMed] [Google Scholar]
- 21.Howlader N, Noone AM, Krapcho M, Garshell J, Miller D, Altekruse SF, Kosary CL, Yu M, Ruhl J, Tatalovich Z, Mariotto A, Lewis DR, Chen HS, Feuer EJ, Cronin KA, editors. SEER Cancer Statistics Review 1975–2012. National Cancer Institute; Bethesda, MD: 2015. [accessed June 3, 2015]. < http://seer.cancer.gov/csr/1975_2012/>. based on November 2014 SEER data submission, posted to the SEER web site, April 2015. [Google Scholar]
- 22.Xu S, Yoon HJ, Tourassi GD. A user-oriented web crawler for selectively acquiring online content in e-health research. Bioinformatics. 2014;30(1):104–114. doi: 10.1093/bioinformatics/btt571. [DOI] [PMC free article] [PubMed] [Google Scholar]
- 23.Hall M, Frank E, Holmes G, Pfahringer B, Reutemann P, Witten IH. The WEKA data mining software: an update. ACM SIGKDD Explor Newsl. 2009;11(1):10–18. [Google Scholar]
- 24.Manning CD, Surdeanu M, Bauer J, Finkel J, Bethard SJ, McClosky D. The Stanford CoreNLP natural language processing toolkit; Proceedings of 52nd Annual Meeting of the Association for Computational Linguistics: System Demonstration; 2014. pp. 55–60. [Google Scholar]
- 25.<http://www.cancer.org/research/cancerfactsstatistics/cancerfactsfigures2008/> (accessed June 3, 2015).
- 26.<http://www.cancer.org/research/cancerfactsstatistics/cancerfactsfigures2009/> (accessed June 3, 2015).
- 27.<http://www.cancer.org/research/cancerfactsstatistics/cancerfactsfigures2010/> (accessed June 3, 2015).
- 28.<http://www.cancer.org/research/cancerfactsstatistics/cancerfactsfigures2011/> (accessed June 3, 2015).
- 29.<http://www.cancer.org/research/cancerfactsstatistics/cancerfactsfigures2012/> (accessed June 3, 2015).
- 30.Weir HK, Thompson TD, Soman A, Møller B, Leadbetter S. The past, present, and future of cancer incidence in the United States: 1975 through 2020. Cancer. 2015;121(11):1827–1837. doi: 10.1002/cncr.29258. [DOI] [PMC free article] [PubMed] [Google Scholar]
- 31.Sand E, Gordon KH, Bresin K. The impact of specifying suicide as the cause of death in an obituary. Crisis. 2013;34:63–66. doi: 10.1027/0227-5910/a000154. [DOI] [PubMed] [Google Scholar]