

ABSTRACT
Introduction: Vaccination with dendritic cells (DCs) has generally not fulfilled its promise in cancer immunotherapy due to ineffective translation of immune responses into clinical responses. A proposed reason for this is intrinsic immune regulatory mechanisms, such as regulatory T cells (Tregs). A metronomic regimen of cyclophosphamide (mCy) has been shown to selectively deplete Tregs. To test this in a clinical setting, we conducted a phase I trial to evaluate the feasibility and safety of vaccination with DCs transfected with mRNA in combination with mCy in patients with metastatic malignant melanoma (MM). In addition, clinical and immunological effect of the treatment was evaluated.
Experimental design: Twenty-two patients were enrolled and treated with six cycles of cyclophosphamide 50 mg orally bi-daily for a week every second week (day 1–7). During the six cycles patients received at least 5 × 10⁶ autologous DCs administered by intradermal (i.d.) injection in the week without chemotherapy. Patients were evaluated 12 and 27 weeks and every 3rd mo thereafter with CT scans according to RECIST 1.0. Blood samples for immune monitoring were collected at baseline, at the time of 4th and 6th vaccines. Immune monitoring consisted of IFNγ ELISpot assay, proliferation assay, and flow cytometry for enumeration of immune cell subsets.
Results: Toxicity was manageable. Eighteen patients were evaluable after six cycles. Of these, nine patients had progressive disease as best response and nine patients achieved stable disease. In three patients minor tumor regression was observed. By IFNγ ELISpot and proliferation assay immune responses were seen in 6/17 and 4/17 patients, respectively; however, no correlation with clinical response was found. The percentage of Tregs was unchanged during treatment.
Conclusion: Treatment with autologous DCs transfected with mRNA in combination with mCy was feasible and safe. Importantly, mCy did not alter the percentage of Tregs in our patient cohort. There was an indication of clinical benefit; however, more knowledge is needed in order for DCs to be exploited as a therapeutic option.
KEYWORDS: Dendritic cell, DC, electroporation, mRNA, metronomic cyclophosphamide, melanoma, vaccination
Abbreviations
- ALC
absolute leucocyte count
- ANC
absolute neutrophil count
- BID
bidaily
- BTLA
B- and T-lymphocyte attenuator
- CBR
clinical benefit rate
- CM
central memory
- CTCAE
Common Terminology Criteria for Adverse Events
- CTLA-4
cytotoxic T-lymphocyte-associated protein 4
- DC
dendritic cell(s)
- DTH
delayed-type hypersensitivity
- EM
effector memory
- EMRA
effector memory RA positive
- FACS
flow cytometry
- i.d.
intraderma
- i.n.
intranodal
- LAG-3
lymphocyte-activation gene 3
- mCy
metronomic regimen of cyclophosphamide
- MDSC
myeloid-derived suppressor cells
- MM
metastatic malignant melanomal
- ON
overnight
- OS
overall survival
- PBL
peripheral blood lymphocyte
- PBMC
peripheral blood mononuclear cells
- PD
progressive disease
- PD-1
programmed cell death-1 protein
- PFS
progression-free survival
- RECIST
Response Evaluation Criteria In Solid Tumors
- SD
stable disease
- TIM-3
T-cell immunoglobulin and mucin domain containing-3
- Tregs
regulatory T cells
Introduction
During the past decade, huge advances have been achieved in the treatment of metastatic melanoma (MM). Especially, the immune checkpoint inhibitors, such as anti-CTLA-4 and anti-PD-1 antibodies, have altered cancer treatment essentially, as these drugs target the immune system, instead of targeting the tumor. Immune checkpoint inhibitors release the brake on the immune system and re-activate already existing anticancer immune responses. Patients benefitting from checkpoint blockade often have durable responses, and for Ipilimumab, pooled analysis shows a plateau in overall survival (OS) at about 20% with follow-up time for up to 10 years in some patients.1 Anti-PD-1 antibodies hold the promise of further improvement with improved response rates compared to Ipilimumab;2 however, long-term benefit from these therapies is not yet determined.
Even with these advances, only a fraction of patients respond to immunotherapy and other strategies are needed. It has been shown that patients with tumors infiltrated by activated immune cells, the so-called immunogenic tumors, have a greater chance of responding to immunotherapy as compared to patients with non-immunogenic tumors.3,4 One proposed way of altering the immune balance is by inducing increased tumor-reactive T-cell frequencies by therapeutic vaccines as reviewed by Spranger and Gajewski.5 A much tried vaccine approach is loading autologous dendritic cells (DCs) with antigens in vitro and injecting the DCs back into the patients taking advantage of their capacity to initiate immune responses. In previous studies, we have loaded DCs with antigens through peptide pulsing6; however, this approach is limited by the HLA-restricted nature of the peptides, which necessitate patient selection based on HLA expression. To overcome this limitation, we tested electroporation of DCs with tumor-associated antigen-encoding mRNA. Indeed, we found that we were able to electroporate DCs with a high transfection efficacy and viability, and DCs were able to induce activation and proliferation of antigen-specific T cells in vitro.7,8
In general, clinical studies evaluating the effect of DC vaccines have been disappointing with only few objective clinical responses and no clear correlation between clinical and immunological response. A possible explanation for this discrepancy is that intrinsic mechanisms in the immune system inhibit the vaccine-induced immune responses. Regulatory T cells (Tregs) have been thought to play a central role in inhibiting immune responses and consequently a lot of effort has been put into finding ways to regulate their number and function. As reviewed by Galuzzi et al.,9 chemotherapy is known to affect the immune system either by direct effects on different immune cell subsets or by the modulation of the tumor microenvironment. In line with this, Ghiringhelli et al. published that a metronomic (low-dose) regimen of the DNA alkylating agent cyclophosphamide (mCy) selectively decreased the number of Tregs and impair their function.10 An enticing notion as a low-dose regimen of chemotherapy expectantly would induce less side effects than standard doses.
Thus, this phase I clinical trial was performed to evaluate the feasibility and safety of therapeutic vaccination with DCs transfected with p53, survivin, and hTERT encoding mRNA in combination with mCy in patients with progressive MM. In addition, clinical and immunological effect of the treatment was evaluated.
Results
Patient characteristics
In total, 26 patients were enrolled in the trial between November 2009 and May 2012. All patients had progressive disease (PD) upon study entry. Four patients were excluded before first vaccination due to an allergic reaction to leukapheresis, brain metastases, atrial fibrillation, and patients were own wish, see patient flowchart, Fig. S1. Four patients were excluded before first evaluation due to rapidly progressing disease, however, are included in the description of PFS and OS. Eighteen patients were available for formal evaluation after receiving six cycles of mCy and six vaccines. Nine patients achieved stable disease as best overall response and nine patients had PD at first evaluation, which translates to a clinical benefit rate (CBR) of 41% (9/22). Four patients had prolonged SD (> 6 mo) and three of these achieved a minor response, however, not enough to fulfill the criteria for a partial response.
Patient characteristics are shown in Table 1. Patient's mean age was 68 (range 41;77) with slightly more females (12/22). The majority of patients were PS 0 (15/22), seven had elevated LDH (>205 U/L) and six patients had stage M1a disease, three had M1b, and thirteen had M1c. All but two patients had received prior treatment for their disease; however, one patient had only had regional treatment.
Table 1.
Patient characteristics.
| Patient no. | Age | Sex | PS | No. of sites | Baseline LDH>ULNa | Stage | Prior therapy | Vacc (no.) | Best responseb | Best change in tumor size (%) | PFS (mo) | OS (mo) | Subsequent therapy |
|---|---|---|---|---|---|---|---|---|---|---|---|---|---|
| 1 | 68 | M | 1 | 3 | No | M1c | IL-2c | 5 | PD (f)d | NAe | 2.1 | 2.8 | None |
| 3 | 73 | F | 0 | 2 | NDf | M1b | IL-2 | 6 | PD | 23 | 2.9 | 38.9 | Ipig, Ipi-rh, Ti |
| 4 | 50 | F | 0 | 1 | No | M1a | HRPj, IL-2 | 10 | SD | −21 | 7.0 | 38.4 | Ipi, Ipi-r, Vk, TILl, T+Im |
| 5 | 50 | M | 0 | 4 | Yes | M1c | IL-2 | 6 | PD | 21 | 3.1 | 10.4 | Ipi |
| 6 | 73 | M | 0 | 4 | No | M1c | Vaccinen, T | 6 | PD | 30 | 2.6 | 5.6 | None |
| 7 | 72 | M | 0 | 3 | No | M1c | RTo, IL-2 | 6 | PD | 25 | 3.0 | 6.4 | Ipi |
| 8 | 50 | F | 0 | 2 | No | M1b | IFNp, HRP, IL-2, RT | 16 | SD | −25 | 12.4 | 30.4 | HRP, surgery |
| 9 | 71 | M | 0 | 1 | No | M1a | RT, IL-2 | 10 | SD | 16 | 5.6 | 23.9 | Ipi, T |
| 13 | 66 | F | 0 | 1 | Yes | M1c | IL-2 | 8 | SD | 0 | 4.6 | 5.9 | None |
| 15 | 51 | M | 0 | 2 | No | M1c | IL-2 | 6 | PD | 24 | 2.6 | 5.9 | None |
| 16 | 77 | F | 1 | 2 | No | M1c | T | 6 | PD | 11 | 3.3 | 12.5 | None |
| 17 | 77 | M | 1 | 1 | No | M1a | None | 10 | SD | −2 | 6.1 | 19.0 | T |
| 19 | 63 | F | 1 | 3 | Yes | M1c | IFN, IL-2, Ipi | 3 | PD (f) | NA | 1.1 | 1.4 | None |
| 20 | 41 | M | 0 | 1 | No | M1a | IL-2, Ipi | 9 | SD | 0 | 5.4 | 43.8 | TIL |
| 22 | 72 | F | 0 | 1 | No | M1a | None | 10 | SD | 18 | 5.8 | 24.0 | T |
| 23 | 43 | F | 0 | 2 | No | M1b | IL-2 | 6 | PD | 12 | 3.0 | 8.4 | T, Ipi |
| 24 | 72 | F | 0 | 1 | No | M1a | HRP | 6 | PD | 76 | 2.8 | 9.0 | T |
| 25 | 68 | F | 1 | 3 | No | M1c | IL-2, RT, Ipi | 6 | PD | 38 | 3.1 | 36.8 | V, T |
| 26 | 63 | F | 0 | 1 | Yes | M1c | IL-2, Ipi | 2 | PD (f) | NA | 1.3 | 3.1 | None |
| 27 | 73 | F | 0 | 2 | Yes | M1c | Ipi, HRP | 9 | SD | 0 | 5.7 | 16.1 | T |
| 28 | 77 | M | 1 | 2 | Yes | M1c | Ipi, T, HRP | 3 | PD (f) | NA | 1.4 | 2.3 | None |
| 29 | 66 | M | 0 | 1 | Yes | M1c | IL-2, Ipi | 10 | SD | 0 | 7.0 | 26.7 | V, T |
| n = 22 | |||||||||||||
| Median | 68 | 3.1 | 10.4 |
LDH upper limit of normal 205 U/L.
Best response according to RECIST.
Interleukin-2.
fast progressive disease (PD).
Not applicable.
Not done.
Ipilimumab.
Ipilimumab re-induction.
Temozolomide.
Hyperthermic regional perfusion.
Vemurafenib.
Adoptive T cell transfer using tumor infiltrating lymphocytes (TIL).
Temozolomide + IDO vaccine.
Ganglioside vaccine.
Local radiotherapy.
adjuvant interferon-α.
Median PFS for the 22 patients was 3.1 mo (95% CI 2.8–3.4) and median OS was 10.4 mo (95% CI 1.5–19.3), see Fig. 1A and B. If patients were grouped according to response, patients achieving SD had a significantly better median OS compared to the PD group (24 mo vs. 6.4 mo, respectively, p = 0.04), see Fig S2. Patients in the SD and PD group were similar when comparing the prognostic parameters LDH, age, PS, and tumor burden (p = 0.52, p = 0.56, p = 0.58, and p = 0.73, respectively).
Figure 1.

Clinical outcome. Kaplan–Meier plot showing progression-free survival (PFS) for all treated patients (A). Overall survival is shown in (B). mo, months.
DTH response was evaluated at baseline in 11 patients, see Table S1. At first evaluation (6th vaccine), DTH responses from seven patients were evaluated, as four patients were excluded due to fast PD. Of these, a positive DTH response, as defined by a red induration > 2 mm 48 h after i.d. injection, was observed in five patients. In four patients, the responses were only present after treatment initiation. However, all of the responses were positive for both DCs with or without antigen and are thus not antigen-specific. Three of the four patients with induced DTH responses achieved stable disease.
Toxicity
Generally, the treatment was well tolerated. Three CTC grade III events were reported. Following leukapheresis, one patient had a lung embolus, which was associated with the catheterization. Anticoagulant treatment was applied and the patient recovered completely. Another patient had a lung embolus and a grade III pleural effusion due to his malignant disease. Apart from these events, only CTC grade I/II events were reported, see Table S2 for most frequent and important events. Also, one patient developed an allergic reaction during leukapheresis and was consequently excluded.
Vaccine characterization
DCs from 17 patients were available for phenotypic surface marker analysis. The markers were found to be expressed in a pattern suggestive of a mature DC phenotype,11 i.e., high expression of costimulatory molecules CD80, CD86, CD40, and maturation markers CD83 and HLA-DR, however, with a lower expression of the homing receptor CCR7 than we have seen in previous trials,6,12 see Table S3. There was no evident difference between DC characteristics in the PD and SD patient group when comparing percentages of marker expressing DCs, see Fig. S3, or MFI of markers (data not shown).
Indirect IFNγ ELISpot
To evaluate if the DCs transfected with p53, survivin, and hTERT encoding mRNA were capable of stimulating the secretion of the proinflammatory cytokine IFNγ, we performed indirect ELISpots in 17 patients with paired samples at baseline, 4th and 6th vaccines. In total, a significant difference in IFNγ secretion from PBLs stimulated with mRNA-transfected DCs compared to mock-electroporated DCs was seen in six out of 17 patients. In Fig. 2A, response patterns are depicted as number of spots pr. 1 × 10⁵ PBLs. Responses were tested statistically using actual spot counts. In one patient (patient 4), the spots developed rapidly in test wells and were too numerous to count and was arbitrarily set to 500 for wells at baseline and time of 4th vaccine. Response pattern were unique in each patient; however, in three patients, a baseline response was observed (pts. 4, 5, and 13). In one, response subsequently disappeared (pt. 13). In another (pt. 5), response was still present at the time of 4th vaccine, however, no longer significant due to high background. In the last (pt. 4), response was sustained during treatment. Interestingly, this patient had tumor shrinkage on scans and prolonged SD > 6 mo. In the three other patients (pts. 3, 6, and 9), a response developed after treatment initiation, indicating a treatment-induced effect. However, for two of these patients, the response was transient and disappeared at the next time point (pts. 6 and 9).
Figure 2.

Indirect IFNγ ELISpot assay from paired samples of 17 patients. ELISpot response patterns are depicted in (A) as number of spots pr. 1 × 10⁵ peripheral blood lymphocytes (PBLs). White columns represent number of spots after stimulation with mRNA transfected DCs (DC vacc) and gray columns after stimulation with mock-electroporated DCs (DC mock). In (B), pooled analysis of all patients is shown. DC vacc is represented with filled symbols and DC mock with open symbols. Horizontal lines represent median values.
Pooled analysis of ELISpot data show no general change in IFNγ secretion during treatment (p = 0.81), see Fig. 2B, no difference between DC vacc or DC mock and no difference between PD and SD patients (data not shown). Clinical and immunological responses were not correlated (data not shown).
Proliferation assay
In addition to investigating IFNγ secretion, we also performed proliferation assays to evaluate if mRNA-transfected DCs were able to stimulate T-cell proliferation in both the CD4+ and CD8+ T-cell subsets. Paired samples from baseline, 4th and 6th vaccines from 17 patients were analyzed.
In total, proliferation responses against mRNA-transfected DCs were seen in 4/17 patients, see Fig. 3A (see Materials and Methods section for response definition). In patients 3 and 6, responses were seen in both CD4+ and CD8+ subsets, whereas responses in patients 4 and 7 were found only in the CD8+ compartment. In patient 3, 4, and 6, responses were only seen at the time of 4th or 6th vaccine, indicating responses could be treatment-induced. In patient 7, a response was seen at baseline, indicating either treatment-induced tolerance or response disappeared due to the progression of disease. Proliferation responses were not associated with clinical response to treatment.
Figure 3.
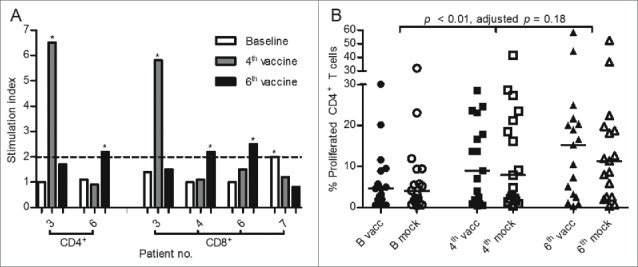
Proliferation assay from paired samples of 17 patients. Proliferation response patterns in CD4+ or CD8+ T-cell subsets are depicted in (A) with *marking responses with a stimulation index ≥ 2. White columns represent baseline, gray the time of 4th vaccine, and black the time of 6th vaccine. The panel (B) depicts pooled analysis of proliferation in the CD4+ T-cell subset in response to DCs electroporated with tumor-associated antigen encoding mRNA (vacc—filled symbols) or mock-electroporated DCs (mock—open symbols). Horizontal lines represent median values.
Pooled analysis of CD4+ T cells showed an increase in proliferation from baseline to the time of 4th and 6th vaccines (p < 0.01, adjusted p = 0.18), see Fig. 3B. However, there is no apparent difference in proliferation between PBLs stimulated with mRNA-transfected DCs or mock-electroporated DCs. A similar analysis of CD8+ T cells shows no change in proliferation during treatment (p = 0.47), see Fig. S4.
Patients 3, 4, and 6 had responses in both ELISpot and proliferation assays. Only patient 4 achieved SD.
White blood cell counts, Tregs, and MDSC
Baseline absolute leucocyte (ALC) and neutrophil counts (ANC) were registered on study entry and data are available for 22 patients. At baseline, there was no difference between leucocyte and neutrophil counts in the SD group as compared to the PD group (data not shown). Baseline data for absolute lymphocyte count were available for 17 patients and also showed no difference between the two groups (data not shown). Full data sets of values from baseline, 4th and 6th vaccines were available for 15 patients for ALC and ANC and 14 patients for absolute lymphocyte count. Both ALC and ANC were unchanged during treatment (data not shown), whereas a significant decrease was seen for absolute lymphocyte count (adjusted p = 0.03), see Fig. S5.
mCy have been reported to selectively deplete Tregs; thus, we performed FACS analysis on both whole blood and cryopreserved PBMCs in order to evaluate the effect of mCy on our patient cohort. In paired samples from baseline, 4th and 6th vaccines from eight patients, we enumerated absolute Treg levels in whole blood and found a borderline significant decline (p = 0.09, adjusted p = 1.95), see Fig. 4A. However, the absolute number of CD4+ T cells also declined (p < 0.01, adjusted p = 0.21), thus leaving the percentage of Tregs of the CD4+ T cells unchanged (p = 0.88), see Fig. 4B and C, respectively. The absolute number of CD8+ T cells was also reduced slightly, see Fig. S6.
Figure 4.

Absolute number of regulatory T cells (Tregs) and CD4+ T cells and percentage of Tregs of the CD4+ T cells in whole blood in paired samples from eight patients. Each symbol represents a value for one patient. Horizontal lines represent median values.
In cryopreserved and thawed PBMCs, we analyzed paired samples from 17 patients and found no difference in the percentage of Tregs as a percentage of CD4+ T cells through the treatment (p = 0.59), see Fig. 5A. In five patients, we had paired samples also including 10th vaccine and even after discontinuation of mCy, there was no increase in Treg levels (data not shown). We also looked at difference in Treg levels in patients with PD or SD at baseline and during treatment, but found no difference between the two groups (data not shown).
Figure 5.

Levels of regulatory T cells (Tregs) (A) and myeloid-derived suppressor cells (MDSCs) (B) in peripheral blood from cryopreserved samples. Paired samples from 17 and 16 patients were available for Treg and MDSC analysis, respectively. In (C) baseline MDSC levels for patient in the progressive disease or stable disease groups are shown. Each symbol represents a value for one patient. Horizontal lines represent median values.
MDSCs are another subset of inhibitory immune cells proposed to be affected by cyclophosphamide. Since we analyzed cryopreserved samples, we only looked at monocytic MDSCs. Paired samples from 16 patients were analyzed. The percentage of MDSCs of live PBMCs did not change throughout treatment (p = 0.83), see Fig. 5B. However, patients obtaining SD had significantly lower levels of MDSCs than patients with PD already at baseline (p = 0.05), see Fig. 5C, and this difference was sustained during treatment (data not shown). MDSC levels were not associated with previous treatment or the number of previous treatments; however, the number of patients was not large enough to formally test this (data not shown).
T-cell phenotyping
In the pursuit of gaining more knowledge on the immunological impact of the treatment, we investigated T-cell phenotype at baseline and during treatment. We performed these analyses on 16 paired samples at three time points. Overall, there was a statistically significant decrease in the median percentage of naïve CD4+ T cells from baseline, to 4th and 6th vaccines (46.78%, 42.62% and 40.21% respectively, adjusted p < 0.01) with a corresponding increase in EM CD4+ T cells (27.86%, 33.03% and 33.84% respectively, p = 0.02, adjusted p = 0.46), see Fig. 6A, whereas CD4+ CM and EMRA T-cell percentages were unchanged. Also, a significant difference was observed between the median percentage of naïve CD4+ T cells in the SD versus the PD group at baseline (p = 0.03), 54.54% vs. 35.86%, respectively), see Fig. 7A. Again, the main corresponding difference was in the EM subset. Thus, there was a distinct difference in the changes of CD4+ T-cell subsets between the two groups, most clearly envisioned by the stable percentage of EM CD4+ T cells in the PD group during treatment, whereas there was an increase in the SD group, see Fig. 7C.
Figure 6.

T-cell phenotype during treatment in the CD4+ (A) and CD8+ subsets (B). Paired samples from 16 patients were available for phenotype analysis. Boxes represent median values and thus cannot be expected to add up to exactly 100%. The percentages of effector memory (EM) T cells are colored black, naive T cells are white, effector memory RA (EMRA) T cells are light gray, and central memory (CM) T cells are dark gray.
Figure 7.

Percentage of naïve T cells at baseline (A+B) and effector memory (EM) CD4+ T cells during treatment (C). Paired samples from 16 patients were available for phenotype analysis. Each symbol represents a value for one patient. Horizontal lines represent median values.
In the CD8+ subset, the percentages of different phenotypes were almost unchanged, see Fig. 6B; however, as seen in the CD4+ subset, there was significantly higher median percentage of naive CD8+ T cells in the SD group versus the PD group at baseline (p = 0.03, 28.52% vs. 7.31%, respectively), see Fig. 7B. In the CD8+ subset, this difference was balanced out by a lower level of EMRA cells in the SD group compared to the PD group (data not shown).
The differences in the percentage of naive T cells of both subsets were not attributable to differences in age, previous treatment, and the number of previous systemic treatments (data not shown). The CD4+/CD8+ T-cell ratio remained unchanged throughout treatment (data not shown).
Activation and exhaustion markers on T cells
A possible explanation for the failure of vaccine trials is the intrinsic inhibitory mechanisms of the immune system. Already inhibitory cell types have been mentioned, but immune regulatory molecules such as CTLA-4, PD-1, LAG-3, TIM-3, and BTLA might also play a role. Analogous to the phenotype and MDSC enumeration, we performed these analyses on paired samples including three time points for 16 patients.
In the CD4+ T-cell subset, there was a statistically significant increase in the percentage of PD-1+ cells (adjusted p = 0.02), TIM-3+ cells (p = 0.05), and BTLA+ cells (p = 0.03) during treatment; however, the latter two were non-significant after adjustment (adjusted p = 0.99 and p = 0.59, respectively), see Fig. 8A–C. For PD-1 and TIM-3, the increase was seen primarily in PD patients, whereas for BTLA the increase was primarily in the SD group, see Fig. 8D–F. For LAG-3 and CTLA-4, there were no changes during treatment (data not shown).
Figure 8.

Expression of PD-1 (A), TIM-3 (B), and BTLA (C) on CD4+ T cells. Paired samples from 16 patients were available for activation marker analysis. In (D+E+F), expression of PD-1, TIM-3, and BTLA, respectively, is divided between patients achieving disease stabilization (SD; n = 9) or not (PD; n = 7). Each symbol represents a value for one patient. Horizontal lines represent median values.
In the CD8+ T-cell subset, only TIM-3 exhibited a borderline significant increase (p < 0.01, adjusted p = 0.13), which was attributable to increases in both SD and PD patients. LAG-3, PD-1, BTLA, and CTLA-4 expression in the CD8+ T-cell subset did not change during treatment (data not shown).
Discussion
In this single-center phase I trial, the primary endpoint was to test safety and feasibility of the treatment with autologous mRNA-transfected DCs and concomitant mCy. The treatment was well tolerated and only mild and manageable side effects were observed. This is in line with what we have seen in previous vaccine studies treating patients with autologous DCs.6,12-14
At the time of inclusion all patients had PD as verified by CT imaging. The CBR was 41%, which is lower than seen in our previous trial using autologous DCs and mCy in combination with IL-2 and Celecoxib.6 Median OS was 10.4 mo, with a significantly longer survival of patients achieving disease stabilization; however, survival data could be affected by the fact that a large proportion of patients had either ipilimumab or vemurafenib as later therapies. Two of the patients received adoptive T-cell transfer with TILs in another clinical trial,15 whereof one (patient 20) achieved complete response and is to date still without evidence of disease. In this patient, TILs showed high reactivity against DCs from the vaccine used in the trial, indicating that vaccine-induced T cells were able to home to the tumor site, however, were unable to induce a clinical response.
We performed immune monitoring using indirect IFNγ ELISpot and proliferation assay and detected responses in 6/17 and 4/17, respectively. Some of the responses were only present after initiation of treatment indicating a treatment induced effect; however, this could also be due to stochastic variation. Spontaneous responses not attributable to the treatment were also detected in some patients. Findings were not consistent between the two assays and response in neither of them could be correlated with clinical benefit. The lack of correlation between immune response and clinical response has also been described by other groups.16,17 A possible explanation is that immune monitoring was performed on immune cells from peripheral blood due to the accessibility; however, conditions of the tumor microenvironment are not necessarily reflected in peripheral blood and inducing an immune response in itself does not automatically translate into an effective antitumor response, if tumors do not express the antigens in the vaccine.18 One way of addressing this issue is by inducing a peripheral tissue immune reaction by i.d. injection of antigen, collect DTH biopsies and analyze antigen-specific skin infiltrating lymphocytes as done by others.19,20
Frequency of in vitro detectable immune responses was lower than expected from other DC vaccination trials17,21,22; however, several factors could be attributable to this. First off, due to using full length mRNA-transfected DCs, the sensitivity of our functional assays was probably not as good as it would have been using peptides alone, as DCs in themselves are stimulatory and thus produce high levels of background. On the other hand, using mRNA encoding full-length protein increases the chance of detecting a response due to the increase in the number of potential immunogenic epitopes. Higher reactivity against mRNA-transfected DCs compared to peptide-pulsed DCs has been reported previously.7 Secondly, patients were treated with chemotherapy and immune cells were in poor shape when looking in the microscope (personal observation). Third, it is possible that adding three mRNA encoding full-length proteins results in competition between immunogenic epitopes and hampers induction of robust T-cell responses. Others have shown that transfection of DCs with three different mRNAs simultaneously does not lead to inferior antigen expression23 or CTL reactivity compared to single mRNA transfection; however, transfection with six mRNAs reduced CTL reactivity drastically.24 Fourth, we selected our TAAs on the basis of reported frequent spontaneous or induced CTL responses in peripheral blood in cancer patients8,25,26; however, it is possible that responses against the vaccine antigens are rare in our patient cohort.
Due to the proposed effect of mCy to selectively deplete Tregs, we treated patients with mCy 50 mg BID biweekly. We did find slightly lower absolute numbers of Tregs; however, this was accompanied with a decrease in absolute lymphocyte count, absolute CD4+ and absolute CD8+ numbers, and so in contrast to Ghiringhelli et al.,10 we neither found a selective decrease in Tregs in whole blood nor in cryopreserved samples, and the percentage of Treg of CD4+ T cells remained unchanged during treatment in our patient cohort. This is in line with previous findings at our center and a randomized phase II trial treating prostate cancer patients when looking at mean frequencies of Tregs.6,27 In a mouse model, mCy preferentially depleted CD8− cells (including Tregs),28 and had synergistic antitumor effects in combination with a vaccine. However, timing of mCy treatment was found to be of great importance, as mCy administration at the same time as or within a week of immunization was detrimental to proliferation of cytotoxic T lymphocytes (CTL). mCy administration 3 mo after immunization did not affect CTLs and data suggested that cells with restimulatory capacity (memory cells) were spared, whereas proliferating CTLs (effector cells) were affected. This finding makes sense due to Cy being a DNA alkylating agent and is supported by findings in another mouse model, where it was demonstrated that Tregs were affected due to higher cell turnover compared to non-regulatory T cells.29 This mechanism could explain the relative decrease in naïve T cells and corresponding relative increase in CD4+ EM subset seen in our study. It could also be speculated that naïve cells differentiated upon antigen recognition when interacting with the mRNA-transfected DCs.
In the studies by Lutsiak et al.29 and Ghiringelli et al.,10 inhibition of Treg functionality was also demonstrated. In the present study, we did not find a selective decrease in Tregs, but we did observe an antigen-independent tendency toward an increased proliferative potential in the CD4+ T-cell compartment in the proliferation assay, indicating attenuated intrinsic immune inhibitory mechanisms. Expression of PD-1 on CD4+ T cells was increased significantly during treatment and could indicate increased immune activation. Others have shown that increased PD-1 expression in malignant disease is a result of skewing of the T-cell phenotype, as EM T cells have higher PD-1 expression (and other immune regulatory receptors) compared to naïve T cells.30-32 Overall this corresponds with our findings, however, does not explain the observation that PD-1 expression primarily was increased in patients not achieving stable disease, whereas the increase in the CD4+ EM subset was more pronounced in the patients achieving stable disease.
In both animal models and in the randomized phase II study treating prostate cancer patients,27,33 MDSCs were demonstrated to be increased by mCy. In contrast, MDSC levels in our study were not changed by treatment. In a previous DC and mCy trial,6 we found an initial decrease in MDSC levels followed by an increase returning to baseline levels. In both trials, MDSC levels were found to be significantly lower in patients with clinical benefit.
In the field of DC research, there has been some debate as to which kind of maturation would provide the most potent DCs. In this study, we used the standard maturation cocktail, which is known to yield DCs lacking production of IL-12 important for T cell priming, whereas others propose to use IL-12 producing DCs which in turn have reduced migratory capacity.34-36 The migratory capacity of DCs is important when injected i.d., however, could be circumvented using intranodal (i.n.) or intratumoral injection37,38; however, i.d. has been shown to be superior to i.n. in terms of immunogenicity and clinical feasibility.39 Furthermore, in addition to antigen loading mRNA, electroporation can be used to induce expression of immune stimulatory molecules such as CD70, CD40L and toll-like receptor 4 or others,37,38 to optimize DC function in vivo.
Even though DC vaccination has generally not fulfilled its promise, there are indications of clinical benefit and induced immune responses. In a parallel study soon to be published (Ahmad et al., submitted), we show that the addition of PD-L1 long peptides to PBMC and transfected DC co-cultures significantly increased reactivity against DCs after two re-stimulations, indicating that self-reactive T cells against PD-L1 epitopes could be activated. It has already been shown that self-reactive T cells specific for PD-L1 are present in the circulation of cancer patients.40 Thus, it can be hypothesized that vaccination with PD-L1 peptides could boost such a response, lead to killing of PD-L1 expressing cells in the tumor microenvironment and by inhibiting the immune suppression, allow an efficient anticancer response.41,42
Also, with the emergence of checkpoint inhibitors, combination with DC vaccines is an obvious approach to fuel the immune cascade leading to tumor control. Indeed, Ribas et al.16 reported that the combination of a CTLA-4 inhibitor (tremelimumab) and DC vaccine induced objective responses at higher ranges than expected with either agent alone. Even more promising is the combination of Ipilimumab and TriMix- DC, which produced objective responses in 38% of treated patients with both complete and durable responses.43
In conclusion, treatment with autologous DCs transfected with p53, survivin, and hTERT encoding mRNA and concomitant mCy regimen was feasible and well tolerated. Sign of clinical benefit was seen, as 9 of 22 (41%) treated patients achieved SD and 3 of 18 evaluable patients experienced tumor shrinkage. In our patient cohort, mCy did not selectively decrease Treg levels. Even with this indication of clinical benefit in some patients, more knowledge on the complex immune interplay is needed in order for DC vaccinations to enter clinical daily life.
Materials and methods
Study design
The study was designed as an open-labeled, non-randomized phase I trial. The primary aim of the study was to evaluate feasibility and safety of the treatment. The secondary aim was to show whether vaccination could induce a measurable immune response and to evaluate clinical effect (objective response rate/CBR, progression-free survival (PFS), and OS.
The protocol was approved by the Scientific Ethics Committee for The Capital Region of Denmark (H-A-2009-013), the Danish Medicines Agency (2612–4030), and the Danish Data Protection Agency and conducted in accordance with the provisions of the Declaration of Helsinki. Written informed consent from the patients was obtained before study entry. ClinicalTrials.gov identifier: NCT00978913.
Patients, treatment and evaluation
Patients with histologically confirmed MM in progression, performance status ≤ 1 (ECOG scale), age > 18 years, life expectancy of > 3 mo, at least one measurable lesion according to response evaluation criteria in solid tumors (RECIST) version 1.0, and absence of brain metastasis were eligible if there were no other treatment options, the patient had no history of other malignancies within 5 years, the patient had not received chemotherapy within 4 weeks, and were not treated with immunosuppressive drugs.
Patients were treated with six cycles of cyclophosphamide 50 mg orally BID for a week every 2nd week (day 1–7). During the six cycles patients received intradermal (i.d.) injection with at least 5 × 10⁶ autologous DCs administered on the proximal thigh during the week without chemotherapy (day 9). If patients continued on treatment after first evaluation, they received DC vaccination alone every 4 weeks, see treatment overview, Fig. S6.
Evaluation with CT scan was performed before treatment (baseline), after 6 (12 weeks), and 10 (27 weeks) vaccines and every 3rd months thereafter until progression. Radiologic evaluation was performed according to RECIST version 1.0. Adverse events were graded according to Common Terminology Criteria for Adverse Events (CTCAE) version 3.0.
A skin test for delayed type hypersensitivity (DTH) was performed as an i.d. injection of 5 × 10⁶ mRNA-transfected DCs on the palmar side of the forearm at baseline, at the time of 4th and 6th vaccines. Negative controls were mock-electroporated DCs and media alone. A red indurated area of >2 mm 48 h after injection was defined as a positive DTH skin test reaction.
Vaccine preparation
DCs were generated as previously described 12 in a facility meeting Good Manufacturing Practice standards and approved by the Danish Medicines Agency. Briefly, patients underwent leukapheresis in order to isolate peripheral blood mononuclear cells (PBMC). PBMCs were incubated in a humidified incubator for 1 h at 37°C to allow plastic adherence. The adherent cell fraction was used for DC culture by incubation for 5 d in X-VIVO15 medium (Lonza, Basel, Switzerland) supplemented with 1% autologous heat-inactivated plasma, 1,000-U/mL GM-CSF (Leukine) (Genzyme, Cambridge MA, USA) and 250-U/mL IL-4 (CellGenix, Freiburg, Germany). Maturation of DCs were performed on days 5–7 with 1,000 -U/mL TNF-α, 1,000-U/mL IL-1β, 1,000-U/mL IL-6 (CellGenix), and 1-µg/mL PGE2 (ProstinE2, Pfizer Freiburg, Germany). Cells were harvested on day 7 and transfected with mRNA. The transfection of mature DCs by electroporation was slightly modified compared to previously described.8 Briefly, mature DCs were washed twice, suspended in Opti-MEM medium (Invitrogen, Paisley, UK) and adjusted to a final cell density of 6.25 × 10⁷ cells/mL. The cell suspension (800 µL) was preincubated in a 4-mm gap electroporation cuvette for 5 min on ice. 20 µg of mRNA encoding p53, survivin, or hTERT were transferred to the cuvette and DCs were pulsed using a BTX 830 square-wave electroporator (Harvard Apparatus, Holliston MA, USA). Electroporation settings were adjusted to a single pulse of 500 V and 2 ms. After electroporation, DCs were rested for 30 min in 37°C X-VIVO 15 before frozen in aliquots of 1 × 10⁷ DCs in 85% autologous serum, 10% DMSO (Wak-Chemie Medical GMBH, Steinbach, Germany), and 5% Glucosteril 40% (Fresenius, Albertslund, Danmark) using automated cryopreservation (Planer freezing unit, Planer, UK). For each patient, a concurrent transfection with green fluorescent protein mRNA was performed as a control (data not shown). Also, p53, survivin, and hTERT mRNA in the vaccine product was confirmed by qPCR (data not shown). Microbiologic and endotoxin controls of DCs were performed on pre-freezing samples.
As previously described,6 DC vaccine was prepared on the day of vaccination, by thawing one vial with a minimum of 5 × 10⁶ DCs, washing twice, resuspending in 500-µL X-VIVO 15, and transferring to a 0.5-mL syringe for injection.
DCs of the vaccine products were phenotypically characterized by flowcytometry using monoclonal antibodies against CCR7, CD54, DC-SIGN (R&D Systems), CD40, CD80, CD86, CD14, OX40L (BD PharMingen), HLA-DR, CD25, CD83 (Caltag Lab (Trichem), and PD-L1 (ebioscience) together with the relevant isotype controls to analyze the expression of cell surface antigens. See Fig. S8 for representative gating strategy.
Plasmid constructs and in vitro transcription of mRNA
The plasmid pCI/hTERT/A102 (kindly provided by Gustav Gaudernack, The Norwegian Radium Hospital, Oslo, Norway) has been described by Saebøe-Larssen et al.44 The plasmid pSP73/p53/A64 was generated as described previously.8 To generate pSP73/surviving/A64, we have subcloned the cDNA encoding survivin into pSP73/A64 (kindly provided by Eli Gilboa, University of Miami Miller School of Medicine Miami, Miami FL, USA). The surviving cDNA fragment was excised from the pGEM-sig-survivin-DClamp plasmid (kindly provided by Kris Thielemans, Medical School of the Vrije Universiteit Brussel, Brussels, Belgium) using restriction site BamH1 and inserted into pSP73/A64 that had been restricted with BamH1 to generate pSP73/surviving/A64.
The generation of p53, survivin, and hTERT mRNA was slightly modified compared to previously described.8 In brief, prior to serving as DNA templates for in vitro transcription, the plasmids pSP73/p53/A64 and pSP73/survivin/A64 were linearized with Spe1, whereas the plasmid pCI/hTERT/A102 was linearized with MfeI, and all linearized plasmids were subsequently purified using Wizard DNA Clean-Up System (Promega, Madison WI, USA). The in vitro transcription was performed with mMESSAGE mMACHINE T7 Ultra kit (Ambion, Austin TX, USA) and mRNA was purified with MEGAclear kit (Ambion) according to manufacturer's instructions. The mRNA length, concentration, and purity were evaluated with the Agilent 2100 Bioanalyzer (Agilent Technologies, Palo Alto CA, USA), using RNA 6000 Nano LabChip Kit (Agilent Technologies) according to manufacturer's instructions. Data analysis was performed with 2100 Bioanalyzer software (Agilent Technologies).
Blood samples
Heparinized blood samples for immune monitoring were collected at baseline and during treatment at the time of 4th and 6th vaccinations. Samples during treatment were taken at the same day as vaccination, which is 2 d after the last dose of cyclophosphamide. Samples were kept at room temperature for a maximum of 4 h until handling according to standard operating procedure. Shortly, PBMC were separated by centrifugation on a Lymphoprep (Takeda, Roskilde, Denmark) density gradient. Aliquots of PBMC were cryopreserved in RPMI medium with 10% AB serum and 10% DMSO using controlled-rate freezing (CoolCell, Biocision) in a –80°C freezer and the next day moved to and stored in liquid nitrogen until analysis. When used for cell culture assays, cells were counted manually using trypan blue exclusion. When thawed for analysis, median live cell yield was 72.1% (data not shown). Data are available upon request.
Indirect IFNγ ELISpot assay
The ELISpot assay was performed according to the guidelines provided by CIP (http://cimt.eu/cimt/files/dl/cip_guidelines.pdf) and a thorough description of the assay has been reported elsewhere.45 Briefly, cryopreserved PBMCs were thawed and rested overnight (ON) in 24-well plates in X-VIVO 15 in a humidified 5% CO2 37°C incubator. The day after, a vial of DCs in excess from vaccine production was thawed, rested for 1 h, washed, resuspended in Opti-MEM and electroporated with p53, survivin, and hTERT encoding mRNA (DC vacc). After electroporation, DCs were transferred directly to 37°C X-VIVO 15 and rested for 30 min. Non-adherent PBMCs (PBLs) were harvested and co-cultured with DCs in a DC to PBL ratio of 1:10 in 2 mL X-VIVO 15 in 24 well plates with a concentration of 2–3 × 10⁶ PBLs/mL for 7 d. On day 1, 40 U/mL IL-2 were added. On day 7, another vial of DC was thawed and handled as described above however also electroporating DCs without mRNA added as control (DC mock). PBLs were harvested and co-cultured with DC vacc in triplicates in a DC:PBL ratio 1:10 aiming at using 3 × 10⁵ PBLs pr. well ON in a nitrocellulose bottomed 96-well plate (MultiScreen MSIPN4W50, Merck Millipore, Billerica MA, USA) precoated with anti-IFNγ antibody (mAb 1-D1K, Mabtech, Sweden) and blocked with X-VIVO 15 before addition of cells. The day after medium was discarded and wells washed prior to addition of biotinylated secondary antibody (mAB 7-B6-1-Biotin, Mabtech). Plates were incubated at room temperature (RT) for 2 h, washed and streptavidin-ALP (Mabtech) was added. Plates were incubated for 1 h at RT before washing and addition of the enzyme substrate BCIP/NBT (Mabtech). Upon appearance of purple spots, the reaction was terminated by washing with tap water. Spots were counted using “Grand” ImmunoSpot S6 Ultimative UV Image Analyzer and analysis software ImmunoSpot 5.0 Analyzer. Positive controls were either PBLs stimulated with the super antigen Staphylococcal enterotoxin B or autologous DCs transfected with mRNA encoding Cytomegalovirus, Epstein-Barr Virus, or Flu virus epitopes. Raw data are available upon request.
Responses are determined using a statistical DFR(2×) method in test wells with >six spots pr. 1 × 10⁵ PBLs.
Proliferation assay
A thorough description of the assay has been reported elsewhere.45 In short, cryopreserved PBMCs were co-cultured for 7 d in the presence of 40-U/mL IL-2 from day 1 as described above. On day 7, PBLs were harvested, stained with PKH26 (Sigma, St. Louis MO, USA) dye according to manufacturer's protocol. Subsequently, DCs and PBLs were co-cultured in triplicates in a 96-well round-bottom plate in a ratio 1:10 aiming at using 3 × 10⁵ PBLs pr. well for 3 d. FACS analysis was performed to make sure that PBLs were adequately and uniformly stained. After 3 d, PBLs were harvested, relevant triplicates pooled, stained with anti-CD3 APC, anti-CD4 HV500, anti-CD8 BV421, and NIR for flow cytometric analysis. To establish background proliferation, a gate was set on PBLs without added DCs and the percentage of proliferation subtracted the percentage of proliferated cells in wells added mRNA-transfected or mock-electroporated DCs. A response was defined post hoc as the percentage of proliferated cells in DC vacc stimulated PBLs being equal to or more than twice the proliferation in DC mock-stimulated PBLs (stimulation index ≥ 2) and more than 5% higher compared to wells with PBLs alone. Staphylococcal enterotoxin B, DCs transfected with mRNA encoding virus epitopes from CMV, EBV, and flu or anti-CD3 antibodies were used for positive controls. A representative example and gating strategy is shown in Fig. S9. Raw data are available upon request.
Flow cytometry on PBMC
Multicolor flow cytometry (FACS) was performed on whole blood to enumerate the Treg subet and on cryopreserved PBMCs to enumerate Treg and myeloid-derived suppressor cell (MDSC) subsets, to evaluate phenotype and the expression of activation or exhaustion markers. Analysis was performed using a FACSCanto II flowcytometer (BD) and FACSDiva software (BD).
Monoclonal antibodies used for PBMC FACS analysis were anti-CD3 APC, anti-CD4 HV500, anti-FoxP3 PE, anti-IgG2a PE, anti-CTLA-4 PE, anti-BTLA PE, anti-PD-1 PE-Cy7, anti-CD33 FITC, anti-HLA-DR PerCP, anti-CD3 PE-Cy7, anti-CD19 PE-Cy7, anti-CD56 PE-Cy7, anti-CD11b APC, anti-CD15 HV500 (BD), anti-CD127 FITC, anti-CD45RA FITC (eBioscience), anti-CD25 BV421, anti-CD27 PerCP, anti-CCR7 PE-Cy7, anti-CD8 BV421, anti-CD14 BV421 (Biolegend), anti-LAG-3 FITC (LifeSpan Bioscience), anti-TIM-3 PerCP (R&D Systems), and life/dead marker NIR APC-Cy7 (Invitrogen). Information on clone is available upon request.
Tregs are defined as being live cells in the lymphocyte gate in the forward side scatter plot, CD3+, CD4+, CD25+, CD127−, and FoxP3+. In analysis performed on whole blood, FoxP3 was not included. MDSCs are defined as being live cells in the PBMC gate in the forward side scatter plot and are lineageneg (CD3−CD19−CD56−), HLA-DR−/low, CD14+, CD11b+, and CD33+. T cells of both CD4+ and CD8+ subsets were further characterized according to phenotype. Naive T cells being CCR7+, CD45RA+; central memory (CM) T cells being CCR7+,CD45RA−; effector memory (EM) T cells being CCR7−, CD45RA−; and effector memory RA positive (EMRA) being CCR7−, CD45RA+. Expression of activation or exhaustion markers programmed cell death protein-1 (PD-1), cytotoxic T-lymphocyte-associated protein 4 (CTLA-4), B- and T-lymphocyte attenuator (BTLA), lymphocyte-activation gene 3 (LAG-3), and T-cell immunoglobulin and mucin domain containing-3 (TIM-3). Representative examples of the gating strategies are shown in Figs. S10A–C and S11.
Statistics
Survival was described using the Kaplan–Meier method and was defined as the time interval from first vaccination until death, last date of follow-up or date of data cut-off (18th August 2014). Progression-free survival was defined as the time interval from first vaccination until radiologic or clinical progression.
Responses in the ELISpot assay was assessed in tests with >six spots pr. 1 × 10⁵ PBLs using the DFR(2×) method as recommended in Ref. 46. A one-way p value ≤ 0.05 was considered significant.
The Wilcoxon Mann–Whitney test was used to explore differences marker values at baseline between responder (SD) and non-responder (PD) subgroups. Median and/or interquartile range was used for descriptive statistics. As this exploratory analysis was done post hoc and was descriptive in nature, no formal multiple testing corrections were performed. p values ≤ 0.05 were considered significant.
Marker values for paired data at different time points were tested with the Friedman test. p values were adjusted using the Holm–Bonferroni correction, taking into account the multiplicity of the number of time points. Adjusted p values ≤ 0.05 was considered significant.
Tests were two-sided except otherwise mentioned and were performed in R version 3.2.2.
Supplementary Material
Disclosure of potential conflicts of interest
No potential conflicts of interest were disclosed.
Acknowledgments
The funders had no role in study design, data collection and analysis, decision to publish, or preparation of the manuscript. Technicians Kirsten Nikolajsen and Eva Gaardsdal are acknowledged for laboratory assistance. Statistician and datamanager Tobias Wirenfeldt Klausen is acknowledged for statistical aid. We thank study nurse Susanne Wehmeyer for helping with practical issues.
Funding
The study was supported by grants awarded by Aase and Ejnar Danielsens Foundation, The Danish Cancer Society, Kirsten and Peter Bangs Foundation, I.M. Daehnfeldt Foundation, Grosserer L. F. Foghts Foundation, Fabrikant Einar Willumsens Mindelegat, Else and Mogens Wedell-Wedellsborg Foundation, Direktør Jacob Madsen & Hustru Olga Madsen Foundation and The Danish Council for Independent Research, Medicines Science (FSS).
References
- 1.Schadendorf D, Hodi FS, Robert C, Weber JS, Margolin K, Hamid O, Patt D, Chen TT, Berman DM, Wolchok JD. Pooled analysis of long-term survival data from Phase II and Phase III trials of ipilimumab in unresectable or metastatic melanoma. J Clin Oncol 2015; 33:1889-94; PMID:25667295; http://dx.doi.org/26027431 10.1200/JCO.2014.56.2736 [DOI] [PMC free article] [PubMed] [Google Scholar]
- 2.Larkin J, Hodi S, Wolchok JD. Combined nivolumab and Ipilimumab or monotherapy in untreated melanoma. N Engl J Med 2015; 373:23-34; PMID:26027431; http://dx.doi.org/ 10.1056/NEJMoa1504030 [DOI] [PMC free article] [PubMed] [Google Scholar]
- 3.Herbst RS, Soria JC, Kowanetz M, Fine GD, Hamid O, Gordon MS, Sosman JA, McDermott DF, Powderly JD, Gettinger SN et al.. Predictive correlates of response to the anti-PD-L1 antibody MPDL3280A in cancer patients. Nature 2014; 515:563-567; PMID:25428504; http://dx.doi.org/ 10.1038/nature14011 [DOI] [PMC free article] [PubMed] [Google Scholar]
- 4.Taube JM, Klein A, Brahmer JR, Xu H, Pan X, Kim JH, Chen L, Pardoll DM, Topalian SL, Anders RA. Association of PD-1, PD-1 ligands, and other features of the tumor immune microenvironment with response to anti-PD-1 therapy. Clin Cancer Res 2014; 20:5064-5074; PMID:24714771; http://dx.doi.org/ 10.1158/1078-0432.CCR-13-3271 [DOI] [PMC free article] [PubMed] [Google Scholar]
- 5.Spranger S, Gajewski T. Rational combinations of immunotherapeutics that target discrete pathways. J Immunother Cancer 2013; 1:16; PMID:24829752; http://dx.doi.org/ 10.1186/2051-1426-1-16 [DOI] [PMC free article] [PubMed] [Google Scholar]
- 6.Ellebaek E, Engell-Noerregaard L, Iversen TZ, Froesig TM, Munir S, Hadrup SR, Andersen MH, Svane IM. Metastatic melanoma patients treated with dendritic cell vaccination, Interleukin-2 and metronomic cyclophosphamide: results from a phase II trial. Cancer Immunol Immunother 2012; 61:1791-804; PMID:22426890; http://dx.doi.org/ 10.1007/s00262-012-1242-4 [DOI] [PMC free article] [PubMed] [Google Scholar]
- 7.Met Ö, Eriksen J, Svane IM. Studies on mRNA electroporation of immature and mature dendritic cells: Effects on their immunogenic potential. Mol Biotechnol 2008; 40:151-160; PMID:18543130; http://dx.doi.org/ 10.1007/s12033-008-9071-6 [DOI] [PubMed] [Google Scholar]
- 8.Met Ö, Balslev E, Flyger H, Svane IM. High immunogenic potential of p53 mRNA-transfected dendritic cells in patients with primary breast cancer. Breast Cancer Res Treat 2011; 125:395-406; PMID:20336365; http://dx.doi.org/ 10.1007/s10549-010-0844-9 [DOI] [PubMed] [Google Scholar]
- 9.Galluzzi L, Senovilla L, Zitvogel L, Kroemer G. The secret ally: Immunostimulation by anticancer drugs. Nat Rev Drug Discov 2012; 11:215-233; PMID:22301798; http://dx.doi.org/ 10.1038/nrd3626 [DOI] [PubMed] [Google Scholar]
- 10.Ghiringhelli F, Menard C, Puig PE, Ladoire S, Roux S, Martin F, Solary E, Le Cesne A, Zitvogel L, Chauffert B. Metronomic cyclophosphamide regimen selectively depletes CD4+CD25+ regulatory T cells and restores T and NK effector functions in end stage cancer patients. Cancer Immunol Immunother 2007; 56:641-8; PMID:16960692; http://dx.doi.org/ 10.1007/s00262-006-0225-8 [DOI] [PMC free article] [PubMed] [Google Scholar]
- 11.Figdor CG, de Vries IJM, Lesterhuis WJ, Melief CJ. Dendritic cell immunotherapy: mapping the way. Nat Med 2004; 10:475-480; PMID:15122249; http://dx.doi.org/ 10.1038/nm1039 [DOI] [PubMed] [Google Scholar]
- 12.Trepiakas R, Berntsen A, Hadrup SR, Bjørn J, Geertsen PF, Straten PT, Andersen MH, Pedersen AE, Soleimani A, Lorentzen T et al.. Vaccination with autologous dendritic cells pulsed with multiple tumor antigens for treatment of patients with malignant melanoma: results from a phase I/II trial. Cytotherapy 2010; 12:721-734; PMID:20429791; http://dx.doi.org/ 10.3109/14653241003774045 [DOI] [PubMed] [Google Scholar]
- 13.Berntsen A, Trepiakas R, Wenandy L, Geertsen PF, Thor Straten P, Andersen MH, Pedersen AE, Claesson MH, Lorentzen T, Johansen JS et al.. Therapeutic dendritic cell vaccination of patients with metastatic renal cell carcinoma: a clinical phase 1/2 trial. J Immunother 2008; 31:771-780; PMID:18779742; http://dx.doi.org/ 10.1097/CJI.0b013e3181833818 [DOI] [PubMed] [Google Scholar]
- 14.Svane IM, Pedersen AE, Johnsen HE, Nielsen D, Kamby C, Gaarsdal E, Nikolajsen K, Buus S, Claesson MH. Vaccination with p53-peptide-pulsed dendritic cells, of patients with advanced breast cancer: Report from a phase I study. Cancer Immunol Immunother 2004; 53:633-641; PMID:14985857; http://dx.doi.org/ 10.1007/s00262-003-0493-5 [DOI] [PMC free article] [PubMed] [Google Scholar]
- 15.Ellebaek E, Iversen TZ, Junker N, Donia M, Engell-Noerregaard L, Met Ö, Hölmich LR, Andersen RS, Hadrup SR, Andersen MH et al.. Adoptive cell therapy with autologous tumor infiltrating lymphocytes and low-dose Interleukin-2 in metastatic melanoma patients. J Transl Med 2012; 10:169; PMID:22909342; http://dx.doi.org/ 10.1186/1479-5876-10-169 [DOI] [PMC free article] [PubMed] [Google Scholar]
- 16.Ribas A, Comin-Anduix B, Chmielowski B, Jalil J, de la Rocha P, McCannel TA, Ochoa MT, Seja E, Villanueva A, Oseguera DK et al.. Dendritic cell vaccination combined with CTLA4 blockade in patients with metastatic melanoma. Clin. Cancer Res 2009; 15:6267-6276; PMID:19789309; http://dx.doi.org/ 10.1158/1078-0432.CCR-09-1254 [DOI] [PMC free article] [PubMed] [Google Scholar]
- 17.Oshita C, Takikawa M, Kume A, Miyata H, Ashizawa T, Iizuka A, Kiyohara Y, Yoshikawa S, Tanosaki R, Yamazaki N et al.. Dendritic cell-based vaccination in metastatic melanoma patients: Phase II clinical trial. Oncol Rep 2012; 28:1131-1138; PMID:22895835; http://dx.doi.org/ 10.3892/or.2012.1956 [DOI] [PMC free article] [PubMed] [Google Scholar]
- 18.Woods K, Knights AJ, Anaka M, Schittenhelm RB, Purcell AW, Behren A, Cebon J. Mismatch in epitope specificities between IFNγ inflamed and uninflamed conditions leads to escape from T lymphocyte killing in melanoma. J Immunother Cancer 2016; 4:10; PMID:26885372; http://dx.doi.org/ 10.1186/s40425-016-0111-7 [DOI] [PMC free article] [PubMed] [Google Scholar]
- 19.Wilgenhof S, Van Nuffel AM, Corthals J, Heirman C, Tuyaerts S, Benteyn D, De Coninck A, Van Riet I, Verfaillie G, Vandeloo J et al.. Therapeutic vaccination with an autologous mRNA electroporated dendritic cell vaccine in patients with advanced melanoma. J Immunother 2011; 34:448-456; PMID:21577140; http://dx.doi.org/ 10.1097/CJI.0b013e31821dcb31 [DOI] [PubMed] [Google Scholar]
- 20.De Vries IJ, Bernsen MR, Lesterhuis WJ, Scharenborg NM, Strijk SP, Gerritsen MJ, Ruiter DJ, Figdor CG, Punt CJ, Adema GJ. Immunomonitoring tumor-specific T cells in delayed-type hypersensitivity skin biopsies after dendritic cell vaccination correlates with clinical outcome. J Clin Oncol 2005; 23:5779-5787; PMID:16110035; http://dx.doi.org/ 10.1200/JCO.2005.06.478 [DOI] [PubMed] [Google Scholar]
- 21.Ribas A, Camacho LH, Lee SM, Hersh EM, Brown CK, Richards JM, Rodriguez MJ, Prieto VG, Glaspy JA, Oseguera DK et al.. Multicenter phase II study of matured dendritic cells pulsed with melanoma cell line lysates in patients with advanced melanoma. J Transl Med 2010; 8:89; PMID:20875102; http://dx.doi.org/ 10.1186/1479-5876-8-89 [DOI] [PMC free article] [PubMed] [Google Scholar]
- 22.Aarntzen EH, Schreibelt G, Bol K, Lesterhuis WJ, Croockewit AJ, de Wilt JH, van Rossum MM, Blokx WA, Jacobs JF, Duiveman-de Boer T et al.. Vaccination with mRNA-electroporated dendritic cells induces robust tumor antigen-specific CD4+ and CD8+ T cells responses in stage III and IV melanoma patients. Clin Cancer Res 2012; 18:5460-5470; PMID:22896657; http://dx.doi.org/ 10.1158/1078-0432.CCR-11-3368 [DOI] [PubMed] [Google Scholar]
- 23.Schaft N, Dörrie J, Thumann P, Beck VE, Müller I, Schultz ES, Kämpgen E, Dieckmann D, Schuler G. Generation of an optimized polyvalent monocyte-derived dendritic cell vaccine by transfecting defined RNAs after rather than before maturation. J Immunol 2005; 174:3087-3097; PMID:15728524; http://dx.doi.org/ 10.4049/jimmunol.174.5.3087 [DOI] [PubMed] [Google Scholar]
- 24.Javorovic M, Wilde S, Zobywalski A, Noessner E, Lennerz V, Wölfel T, Schendel DJ. Inhibitory effect of RNA pool complexity on stimulatory capacity of RNA-pulsed dendritic cells. J Immunother 2008; 31:52-62; PMID:18157012; http://dx.doi.org/ 10.1097/CJI.0b013e31815a1202 [DOI] [PubMed] [Google Scholar]
- 25.Vonderheide RH et al.. Equivalent induction of telomerase-specific cytotoxic T lymphocytes from tumor-bearing patients and healthy individuals advances in brief bearing patients and healthy individuals 1. Cancer Res 2001; 61:8366-8370; PMID:11731409 [PubMed] [Google Scholar]
- 26.Andersen MH, Pedersen LO, Capeller B, Bröcker EB, Becker JC, Thor Straten P. Spontaneous cytotoxic T-Cell responses against survivin-derived MHC Class I-restricted T-Cell epitopes in situ as well as ex vivo in cancer patients advances in brief as well as ex vivo in cancer patients 1. Cancer Res 2001; 61:5964-5968; PMID:11507035 [PubMed] [Google Scholar]
- 27.Noguchi M, Moriya F, Koga N, Matsueda S. A randomized phase II clinical trial of personalized peptide vaccination with metronomic low dose cyclophosphamide in patients with metastatic castration resistant prostate cancer. Cancer Immunol Immunother 2016; 65:151-160; PMID:26728480; http://dx.doi.org/ 10.1007/s00262-015-1781-6 [DOI] [PMC free article] [PubMed] [Google Scholar]
- 28.Hermans IF, Chong TW, Palmowski MJ, Harris AL, Cerundolo V. Synergistic effect of metronomic dosing of cyclophosphamide combined with specific antitumor immunotherapy in a murine melanoma model. Cancer Res 2003; 63:8408-8413; PMID:14679003 [PubMed] [Google Scholar]
- 29.Lutsiak ME, Semnani RT, De Pascalis R, Kashmiri SV, Schlom J, Sabzevari H. Inhibition of CD4+ 25+ T regulatory cell function implicated in enhanced immune response by low-dose cyclophosphamide. Blood 2013; 105:2862-2868; PMID:15591121; http://dx.doi.org/26219463 10.1182/blood-2004-06-2410 [DOI] [PubMed] [Google Scholar]
- 30.Schnorfeil FM, Lichtenegger FS, Emmerig K, Schlueter M, Neitz JS, Draenert R, Hiddemann W, Subklewe M. T cells are functionally not impaired in AML: increased PD-1 expression is only seen at time of relapse and correlates with a shift towards the memory T cell compartment. J Hematol Oncol 2015; 8:93; PMID:26219463; http://dx.doi.org/ 10.1186/s13045-015-0189-2 [DOI] [PMC free article] [PubMed] [Google Scholar]
- 31.Riches JC, Davies JK, McClanahan F, Fatah R, Iqbal S, Agrawal S, Ramsay AG, Gribben JG. T cells from CLLpatients exhibit features of T-cell exhaustion but retain capacity for cytokine production. Blood 2013; 121:1612-1621; PMID:23247726; http://dx.doi.org/ 10.1182/blood-2012-09-457531 [DOI] [PMC free article] [PubMed] [Google Scholar]
- 32.Legat A, Speiser DE, Pircher H, Zehn D, Fuertes Marraco SA. Inhibitory receptor expression depends more dominantly on differentiation and activation than ‘exhaustion’ of human CD8+ T cells. Front Immunol 2013; 4:1-15; PMID:23355837; http://dx.doi.org/ 10.3389/fimmu.2013.00455 [DOI] [PMC free article] [PubMed] [Google Scholar]
- 33.Weir GM, Hrytsenko O, Stanford MM, Berinstein NL, Karkada M, Liwski RS, Mansour M. Metronomic cyclophosphamide enhances HPV16E7 peptide vaccine induced antigen-specific and cytotoxic T-cell mediated antitumor immune response. Oncoimmunology 2014; 3:e953407; PMID:25960932; http://dx.doi.org/ 10.4161/21624011.2014.953407 [DOI] [PMC free article] [PubMed] [Google Scholar]
- 34.Hansen M, Met Ö, Svane IM, Andersen MH. Cellular based cancer vaccines: type 1 polarization of dendritic cells. Curr Med Chem 2012; 19:4239-46; PMID:22834814; http://dx.doi.org/ 10.2174/092986712802884213 [DOI] [PubMed] [Google Scholar]
- 35.Carreno BM, Becker-Hapak M, Huang A, Chan M, Alyasiry A, Lie WR, Aft RL, Cornelius LA, Trinkaus KM, Linette GP. IL-12p70-producing patient DC vaccine elicits Tc1-polarized immunity. J Clin Invest 2013; 123:3383-3394; PMID:23867552; http://dx.doi.org/ 10.1172/JCI68395 [DOI] [PMC free article] [PubMed] [Google Scholar]
- 36.Mailliard RB, Wankowicz-Kalinska A, Cai Q, Wesa A, Hilkens CM, Kapsenberg ML, Kirkwood JM, Storkus WJ, Kalinski P. Alpha-type-1 polarized dendritic cells: A novel immunization tool with optimized CTL-inducing activity. Cancer Res 2004; 64:5934-5937; PMID:15342370; http://dx.doi.org/ 10.1158/0008-5472.CAN-04-1261 [DOI] [PubMed] [Google Scholar]
- 37.Bol KF, Figdor CG, Aarntzen EH, Welzen ME, van Rossum MM, Blokx WA, van de Rakt MW, Scharenborg NM, de Boer AJ, Pots JM et al.. Intranodal vaccination with mRNA-optimized dendritic cells in metastatic melanoma patients. Oncoimmunology 2015; 4:e1019197; PMID:26405571; http://dx.doi.org/ 10.1080/2162402X.2015.1019197 [DOI] [PMC free article] [PubMed] [Google Scholar]
- 38.Van Lint S, Renmans D, Broos K, Goethals L, Maenhout S, Benteyn D, Goyvaerts C, Du Four S, Van der Jeught K, Bialkowski L. Intratumoral delivery of TriMix mRNA results in T-cell activation by cross-presenting dendritic cells. Cancer Immunol Res 2015; 4:1-12; PMID:26659303; http://dx.doi.org/16710345 10.1158/2326-6066.CIR-15-0163 [DOI] [PubMed] [Google Scholar]
- 39.Kyte JA, Mu L, Aamdal S, Kvalheim G, Dueland S, Hauser M, Gullestad HP, Ryder T, Lislerud K, Hammerstad H et al.. Phase I/II trial of melanoma therapy with dendritic cells transfected with autologous tumor-mRNA. Cancer Gene Ther 2006; 13:905-918; PMID:16710345; http://dx.doi.org/ 10.1038/sj.cgt.7700961 [DOI] [PubMed] [Google Scholar]
- 40.Munir S, Andersen GH, Met Ö, Donia M, Frøsig TM, Larsen SK, Klausen TW, Svane IM, Andersen MH. HLA-restricted CTL that are specific for the immune checkpoint ligand PD-L1 occur with high frequency in cancer patients. Cancer Res 2013; 73:1764-1776; PMID:23328583; http://dx.doi.org/ 10.1158/0008-5472.CAN-12-3507 [DOI] [PubMed] [Google Scholar]
- 41.Andersen MH. Potential roles of self-reactive T cells in autoimmunity: lessons from cancer immunology. Immunol Res 2014; 60(2-3):156-64; PMID:25381479; http://dx.doi.org/24091833 10.1007/s12026-014-8559-3 [DOI] [PubMed] [Google Scholar]
- 42.Ahmad SM, Larsen SK, Svane IM, Andersen MH. Harnessing PD-L1-specific cytotoxic T cells for anti-leukemia immunotherapy to defeat mechanisms of immune escape mediated by the PD-1 pathway. Leukemia 2014; 28:236-8; PMID:24091833; http://dx.doi.org/ 10.1038/leu.2013.261 [DOI] [PubMed] [Google Scholar]
- 43.Wilgenhof S, Corthals J, Heirman C, van Baren N, Lucas S, Kvistborg P, Thielemans K, Neyns B. Phase II study of autologous monocyte-derived mrna electroporated dendritic cells (TriMixDC-MEL) plus ipilimumab in patients with pretreated advanced melanoma. J Clin Oncol 2016; 34(12):1330-8; PMID:26926680; http://dx.doi.org/ 10.1200/JCO.2015.63.4121 [DOI] [PubMed] [Google Scholar]
- 44.Sæbøe-Larssen S, Fossberg E, Gaudernack G. mRNA-based electrotransfection of human dendritic cells and induction of cytotoxic T lymphocyte responses against the telomerase catalytic subunit (hTERT). J Immunol Methods 2002; 259:191-203; PMID:11730854; http://dx.doi.org/27236804 10.1016/S0022-1759(01)00506-3 [DOI] [PubMed] [Google Scholar]
- 45.Borch TH, Svane IM, Met Ö. Immune monitoring using mRNA-Transfected dendritic cells. Methods Mol Biol 2016; 1428:245-59; PMID:27236804; http://dx.doi.org/ 10.1007/978-1-4939-3625-0_16 [DOI] [PubMed] [Google Scholar]
- 46.Moodie Z, Price L, Gouttefangeas C, Mander A, Janetzki S, Löwer M, Welters MJ, Ottensmeier C, van der Burg SH, Britten CM. Response definition criteria for ELISPOT assays revisited. Cancer Immunol Immunother 2010; 59:1489-1501; PMID:20549207; http://dx.doi.org/ 10.1007/s00262-010-0875-4 [DOI] [PMC free article] [PubMed] [Google Scholar]
Associated Data
This section collects any data citations, data availability statements, or supplementary materials included in this article.